Thiamine Market Size and Share Forecast Outlook 2025 to 2035

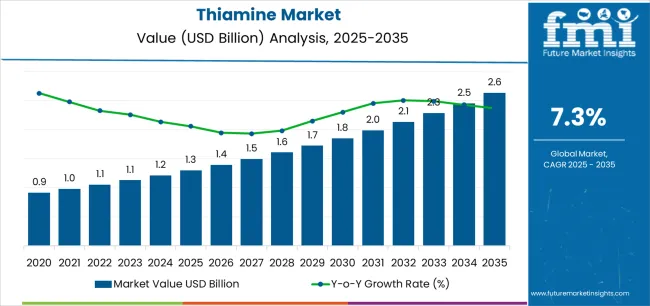
The global thiamine market is likely to reach USD 2.6 billion by 2035, recording an absolute increase of USD 1.4 billion over the forecast period. As per FMI’s comprehensive packaging sector study, reflecting shifts in barrier materials and eco-design strategies, the market is valued at USD 1.3 billion in 2025 and is projected to grow at a CAGR of 7.3% during the forecast period. The overall market size is expected to grow by nearly 2.1 times during the same period, supported by increasing demand for fortified food products and nutritional supplements across global markets, rising health and wellness awareness, driving demand for vitamin-enriched cereals and beverages and growing investments in mandatory food fortification programs, functional food innovation, and dietary supplement manufacturing globally.
Quick Stats for Thiamine Market

  • Thiamine Market Value (2025): USD 1.3 billion
  • Thiamine Market Forecast Value (2035): USD 2.6 billion
  • Thiamine Market Forecast CAGR: 7.3%
  • Leading Product Type in Thiamine Market: Mononitrate
  • Key Growth Regions in Thiamine Market: Asia Pacific, North America, and Europe
  • Top Key Players in Thiamine Market: DSM-Firmenich, BASF SE, Huazhong Pharmaceutical, Jiangxi Tianxin Pharmaceutical, Brother Enterprises, Zhejiang NHU, Lonza Group, Shandong Huarong Pharmaceutical, Glanbia Nutritionals, ADM

Thiamine Market Market Value Analysis

Between 2025 and 2030, the thiamine market is projected to expand from USD 1.3 billion to USD 1.9 billion, resulting in a value increase of USD 0.6 billion, which represents 42.9% of the total forecast growth for the decade. This phase of development will be shaped by rising demand for mandatory food fortification programs in emerging markets, product innovation in bioavailable thiamine derivatives and functional food formulations, as well as expanding integration with nutraceutical supplements and beauty-from-within personal care applications. Companies are establishing competitive positions through investment in high-purity pharmaceutical-grade production, stable mononitrate formulations, and strategic market expansion across food fortification, animal nutrition, and dietary supplement applications.

From 2030 to 2035, the market is forecast to grow from USD 1.9 billion to USD 2.6 billion, adding another USD 0.8 billion, which constitutes 57.1% of the overall ten-year expansion. This period is expected to be characterized by the expansion of specialized thiamine systems, including novel bioavailable derivatives like benfotiamine and advanced delivery formats tailored for specific health applications, strategic collaborations between vitamin manufacturers and food processing companies, and an enhanced focus on clean-label formulations and transparent ingredient sourcing. The growing emphasis on preventive healthcare and functional nutrition will drive demand for advanced, high-quality thiamine solutions across diverse consumer and industrial applications.

Thiamine Market Key Takeaways

Metric Value
Market Value (2025) USD 1.3 billion
Market Forecast Value (2035) USD 2.6 billion
Forecast CAGR (2025-2035) 7.3%

Why is the Thiamine Market Growing?

The thiamine market grows by enabling food manufacturers, pharmaceutical companies, and supplement brands to address widespread micronutrient deficiencies affecting billions globally, particularly in regions where polished rice and refined grains constitute dietary staples. Government mandatory fortification programs across India, Indonesia, and various African nations create sustained demand for food-grade thiamine mononitrate, with wheat flour, rice, and cereal fortification reducing beriberi incidence and supporting neurological health across vulnerable populations. The dietary supplement industry expansion driven by health-conscious consumers requires pharmaceutical-grade thiamine for multivitamin formulations, energy-boosting supplements, and sports nutrition products supporting metabolic function and cellular energy production.

Functional food innovation creates opportunities for thiamine incorporation in fortified beverages, energy drinks, and nutrition bars targeting active lifestyles and cognitive performance enhancement. Animal nutrition applications require thiamine supplementation in livestock, poultry, and aquaculture feeds supporting growth performance and metabolic efficiency, particularly in intensive farming systems utilizing high-energy grain-based diets.

Segmental Analysis

The market is segmented by product type, end use, form, and region. By product type, the market is divided into mononitrate and hydrochloride. Based on end use, the market is categorized into food & beverage, animal feed, pharmaceuticals, and personal care. By form, the market includes tablets & capsules, powders/crystalline, premixes, and injectables. Regionally, the market is divided into Asia Pacific, North America, Europe, and other key regions.
By Product Type, the Mononitrate Segment Accounts for a Dominant Market Share

Thiamine Market Analysis By Product Type

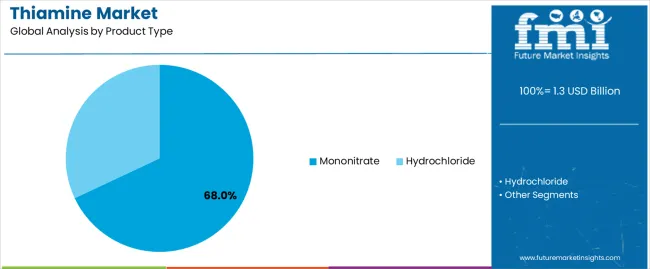
The mononitrate segment represents the dominant force in the thiamine market, capturing approximately 68.0% of total market share in 2025. This form encompasses thiamine mononitrate salt offering superior stability in dry formulations, excellent heat resistance during food processing, and long shelf-life characteristics essential for fortified cereals, flour premixes, and dietary supplement tablets. The mononitrate segment's market leadership stems from regulatory preference for food fortification applications, proven stability during baking and extrusion processes, and cost-effectiveness compared to alternative thiamine derivatives.

The hydrochloride segment maintains 32.0% market share through pharmaceutical injectable applications, animal feed supplementation, and specialized nutraceutical formulations requiring higher water solubility and faster absorption characteristics compared to mononitrate.
  • Superior thermal stability enabling survival through high-temperature food processing including baking, extrusion, and pasteurization
  • Extended shelf-life characteristics maintaining potency over 24-36 months in dry storage conditions
  • Regulatory acceptance globally for mandatory food fortification programs across cereals, flour, and rice applications
  • Cost-effectiveness through established manufacturing processes and economies of scale supporting affordable fortification

By End Use, the Food & Beverage Segment Accounts for the Largest Market Share

Thiamine Market Analysis By End Use

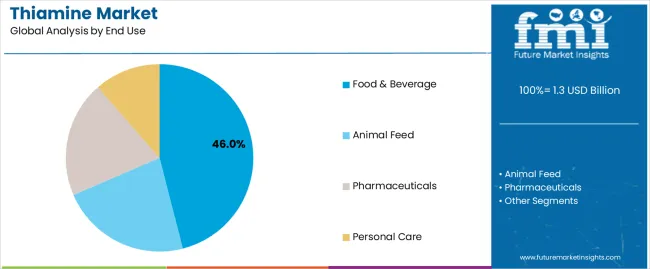
Food & beverage applications dominate the Thiamine Market with approximately 46.0% market share in 2025, reflecting critical roles in fortified cereals, enriched flour products, nutritional beverages, and functional foods supporting population-wide micronutrient adequacy. The food & beverage segment's market leadership is reinforced by mandatory fortification regulations across multiple countries, consumer demand for nutrient-enriched products, and food industry commitment to addressing hidden hunger through widespread product fortification.

Within the food & beverage segment, fortified cereals account for 27.0% of total market share representing the largest single application, while nutritional supplements in food formats capture 19.0% through beverage mixes and nutrition bars. Animal feed applications follow with 22.0% market share supporting livestock, pet, and aquaculture nutrition, while pharmaceuticals represent 20.0% through therapeutic formulations and multivitamin products.
  • Mandatory fortification programs requiring thiamine enrichment in wheat flour, rice, and cornmeal across numerous countries
  • Breakfast cereal consumption supporting nutritional adequacy with ready-to-eat and instant oatmeal products containing added vitamins
  • Functional beverage innovation incorporating B-vitamin complexes in energy drinks, sports recovery beverages, and wellness shots
  • Clean-label consumer preferences driving natural and transparent ingredient sourcing in fortification applications

By Form, the Tablets & Capsules Segment Accounts for the Largest Market Share

Thiamine Market Analysis By Form

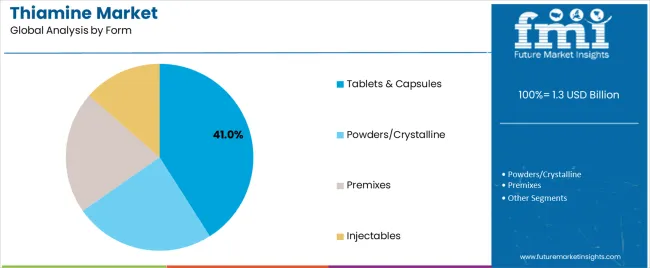
Tablets & capsules dominate the thiamine market with approximately 41.0% market share in 2025, reflecting widespread dietary supplement consumption patterns where solid oral dosage forms provide consumer convenience, precise dosing, and extended shelf-life stability. The tablets & capsules segment's market leadership is supported by established consumer preferences for vitamin supplementation formats, pharmaceutical-grade quality standards, and distribution efficiency through retail pharmacy and e-commerce channels.

Powders and crystalline forms represent 33.0% market share through bulk food fortification, premix manufacturing, and animal feed applications, while premixes capture 19.0% serving convenience for food manufacturers and feed producers. Injectable formulations account for 7.0% market share supporting therapeutic medical applications in hospital settings.

  • Consumer convenience and familiarity with solid oral dosage forms supporting compliance and routine supplementation
  • Precise dosing control enabling standardized vitamin content per unit supporting regulatory labeling requirements
  • Extended stability in blister packaging and bottles protecting thiamine from moisture and oxidation during distribution
  • Retail distribution advantages through pharmacy, grocery, and e-commerce channels serving direct-to-consumer markets

What are the Drivers, Restraints, and Key Trends of the Thiamine Market?

The market is driven by three concrete demand factors tied to nutritional health requirements. Mandatory food fortification programs across emerging economies create increasing demand for food-grade thiamine, with governments in India, Indonesia, Philippines, and various African nations implementing mandatory wheat flour and rice fortification addressing widespread thiamine deficiency affecting 15-30% of populations in regions dependent on polished rice diets, requiring sustained vitamin supplementation supporting neurological function and preventing beriberi. Dietary supplement market expansion driven by health-conscious consumers and aging populations accelerates pharmaceutical-grade thiamine consumption, with global supplement sales growing 8-10% annually as consumers pursue preventive health strategies, energy metabolism support, and cognitive function optimization through B-vitamin complex supplementation.

Market restraints include production capacity concentration among limited Chinese manufacturers creating supply chain vulnerabilities, as disruptions at major facilities including Jiangxi Tianxin Pharmaceutical or Brother Enterprises impact global availability and trigger price volatility affecting downstream formulators and food fortification programs. Regulatory complexity across different markets poses challenges, as permissible fortification levels, approved thiamine derivatives, and labeling requirements vary significantly between USA, EU, India, and other jurisdictions requiring extensive regulatory expertise and country-specific formulation adjustments. Bioavailability limitations of conventional thiamine forms create performance constraints, as poor intestinal absorption and rapid metabolism reduce effectiveness requiring higher doses or specialized delivery systems compared to emerging lipophilic derivatives.

Key trends indicate accelerated adoption of bioavailable thiamine derivatives including benfotiamine and allithiamine, with pharmaceutical research demonstrating superior tissue penetration and therapeutic potential for diabetic neuropathy, cognitive decline, and metabolic disorders despite premium pricing compared to conventional mononitrate. Clean-label formulation demands intensify as consumers scrutinize supplement ingredient lists, driving vitamin manufacturers toward natural fermentation-derived thiamine and transparent supply chain documentation replacing synthetic chemical synthesis routes. Personalized nutrition applications expand through direct-to-consumer testing services identifying individual micronutrient deficiencies and recommending customized supplement regimens including targeted thiamine dosing based on genetic profiles, dietary patterns, and health biomarkers.
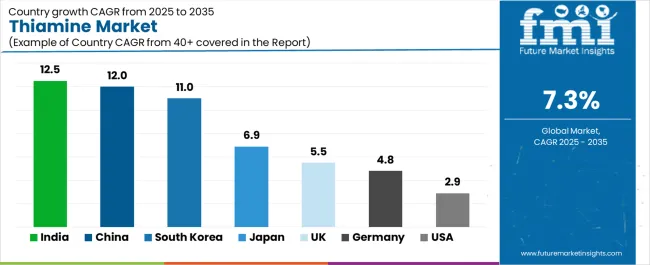
Analysis of the Thiamine Market by Key Country

Thiamine Market Cagr Analysis By Country

Country CAGR (2025-2035)
India 12.5%
China 12.0%
South Korea 11.0%
Japan 6.9%
UK 5.5%
Germany 4.8%
USA 2.9%

The thiamine market is gaining momentum worldwide, with India taking the lead thanks to national fortification programs for rice and wheat coupled with rapid nutraceutical adoption across urban consumer segments. Close behind, China benefits from large-scale premix manufacturing, over-the-counter supplement growth, and personal care incorporation of B1 in beauty-from-within formulations, positioning itself as the dominant production and consumption hub. South Korea shows impressive advancement, where functional beverage innovation and beauty-nutrition crossover formats strengthen its role in premium vitamin markets. Japan stands out for healthy-aging supplement demand and precise pharmaceutical-grade requirements serving quality-conscious consumers, while the United Kingdom, Germany, and United States maintain consistent progress through retail supplement penetration, bakery enrichment programs, and mature cereal fortification respectively. Together, India and China anchor the global expansion story, while the rest build stability and diversity into the market's growth path.

The report covers an in-depth analysis of 40+ countries, Top-performing countries are highlighted below.
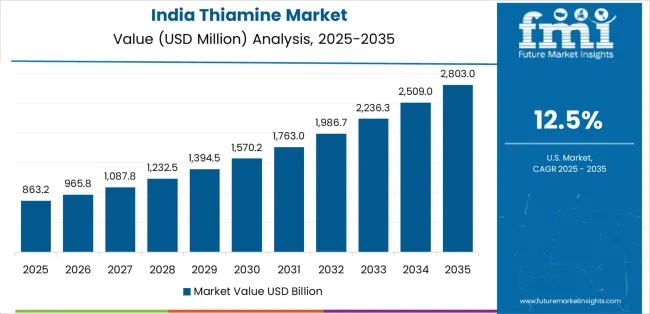
India Leads Global Market Expansion

Thiamine Market Country Value Analysis

India demonstrates the strongest growth potential in the Thiamine Market with a CAGR of 12.5% through 2035. The country's leadership position stems from ambitious national food fortification programs including mandatory rice fortification through the Public Distribution System and wheat flour enrichment under the Eat Right India initiative, government-backed nutraceutical industry development through Production Linked Incentive schemes supporting vitamin manufacturing localization, and rapid middle-class expansion driving dietary supplement consumption across urban centers. Growth is concentrated in major manufacturing clusters including Maharashtra, Gujarat, and Telangana, where pharmaceutical companies and food premix manufacturers are establishing thiamine production and blending facilities. Distribution channels through organized retail expansion, e-commerce platforms including Amazon and Flipkart, and government food distribution networks expand deployment across both urban and rural populations. The country's Food Safety and Standards Authority of India regulations mandate fortification levels for mass-consumption foods, creating sustained institutional demand while consumer awareness campaigns drive voluntary supplement adoption among health-conscious urban populations seeking preventive healthcare solutions.

Key market factors:

  • National fortification mandates requiring thiamine enrichment in rice, wheat flour, and edible oils distributed through public welfare programs
  • Nutraceutical industry expansion supported by government incentives and growing consumer health awareness in metropolitan areas
  • Pharmaceutical manufacturing infrastructure enabling domestic thiamine production reducing import dependencies
  • Rural health initiatives promoting micronutrient supplementation addressing widespread deficiency in underserved populations

China Emerges as Manufacturing Powerhouse

China demonstrates robust growth momentum with a CAGR of 12.0% through 2035, driven by dominant global thiamine manufacturing capacity with major producers including Jiangxi Tianxin Pharmaceutical and Brother Enterprises controlling 60-70% of worldwide production, expanding over-the-counter supplement market serving health-conscious urban consumers, and innovative personal care applications incorporating vitamin B1 in anti-aging skincare and hair growth formulations targeting beauty-conscious demographics. Growth is concentrated in major pharmaceutical manufacturing provinces including Jiangxi, Zhejiang, and Shandong, where integrated vitamin production facilities maintain comprehensive supply chain capabilities from raw materials through finished premixes. Chinese manufacturers demonstrate competitive advantages through production scale, cost efficiency, and vertical integration enabling market leadership in both domestic consumption and global exports. The country's domestic supplement market maturation creates sophisticated consumer segments demanding premium formulations, specialized delivery systems, and combination products addressing specific health concerns beyond basic nutritional adequacy.

  • Dominant manufacturing capacity controlling global thiamine supply chains and setting market pricing dynamics
  • Growing middle-class supplement consumption driven by urbanization, disposable income increases, and health awareness campaigns
  • Personal care industry innovation incorporating B-vitamins in nutricosmetic formulations and functional beauty products
  • E-commerce platforms including Tmall and JD.com facilitating direct-to-consumer supplement sales bypassing traditional pharmacy channels

South Korea Shows Functional Innovation Leadership

South Korea demonstrates impressive growth potential with a CAGR of 11.0% through 2035, driven by advanced functional beverage market incorporating B-vitamin complexes in energy drinks, beauty beverages, and wellness shots targeting convenience-seeking urban consumers, beauty-from-within nutrition trends creating demand for vitamin-enriched supplements supporting skin health and anti-aging alongside topical products, and pharmaceutical-grade supplement manufacturing serving quality-conscious domestic consumers and Asian export markets. Growth is concentrated in Seoul metropolitan area and major cities where health-conscious consumers embrace innovative nutritional formats. Korean consumers demonstrate willingness to adopt premium-priced specialty formulations offering enhanced bioavailability, combination benefits, and scientifically validated health claims. The country's sophisticated regulatory environment and consumer education level support market growth through trusted product certification systems and transparent labeling requirements building consumer confidence in supplement quality and efficacy.

Market characteristics:

  • Functional beverage innovation incorporating vitamin B-complexes in ready-to-drink formats appealing to busy urban lifestyles
  • Beauty-nutrition convergence with supplements marketed for skin health, hair growth, and anti-aging benefits
  • Premium product positioning with high-quality pharmaceutical-grade thiamine commanding price premiums
  • Export orientation serving Asian markets including Japan, Taiwan, and Southeast Asia with K-beauty and K-wellness products

Japan Emphasizes Quality and Aging Demographics

Japan demonstrates moderate growth potential with a CAGR of 6.9% through 2035, driven by super-aging society demographics creating sustained demand for healthy-aging supplements supporting cognitive function and energy metabolism in elderly populations, exceptionally stringent pharmaceutical-grade quality standards exceeding international requirements and commanding premium pricing, and established supplement consumption culture with high per-capita spending on preventive health products. Growth is concentrated in major metropolitan areas including Tokyo, Osaka, and Nagoya where elderly populations maintain active supplement regimens. Japanese consumers demonstrate strong preferences for domestic manufacturing, comprehensive quality documentation, and scientifically validated formulations, creating opportunities for premium positioning and brand differentiation. The country's universal healthcare system emphasizes preventive care and nutritional adequacy, supporting government education campaigns and professional healthcare provider recommendations encouraging supplement use among at-risk elderly populations.

Key market characteristics:

  • Aging population demographics driving supplements targeting cognitive health, energy metabolism, and healthy aging
  • Exceptionally rigorous quality standards creating barriers to entry while supporting premium domestic brands
  • Pharmaceutical distribution channels through registered pharmacies providing professional consultation and trusted product access
  • Consumer preference for combination formulations featuring B-vitamin complexes rather than single-nutrient products

United Kingdom Shows Supplement Market Strength

The UK demonstrates moderate growth potential with a CAGR of 5.5% through 2035, focused on strong retail supplement penetration through supermarkets, pharmacies including Boots and Superdrug, and online platforms serving health-conscious consumers, beauty and haircare product innovation incorporating B-vitamins in nutricosmetic supplements and topical formulations, and functional food development enriching everyday products including fortified bread, breakfast cereals, and plant-based alternatives. Growth is supported by consumer health awareness, preventive healthcare emphasis, and transparent regulatory environment building supplement market trust. British consumers demonstrate increasing interest in beauty-from-within applications combining nutritional supplements with skincare routines, creating opportunities for innovative product positioning and crossover marketing. The country's well-developed retail infrastructure and e-commerce maturity enable efficient distribution across diverse consumer segments from value-conscious buyers to premium wellness enthusiasts.

Leading market segments:

  • Retail supplement sales through supermarkets and pharmacy chains providing convenient access to multivitamins and B-complex products
  • Beauty supplements incorporating thiamine for hair, skin, and nail health appealing to cosmetics consumers
  • Functional food fortification in bread, cereals, and plant-based products meeting clean-label consumer preferences
  • E-commerce subscription services including personalized vitamin packs and direct-to-consumer brands

Germany Maintains Food Fortification Leadership

Germany demonstrates moderate growth potential with a CAGR of 4.8% through 2035, driven by extensive bakery and cereal enrichment traditions supporting nutritional adequacy through widespread product fortification, pharmaceutical-grade premix manufacturing serving European food industry and export markets, and consumer preference for natural health products and preventive nutrition. Growth is concentrated in major food manufacturing regions including North Rhine-Westphalia, Bavaria, and Baden-Württemberg where bakeries, cereal producers, and premix manufacturers maintain operations. German food industry maintains rigorous quality standards and comprehensive nutritional labeling supporting consumer transparency and informed product selection. The country's strong pharmaceutical and chemical manufacturing infrastructure enables high-purity thiamine production meeting stringent EU regulations and supporting premium positioning in regional and global markets.

Market development factors:

  • Bakery product fortification enriching bread, rolls, and baked goods consumed as dietary staples
  • Pharmaceutical-grade premix manufacturing serving European food industry with comprehensive vitamin blends
  • Consumer preference for natural health solutions and preventive nutrition supporting supplement market growth
  • Export-oriented vitamin manufacturing serving EU markets and international customers requiring regulatory compliance documentation

United States Shows Mature Market Stability

The USA demonstrates moderate growth potential with a CAGR of 2.9% through 2035, reflecting mature cereal fortification programs established since 1940s enrichment mandates creating stable baseline demand, steady over-the-counter supplement consumption through established retail channels including CVS, Walgreens, and Walmart, and specialized sports nutrition applications incorporating B-vitamin complexes in pre-workout formulations and energy products. Growth is supported by established regulatory frameworks, sophisticated supplement industry, and consumer familiarity with vitamin supplementation as preventive health strategy. American consumers demonstrate preferences for convenient multivitamin formats, specialized formulations targeting specific demographics or health goals, and combination products offering comprehensive nutritional support. The country's mature market conditions favor innovation in delivery systems, bioavailable derivatives, and personalized nutrition applications rather than substantial volume growth.

Leading market segments:
  • Breakfast cereal fortification maintaining stable demand through established mandatory enrichment programs
  • Over-the-counter multivitamins and B-complex supplements serving mass-market health-conscious consumers
  • Sports nutrition applications incorporating thiamine in energy metabolism support formulations
  • Specialized supplements targeting specific conditions including diabetic neuropathy and cognitive decline

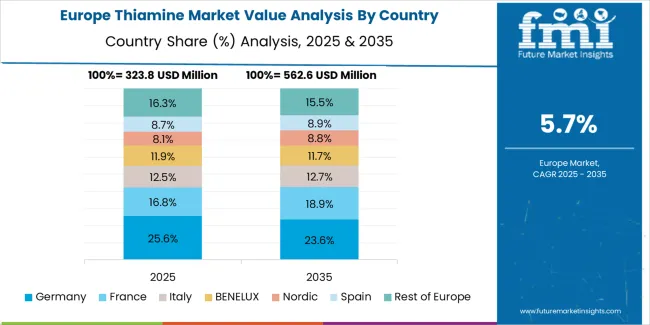
Europe Market Split by Country

Thiamine Market Europe Country Market Share Analysis, 2025 & 2035

Europe accounts for an estimated 27.0% of global thiamine revenue in 2025 at approximately USD 0.4 billion. Within Europe, Germany leads with 22.0% market share supported by strong food fortification programs and pharma-grade premix manufacturing capabilities serving European markets. The United Kingdom follows with 15.0% driven by supplements, functional foods, and personal care innovation incorporating beauty-from-within vitamin formulations, while France holds 14.0% through bakery and cereal fortification plus over-the-counter supplement uptake. Italy commands 12.0% via nutraceutical contract manufacturing and pharmacy retail distribution networks, while Spain accounts for 9.0% through fortified staples and animal nutrition applications. Netherlands captures 8.0% through premix blending facilities and logistics hubs serving European food manufacturers, Nordics hold 7.0% with high supplement penetration and public health campaigns, while Rest of Europe represents 13.0% as Central & Eastern Europe scale local premix capacity. Growth clusters around DACH region, UK, and Northern Italy, with EFSA standards and retailer clean-label demands pushing stable mononitrate grades for cereals, beverages, and tablets ensuring regulatory compliance and consumer acceptance.
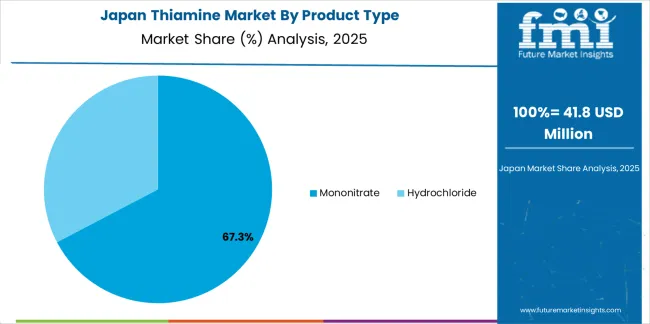
Pharmaceutical Standards Dominate Japanese Vitamin Market

Thiamine Market Japan Market Share Analysis By Product Type

The Japanese Thiamine Market demonstrates a mature and quality-focused landscape, characterized by sophisticated implementation of pharmaceutical-grade vitamin systems supporting healthy-aging supplement formulations, combination B-vitamin complexes, and therapeutic applications addressing metabolic and neurological health. Japan's emphasis on product quality and scientific validation drives demand for rigorously tested thiamine formulations meeting Japanese Pharmacopoeia standards supporting domestic manufacturers and import brands in maintaining consumer trust and professional healthcare provider endorsement. The market benefits from strong partnerships between international vitamin suppliers like DSM-Firmenich, BASF, and domestic pharmaceutical companies including Takeda, Eisai, and Astellas, creating comprehensive distribution ecosystems prioritizing quality assurance and clinical evidence supporting health claims. Manufacturing and distribution centers across major cities showcase advanced quality control implementations where thiamine products achieve consistent potency specifications through integrated analytical testing and stability validation programs supporting Japan's reputation for pharmaceutical excellence.
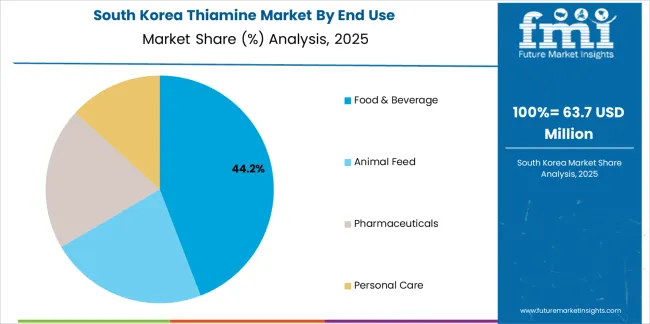
Innovation Drives South Korean Functional Nutrition Market

Thiamine Market South Korea Market Share Analysis By End Use

The South Korean Thiamine Market is characterized by strong innovation focus, with companies including global vitamin suppliers and domestic nutraceutical brands maintaining significant positions through comprehensive functional beverage integration and beauty-nutrition crossover applications. The market demonstrates growing emphasis on convenient ready-to-drink formats and beauty-supporting supplement formulations, as Korean consumers increasingly demand innovative delivery systems integrating with busy urban lifestyles and holistic wellness philosophies combining internal nutrition with external beauty routines. Local nutraceutical companies and K-beauty brands are gaining market share through strategic formulation development combining thiamine with other beauty-supporting nutrients including biotin, collagen, and antioxidants, offering specialized products appealing to appearance-conscious demographics. The competitive landscape shows increasing collaboration between vitamin ingredient suppliers and finished product brands, creating hybrid offerings that combine international ingredient expertise with local consumer insights and marketing sophistication supporting premium positioning in domestic and export markets.

Global Thiamine Market - Stakeholder Contribution Framework

Thiamine (vitamin B1) represents an essential micronutrient that enables food manufacturers, pharmaceutical companies, and supplement brands to address widespread deficiency affecting neurological function, energy metabolism, and cardiovascular health, delivering critical nutritional support for populations dependent on refined grain diets and supporting preventive healthcare strategies. With the market projected to grow from USD 1.3 billion in 2025 to USD 2.6 billion by 2035 at a 7.3% CAGR, these vitamin formulations offer compelling advantages - proven efficacy in addressing beriberi and Wernicke-Korsakoff syndrome, regulatory acceptance for food fortification, and cost-effective supplementation strategies - making them essential for food & beverage applications (46.0% market share), animal feed (22.0% share), and pharmaceuticals seeking solutions to micronutrient malnutrition that compromises population health and economic productivity. Scaling market adoption and sustainable sourcing requires coordinated action across public health policy, food fortification standards, vitamin manufacturers, food processors, and nutrition security investment capital.
How Governments Could Spur Local Production and Adoption?

  • Mandatory Fortification Programs: Implement wheat flour, rice, and edible oil fortification requirements, establish permissible vitamin levels aligned with WHO guidelines, and provide subsidies for fortification premix costs supporting affordable nutritious foods.
  • Domestic Manufacturing Support: Include thiamine production in pharmaceutical and chemical industry incentive programs, provide tax credits for establishing vitamin synthesis facilities, and support technology transfer from international manufacturers reducing import dependencies.
  • Public Health Education: Fund consumer awareness campaigns highlighting thiamine deficiency symptoms and prevention strategies, train healthcare providers on supplementation recommendations, and integrate nutrition education into school curricula.
  • Quality Infrastructure Development: Establish national testing laboratories validating vitamin potency and purity, create certification programs for premix manufacturers, and harmonize regulatory standards with international pharmacopeias facilitating trade.
  • Research & Innovation Funding: Invest in bioavailable thiamine derivative development, food fortification effectiveness studies, and personalized nutrition technologies. Support university-industry partnerships advancing vitamin science and delivery systems.

How Industry Bodies Could Support Market Development?

  • Fortification Standards & Testing: Define standardized fortification protocols for cereals, flour, and beverages across mononitrate (68.0% market dominance) formulations, establish analytical methods validating vitamin stability during processing, and create quality benchmarks ensuring consistent nutritional impact.
  • Application Best Practices: Develop comprehensive guidelines for thiamine use in food manufacturing, premix blending, and supplement formulation, ensuring optimal stability during processing and storage while maintaining bioavailability and organoleptic properties.
  • Supply Chain Transparency: Create traceability frameworks tracking thiamine from synthesis through finished products, establish ethical sourcing standards, and develop sustainability metrics measuring environmental impact of vitamin production.
  • Skills Development & Certification: Establish training programs for food technologists, premix formulators, and quality control specialists on vitamin chemistry, stability testing, and regulatory compliance ensuring industry competency.

How OEMs and Technology Players Could Strengthen the Ecosystem?

  • Bioavailable Formulations: Develop next-generation thiamine derivatives including benfotiamine and sulbutiamine with enhanced tissue penetration, therapeutic efficacy, and gastrointestinal tolerance supporting clinical applications beyond basic nutritional adequacy.
  • Delivery System Innovation: Provide microencapsulation technologies protecting thiamine during food processing, sustained-release formulations improving bioavailability, and taste-masking systems enabling fortification of beverages and liquid supplements.
  • Application Technical Services: Offer stability testing support, fortification protocol development, and regulatory compliance assistance helping food manufacturers and supplement brands achieve target vitamin levels while maintaining product quality.
  • Quality Assurance Systems: Build comprehensive analytical testing, certificate of analysis documentation, and batch traceability supporting pharmaceutical-grade quality standards and regulatory submissions.

How Suppliers Could Navigate the Shift?

  • Application-Focused Development: Develop specialized thiamine grades for food & beverage (46.0% market dominance), animal feed (22.0% share), and pharmaceutical applications, with formulations optimized for specific stability, solubility, and bioavailability requirements.
  • Geographic Market Strategy: Establish production and technical support capabilities in high-growth markets like India (12.5% CAGR) and China (12.0% CAGR), while maintaining R&D centers in established markets for novel derivative development.
  • Regulatory Expertise: Invest in comprehensive regulatory affairs capabilities providing customers with documentation supporting food fortification approvals, supplement registrations, and international trade across diverse regulatory jurisdictions.
  • Customer Partnership Models: Develop long-term relationships with food manufacturers, premix companies, and supplement brands through collaborative formulation development, supply security agreements, and technical consultation services.

How Investors and Financial Enablers Could Unlock Value?

  • Market Leader Investment: Finance established vitamin manufacturers like DSM-Firmenich, BASF, and Chinese producers for capacity expansion, bioavailable derivative development, and sustainable production technology upgrades.
  • Manufacturing Infrastructure Development: Provide capital for regional thiamine synthesis facilities, premix blending plants, and analytical testing laboratories ensuring consistent quality across global supply chains.
  • Innovation & Sustainability: Back biotechnology companies developing fermentation-based thiamine synthesis routes, specialty pharmaceutical firms commercializing therapeutic derivatives, and personalized nutrition startups advancing targeted supplementation.
  • Market Integration: Support strategic partnerships between ingredient suppliers and finished product manufacturers, finance fortification program implementation in emerging markets, and enable vertical integration creating comprehensive nutritional solutions providers.

Competitive Landscape of the Thiamine Market

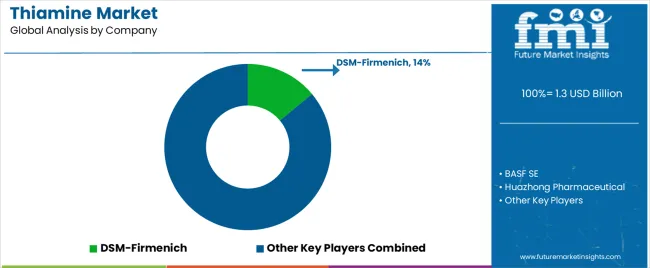
Thiamine Market Analysis By Company

The thiamine market features approximately 15-25 meaningful players with moderate concentration, where the top three companies control roughly 35-42% of global market share through established synthesis platforms, integrated supply chains, and extensive customer relationships. The leading company, DSM-Firmenich, commands approximately 14.0% market share through comprehensive vitamin portfolio, global technical support capabilities, and pharmaceutical-grade quality systems serving food, feed, and pharmaceutical customers. Competition centers on production reliability, quality consistency, regulatory compliance documentation, and technical application support rather than price alone.

Market leaders include DSM-Firmenich, BASF SE, and major Chinese producers including Huazhong Pharmaceutical and Jiangxi Tianxin Pharmaceutical, which maintain competitive advantages through vertically integrated manufacturing, established regulatory approvals, and deep expertise in chemical synthesis, purification, and quality assurance, creating high switching costs for customers relying on validated supply chains and consistent specifications. These companies leverage economies of scale, comprehensive quality documentation, and ongoing technical service relationships to defend market positions while expanding into bioavailable derivatives and specialized applications.

Challengers encompass Brother Enterprises, Zhejiang NHU, and Lonza Group, which compete through production capacity, regional market presence, and specialized formulation capabilities. Ingredient conglomerates including Shandong Huarong Pharmaceutical, Glanbia Nutritionals, and ADM focus on premix manufacturing, food fortification applications, and integrated nutrition solutions offering differentiated capabilities in custom blending and application development.

Regional players and specialized distributors create competitive pressure through localized technical service and flexible supply arrangements, particularly in high-growth markets including India and Southeast Asia where proximity to food manufacturers and supplement brands provides advantages in application development and supply chain responsiveness. Market dynamics favor companies combining manufacturing scale with comprehensive regulatory expertise and technical support addressing complete customer requirements from raw material synthesis through finished product formulation.

Key Players in the Thiamine Market

  • DSM-Firmenich
  • BASF SE
  • Huazhong Pharmaceutical
  • Jiangxi Tianxin Pharmaceutical
  • Brother Enterprises
  • Zhejiang NHU
  • Lonza Group
  • Shandong Huarong Pharmaceutical
  • Glanbia Nutritionals
  • ADM
  • Jubilant Life Sciences
  • Vertellus Holdings LLC
  • Xinfa Pharmaceutical
  • Tianjin Golden World Group

Scope of the Report

Item Value
Quantitative Units USD 1.3 billion
Product Type Mononitrate, Hydrochloride
End Use Food & Beverage (Fortified cereals, Nutritional supplements), Animal Feed (Livestock, Pet, Aquaculture), Pharmaceuticals, Personal Care (Skincare, Haircare)
Form Tablets & Capsules, Powders/Crystalline, Premixes, Injectables
Regions Covered Asia Pacific, North America, Europe, Latin America, Middle East & Africa
Country Covered India, China, South Korea, Japan, United Kingdom, Germany, United States, and 40+ countries
Key Companies Profiled DSM-Firmenich, BASF SE, Huazhong Pharmaceutical, Jiangxi Tianxin Pharmaceutical, Brother Enterprises, Zhejiang NHU, Lonza Group, Shandong Huarong Pharmaceutical, Glanbia Nutritionals, ADM
Additional Attributes Dollar sales by product type, end use, and form categories, regional adoption trends across Asia Pacific, North America, and Europe, competitive landscape with integrated vitamin manufacturers and premix suppliers, fortification requirements and regulatory specifications, integration with food processing, animal nutrition, and pharmaceutical applications, innovations in bioavailable derivatives and delivery systems, and development of sustainable production methods with enhanced quality and traceability characteristics.

Thiamine Market by Segments

Product Type:

  • Mononitrate
  • Hydrochloride

End Use:

  • Food & Beverage
    • Fortified cereals
    • Nutritional supplements (F&B formats)
  • Animal Feed
    • Livestock
    • Pet
    • Aquaculture
  • Pharmaceuticals
  • Personal Care
    • Skincare
    • Haircare

Form:

  • Tablets & Capsules
  • Powders/Crystalline
  • Premixes
  • Injectables

Region:

  • Asia Pacific
    • China
    • India
    • Japan
    • South Korea
    • Australia & New Zealand
    • ASEAN
    • Rest of Asia Pacific
  • North America
    • United States
    • Canada
    • Mexico
  • Europe
    • Germany
    • United Kingdom
    • France
    • Italy
    • Spain
    • Netherlands
    • Nordics
    • Rest of Europe
  • Latin America
    • Brazil
    • Argentina
    • Rest of Latin America
  • Middle East & Africa
    • Saudi Arabia
    • Other GCC Countries
    • Turkey
    • South Africa
    • Rest of Middle East & Africa

Frequently Asked Questions

How big is the thiamine market in 2025?

The global thiamine market is estimated to be valued at USD 1.3 billion in 2025.

What will be the size of thiamine market in 2035?

The market size for the thiamine market is projected to reach USD 2.6 billion by 2035.

How much will be the thiamine market growth between 2025 and 2035?

The thiamine market is expected to grow at a 7.3% CAGR between 2025 and 2035.

What are the key product types in the thiamine market?

The key product types in thiamine market are mononitrate and hydrochloride.

Which end use segment to contribute significant share in the thiamine market in 2025?

In terms of end use, food & beverage segment to command 46.0% share in the thiamine market in 2025.

Table of Content

  1. Executive Summary
    • Global Market Outlook
    • Demand to side Trends
    • Supply to side Trends
    • Technology Roadmap Analysis
    • Analysis and Recommendations
  2. Market Overview
    • Market Coverage / Taxonomy
    • Market Definition / Scope / Limitations
  3. Market Background
    • Market Dynamics
      • Drivers
      • Restraints
      • Opportunity
      • Trends
    • Scenario Forecast
      • Demand in Optimistic Scenario
      • Demand in Likely Scenario
      • Demand in Conservative Scenario
    • Opportunity Map Analysis
    • Product Life Cycle Analysis
    • Supply Chain Analysis
    • Investment Feasibility Matrix
    • Value Chain Analysis
    • PESTLE and Porter’s Analysis
    • Regulatory Landscape
    • Regional Parent Market Outlook
    • Production and Consumption Statistics
    • Import and Export Statistics
  4. Global Market Analysis 2020 to 2024 and Forecast, 2025 to 2035
    • Historical Market Size Value (USD Million) Analysis, 2020 to 2024
    • Current and Future Market Size Value (USD Million) Projections, 2025 to 2035
      • Y to o to Y Growth Trend Analysis
      • Absolute $ Opportunity Analysis
  5. Global Market Pricing Analysis 2020 to 2024 and Forecast 2025 to 2035
  6. Global Market Analysis 2020 to 2024 and Forecast 2025 to 2035, By Product Type
    • Introduction / Key Findings
    • Historical Market Size Value (USD Million) Analysis By Product Type , 2020 to 2024
    • Current and Future Market Size Value (USD Million) Analysis and Forecast By Product Type , 2025 to 2035
      • Mononitrate
      • Hydrochloride
    • Y to o to Y Growth Trend Analysis By Product Type , 2020 to 2024
    • Absolute $ Opportunity Analysis By Product Type , 2025 to 2035
  7. Global Market Analysis 2020 to 2024 and Forecast 2025 to 2035, By End Use
    • Introduction / Key Findings
    • Historical Market Size Value (USD Million) Analysis By End Use, 2020 to 2024
    • Current and Future Market Size Value (USD Million) Analysis and Forecast By End Use, 2025 to 2035
      • Food & Beverage
      • Animal Feed
      • Pharmaceuticals
      • Personal Care
    • Y to o to Y Growth Trend Analysis By End Use, 2020 to 2024
    • Absolute $ Opportunity Analysis By End Use, 2025 to 2035
  8. Global Market Analysis 2020 to 2024 and Forecast 2025 to 2035, By Form
    • Introduction / Key Findings
    • Historical Market Size Value (USD Million) Analysis By Form, 2020 to 2024
    • Current and Future Market Size Value (USD Million) Analysis and Forecast By Form, 2025 to 2035
      • Tablets & Capsules
      • Powders/Crystalline
      • Premixes
      • Injectables
    • Y to o to Y Growth Trend Analysis By Form, 2020 to 2024
    • Absolute $ Opportunity Analysis By Form, 2025 to 2035
  9. Global Market Analysis 2020 to 2024 and Forecast 2025 to 2035, By Region
    • Introduction
    • Historical Market Size Value (USD Million) Analysis By Region, 2020 to 2024
    • Current Market Size Value (USD Million) Analysis and Forecast By Region, 2025 to 2035
      • North America
      • Latin America
      • Western Europe
      • Eastern Europe
      • East Asia
      • South Asia and Pacific
      • Middle East & Africa
    • Market Attractiveness Analysis By Region
  10. North America Market Analysis 2020 to 2024 and Forecast 2025 to 2035, By Country
    • Historical Market Size Value (USD Million) Trend Analysis By Market Taxonomy, 2020 to 2024
    • Market Size Value (USD Million) Forecast By Market Taxonomy, 2025 to 2035
      • By Country
        • USA
        • Canada
        • Mexico
      • By Product Type
      • By End Use
      • By Form
    • Market Attractiveness Analysis
      • By Country
      • By Product Type
      • By End Use
      • By Form
    • Key Takeaways
  11. Latin America Market Analysis 2020 to 2024 and Forecast 2025 to 2035, By Country
    • Historical Market Size Value (USD Million) Trend Analysis By Market Taxonomy, 2020 to 2024
    • Market Size Value (USD Million) Forecast By Market Taxonomy, 2025 to 2035
      • By Country
        • Brazil
        • Chile
        • Rest of Latin America
      • By Product Type
      • By End Use
      • By Form
    • Market Attractiveness Analysis
      • By Country
      • By Product Type
      • By End Use
      • By Form
    • Key Takeaways
  12. Western Europe Market Analysis 2020 to 2024 and Forecast 2025 to 2035, By Country
    • Historical Market Size Value (USD Million) Trend Analysis By Market Taxonomy, 2020 to 2024
    • Market Size Value (USD Million) Forecast By Market Taxonomy, 2025 to 2035
      • By Country
        • Germany
        • UK
        • Italy
        • Spain
        • France
        • Nordic
        • BENELUX
        • Rest of Western Europe
      • By Product Type
      • By End Use
      • By Form
    • Market Attractiveness Analysis
      • By Country
      • By Product Type
      • By End Use
      • By Form
    • Key Takeaways
  13. Eastern Europe Market Analysis 2020 to 2024 and Forecast 2025 to 2035, By Country
    • Historical Market Size Value (USD Million) Trend Analysis By Market Taxonomy, 2020 to 2024
    • Market Size Value (USD Million) Forecast By Market Taxonomy, 2025 to 2035
      • By Country
        • Russia
        • Poland
        • Hungary
        • Balkan & Baltic
        • Rest of Eastern Europe
      • By Product Type
      • By End Use
      • By Form
    • Market Attractiveness Analysis
      • By Country
      • By Product Type
      • By End Use
      • By Form
    • Key Takeaways
  14. East Asia Market Analysis 2020 to 2024 and Forecast 2025 to 2035, By Country
    • Historical Market Size Value (USD Million) Trend Analysis By Market Taxonomy, 2020 to 2024
    • Market Size Value (USD Million) Forecast By Market Taxonomy, 2025 to 2035
      • By Country
        • China
        • Japan
        • South Korea
      • By Product Type
      • By End Use
      • By Form
    • Market Attractiveness Analysis
      • By Country
      • By Product Type
      • By End Use
      • By Form
    • Key Takeaways
  15. South Asia and Pacific Market Analysis 2020 to 2024 and Forecast 2025 to 2035, By Country
    • Historical Market Size Value (USD Million) Trend Analysis By Market Taxonomy, 2020 to 2024
    • Market Size Value (USD Million) Forecast By Market Taxonomy, 2025 to 2035
      • By Country
        • India
        • ASEAN
        • Australia & New Zealand
        • Rest of South Asia and Pacific
      • By Product Type
      • By End Use
      • By Form
    • Market Attractiveness Analysis
      • By Country
      • By Product Type
      • By End Use
      • By Form
    • Key Takeaways
  16. Middle East & Africa Market Analysis 2020 to 2024 and Forecast 2025 to 2035, By Country
    • Historical Market Size Value (USD Million) Trend Analysis By Market Taxonomy, 2020 to 2024
    • Market Size Value (USD Million) Forecast By Market Taxonomy, 2025 to 2035
      • By Country
        • Kingdom of Saudi Arabia
        • Other GCC Countries
        • Turkiye
        • South Africa
        • Other African Union
        • Rest of Middle East & Africa
      • By Product Type
      • By End Use
      • By Form
    • Market Attractiveness Analysis
      • By Country
      • By Product Type
      • By End Use
      • By Form
    • Key Takeaways
  17. Key Countries Market Analysis
    • USA
      • Pricing Analysis
      • Market Share Analysis, 2024
        • By Product Type
        • By End Use
        • By Form
    • Canada
      • Pricing Analysis
      • Market Share Analysis, 2024
        • By Product Type
        • By End Use
        • By Form
    • Mexico
      • Pricing Analysis
      • Market Share Analysis, 2024
        • By Product Type
        • By End Use
        • By Form
    • Brazil
      • Pricing Analysis
      • Market Share Analysis, 2024
        • By Product Type
        • By End Use
        • By Form
    • Chile
      • Pricing Analysis
      • Market Share Analysis, 2024
        • By Product Type
        • By End Use
        • By Form
    • Germany
      • Pricing Analysis
      • Market Share Analysis, 2024
        • By Product Type
        • By End Use
        • By Form
    • UK
      • Pricing Analysis
      • Market Share Analysis, 2024
        • By Product Type
        • By End Use
        • By Form
    • Italy
      • Pricing Analysis
      • Market Share Analysis, 2024
        • By Product Type
        • By End Use
        • By Form
    • Spain
      • Pricing Analysis
      • Market Share Analysis, 2024
        • By Product Type
        • By End Use
        • By Form
    • France
      • Pricing Analysis
      • Market Share Analysis, 2024
        • By Product Type
        • By End Use
        • By Form
    • India
      • Pricing Analysis
      • Market Share Analysis, 2024
        • By Product Type
        • By End Use
        • By Form
    • ASEAN
      • Pricing Analysis
      • Market Share Analysis, 2024
        • By Product Type
        • By End Use
        • By Form
    • Australia & New Zealand
      • Pricing Analysis
      • Market Share Analysis, 2024
        • By Product Type
        • By End Use
        • By Form
    • China
      • Pricing Analysis
      • Market Share Analysis, 2024
        • By Product Type
        • By End Use
        • By Form
    • Japan
      • Pricing Analysis
      • Market Share Analysis, 2024
        • By Product Type
        • By End Use
        • By Form
    • South Korea
      • Pricing Analysis
      • Market Share Analysis, 2024
        • By Product Type
        • By End Use
        • By Form
    • Russia
      • Pricing Analysis
      • Market Share Analysis, 2024
        • By Product Type
        • By End Use
        • By Form
    • Poland
      • Pricing Analysis
      • Market Share Analysis, 2024
        • By Product Type
        • By End Use
        • By Form
    • Hungary
      • Pricing Analysis
      • Market Share Analysis, 2024
        • By Product Type
        • By End Use
        • By Form
    • Kingdom of Saudi Arabia
      • Pricing Analysis
      • Market Share Analysis, 2024
        • By Product Type
        • By End Use
        • By Form
    • Turkiye
      • Pricing Analysis
      • Market Share Analysis, 2024
        • By Product Type
        • By End Use
        • By Form
    • South Africa
      • Pricing Analysis
      • Market Share Analysis, 2024
        • By Product Type
        • By End Use
        • By Form
  18. Market Structure Analysis
    • Competition Dashboard
    • Competition Benchmarking
    • Market Share Analysis of Top Players
      • By Regional
      • By Product Type
      • By End Use
      • By Form
  19. Competition Analysis
    • Competition Deep Dive
      • DSM-Firmenich
        • Overview
        • Product Portfolio
        • Profitability by Market Segments (Product/Age /Sales Channel/Region)
        • Sales Footprint
        • Strategy Overview
          • Marketing Strategy
          • Product Strategy
          • Channel Strategy
      • BASF SE
      • Huazhong Pharmaceutical
      • Jiangxi Tianxin Pharmaceutical
      • Brother Enterprises
      • Zhejiang NHU
      • Lonza Group
      • Shandong Huarong Pharmaceutical
      • Glanbia Nutritionals
      • ADM
      • Jubilant Life Sciences
      • Vertellus Holdings LLC
      • Xinfa Pharmaceutical
      • Tianjin Golden World Group
  20. Assumptions & Acronyms Used
  21. Research Methodology

List of Tables

  • Table 1: Global Market Value (USD Million) Forecast by Region, 2020 to 2035
  • Table 2: Global Market Value (USD Million) Forecast by Product Type , 2020 to 2035
  • Table 3: Global Market Value (USD Million) Forecast by End Use, 2020 to 2035
  • Table 4: Global Market Value (USD Million) Forecast by Form, 2020 to 2035
  • Table 5: North America Market Value (USD Million) Forecast by Country, 2020 to 2035
  • Table 6: North America Market Value (USD Million) Forecast by Product Type , 2020 to 2035
  • Table 7: North America Market Value (USD Million) Forecast by End Use, 2020 to 2035
  • Table 8: North America Market Value (USD Million) Forecast by Form, 2020 to 2035
  • Table 9: Latin America Market Value (USD Million) Forecast by Country, 2020 to 2035
  • Table 10: Latin America Market Value (USD Million) Forecast by Product Type , 2020 to 2035
  • Table 11: Latin America Market Value (USD Million) Forecast by End Use, 2020 to 2035
  • Table 12: Latin America Market Value (USD Million) Forecast by Form, 2020 to 2035
  • Table 13: Western Europe Market Value (USD Million) Forecast by Country, 2020 to 2035
  • Table 14: Western Europe Market Value (USD Million) Forecast by Product Type , 2020 to 2035
  • Table 15: Western Europe Market Value (USD Million) Forecast by End Use, 2020 to 2035
  • Table 16: Western Europe Market Value (USD Million) Forecast by Form, 2020 to 2035
  • Table 17: Eastern Europe Market Value (USD Million) Forecast by Country, 2020 to 2035
  • Table 18: Eastern Europe Market Value (USD Million) Forecast by Product Type , 2020 to 2035
  • Table 19: Eastern Europe Market Value (USD Million) Forecast by End Use, 2020 to 2035
  • Table 20: Eastern Europe Market Value (USD Million) Forecast by Form, 2020 to 2035
  • Table 21: East Asia Market Value (USD Million) Forecast by Country, 2020 to 2035
  • Table 22: East Asia Market Value (USD Million) Forecast by Product Type , 2020 to 2035
  • Table 23: East Asia Market Value (USD Million) Forecast by End Use, 2020 to 2035
  • Table 24: East Asia Market Value (USD Million) Forecast by Form, 2020 to 2035
  • Table 25: South Asia and Pacific Market Value (USD Million) Forecast by Country, 2020 to 2035
  • Table 26: South Asia and Pacific Market Value (USD Million) Forecast by Product Type , 2020 to 2035
  • Table 27: South Asia and Pacific Market Value (USD Million) Forecast by End Use, 2020 to 2035
  • Table 28: South Asia and Pacific Market Value (USD Million) Forecast by Form, 2020 to 2035
  • Table 29: Middle East & Africa Market Value (USD Million) Forecast by Country, 2020 to 2035
  • Table 30: Middle East & Africa Market Value (USD Million) Forecast by Product Type , 2020 to 2035
  • Table 31: Middle East & Africa Market Value (USD Million) Forecast by End Use, 2020 to 2035
  • Table 32: Middle East & Africa Market Value (USD Million) Forecast by Form, 2020 to 2035

List of Figures

  • Figure 1: Global Market Pricing Analysis
  • Figure 2: Global Market Value (USD Million) Forecast 2020-2035
  • Figure 3: Global Market Value Share and BPS Analysis by Product Type , 2025 and 2035
  • Figure 4: Global Market Y to o to Y Growth Comparison by Product Type , 2025-2035
  • Figure 5: Global Market Attractiveness Analysis by Product Type
  • Figure 6: Global Market Value Share and BPS Analysis by End Use, 2025 and 2035
  • Figure 7: Global Market Y to o to Y Growth Comparison by End Use, 2025-2035
  • Figure 8: Global Market Attractiveness Analysis by End Use
  • Figure 9: Global Market Value Share and BPS Analysis by Form, 2025 and 2035
  • Figure 10: Global Market Y to o to Y Growth Comparison by Form, 2025-2035
  • Figure 11: Global Market Attractiveness Analysis by Form
  • Figure 12: Global Market Value (USD Million) Share and BPS Analysis by Region, 2025 and 2035
  • Figure 13: Global Market Y to o to Y Growth Comparison by Region, 2025-2035
  • Figure 14: Global Market Attractiveness Analysis by Region
  • Figure 15: North America Market Incremental Dollar Opportunity, 2025-2035
  • Figure 16: Latin America Market Incremental Dollar Opportunity, 2025-2035
  • Figure 17: Western Europe Market Incremental Dollar Opportunity, 2025-2035
  • Figure 18: Eastern Europe Market Incremental Dollar Opportunity, 2025-2035
  • Figure 19: East Asia Market Incremental Dollar Opportunity, 2025-2035
  • Figure 20: South Asia and Pacific Market Incremental Dollar Opportunity, 2025-2035
  • Figure 21: Middle East & Africa Market Incremental Dollar Opportunity, 2025-2035
  • Figure 22: North America Market Value Share and BPS Analysis by Country, 2025 and 2035
  • Figure 23: North America Market Value Share and BPS Analysis by Product Type , 2025 and 2035
  • Figure 24: North America Market Y to o to Y Growth Comparison by Product Type , 2025-2035
  • Figure 25: North America Market Attractiveness Analysis by Product Type
  • Figure 26: North America Market Value Share and BPS Analysis by End Use, 2025 and 2035
  • Figure 27: North America Market Y to o to Y Growth Comparison by End Use, 2025-2035
  • Figure 28: North America Market Attractiveness Analysis by End Use
  • Figure 29: North America Market Value Share and BPS Analysis by Form, 2025 and 2035
  • Figure 30: North America Market Y to o to Y Growth Comparison by Form, 2025-2035
  • Figure 31: North America Market Attractiveness Analysis by Form
  • Figure 32: Latin America Market Value Share and BPS Analysis by Country, 2025 and 2035
  • Figure 33: Latin America Market Value Share and BPS Analysis by Product Type , 2025 and 2035
  • Figure 34: Latin America Market Y to o to Y Growth Comparison by Product Type , 2025-2035
  • Figure 35: Latin America Market Attractiveness Analysis by Product Type
  • Figure 36: Latin America Market Value Share and BPS Analysis by End Use, 2025 and 2035
  • Figure 37: Latin America Market Y to o to Y Growth Comparison by End Use, 2025-2035
  • Figure 38: Latin America Market Attractiveness Analysis by End Use
  • Figure 39: Latin America Market Value Share and BPS Analysis by Form, 2025 and 2035
  • Figure 40: Latin America Market Y to o to Y Growth Comparison by Form, 2025-2035
  • Figure 41: Latin America Market Attractiveness Analysis by Form
  • Figure 42: Western Europe Market Value Share and BPS Analysis by Country, 2025 and 2035
  • Figure 43: Western Europe Market Value Share and BPS Analysis by Product Type , 2025 and 2035
  • Figure 44: Western Europe Market Y to o to Y Growth Comparison by Product Type , 2025-2035
  • Figure 45: Western Europe Market Attractiveness Analysis by Product Type
  • Figure 46: Western Europe Market Value Share and BPS Analysis by End Use, 2025 and 2035
  • Figure 47: Western Europe Market Y to o to Y Growth Comparison by End Use, 2025-2035
  • Figure 48: Western Europe Market Attractiveness Analysis by End Use
  • Figure 49: Western Europe Market Value Share and BPS Analysis by Form, 2025 and 2035
  • Figure 50: Western Europe Market Y to o to Y Growth Comparison by Form, 2025-2035
  • Figure 51: Western Europe Market Attractiveness Analysis by Form
  • Figure 52: Eastern Europe Market Value Share and BPS Analysis by Country, 2025 and 2035
  • Figure 53: Eastern Europe Market Value Share and BPS Analysis by Product Type , 2025 and 2035
  • Figure 54: Eastern Europe Market Y to o to Y Growth Comparison by Product Type , 2025-2035
  • Figure 55: Eastern Europe Market Attractiveness Analysis by Product Type
  • Figure 56: Eastern Europe Market Value Share and BPS Analysis by End Use, 2025 and 2035
  • Figure 57: Eastern Europe Market Y to o to Y Growth Comparison by End Use, 2025-2035
  • Figure 58: Eastern Europe Market Attractiveness Analysis by End Use
  • Figure 59: Eastern Europe Market Value Share and BPS Analysis by Form, 2025 and 2035
  • Figure 60: Eastern Europe Market Y to o to Y Growth Comparison by Form, 2025-2035
  • Figure 61: Eastern Europe Market Attractiveness Analysis by Form
  • Figure 62: East Asia Market Value Share and BPS Analysis by Country, 2025 and 2035
  • Figure 63: East Asia Market Value Share and BPS Analysis by Product Type , 2025 and 2035
  • Figure 64: East Asia Market Y to o to Y Growth Comparison by Product Type , 2025-2035
  • Figure 65: East Asia Market Attractiveness Analysis by Product Type
  • Figure 66: East Asia Market Value Share and BPS Analysis by End Use, 2025 and 2035
  • Figure 67: East Asia Market Y to o to Y Growth Comparison by End Use, 2025-2035
  • Figure 68: East Asia Market Attractiveness Analysis by End Use
  • Figure 69: East Asia Market Value Share and BPS Analysis by Form, 2025 and 2035
  • Figure 70: East Asia Market Y to o to Y Growth Comparison by Form, 2025-2035
  • Figure 71: East Asia Market Attractiveness Analysis by Form
  • Figure 72: South Asia and Pacific Market Value Share and BPS Analysis by Country, 2025 and 2035
  • Figure 73: South Asia and Pacific Market Value Share and BPS Analysis by Product Type , 2025 and 2035
  • Figure 74: South Asia and Pacific Market Y to o to Y Growth Comparison by Product Type , 2025-2035
  • Figure 75: South Asia and Pacific Market Attractiveness Analysis by Product Type
  • Figure 76: South Asia and Pacific Market Value Share and BPS Analysis by End Use, 2025 and 2035
  • Figure 77: South Asia and Pacific Market Y to o to Y Growth Comparison by End Use, 2025-2035
  • Figure 78: South Asia and Pacific Market Attractiveness Analysis by End Use
  • Figure 79: South Asia and Pacific Market Value Share and BPS Analysis by Form, 2025 and 2035
  • Figure 80: South Asia and Pacific Market Y to o to Y Growth Comparison by Form, 2025-2035
  • Figure 81: South Asia and Pacific Market Attractiveness Analysis by Form
  • Figure 82: Middle East & Africa Market Value Share and BPS Analysis by Country, 2025 and 2035
  • Figure 83: Middle East & Africa Market Value Share and BPS Analysis by Product Type , 2025 and 2035
  • Figure 84: Middle East & Africa Market Y to o to Y Growth Comparison by Product Type , 2025-2035
  • Figure 85: Middle East & Africa Market Attractiveness Analysis by Product Type
  • Figure 86: Middle East & Africa Market Value Share and BPS Analysis by End Use, 2025 and 2035
  • Figure 87: Middle East & Africa Market Y to o to Y Growth Comparison by End Use, 2025-2035
  • Figure 88: Middle East & Africa Market Attractiveness Analysis by End Use
  • Figure 89: Middle East & Africa Market Value Share and BPS Analysis by Form, 2025 and 2035
  • Figure 90: Middle East & Africa Market Y to o to Y Growth Comparison by Form, 2025-2035
  • Figure 91: Middle East & Africa Market Attractiveness Analysis by Form
  • Figure 92: Global Market - Tier Structure Analysis
  • Figure 93: Global Market - Company Share Analysis
Dashboard
Dashboard
Dashboard
Dashboard
Dashboard
Dashboard

Full Research Suite comprises of:

Market outlook & trends analysis

Market outlook & trends analysis

Interviews & case studies

Interviews & case studies

Strategic recommendations

Strategic recommendations

Vendor profiles & capabilities analysis

Vendor profiles & capabilities analysis

5-year forecasts

5-year forecasts

8 regions and 60+ country-level data splits

8 regions and 60+ country-level data splits

Market segment data splits

Market segment data splits

12 months of continuous data updates

12 months of continuous data updates

DELIVERED AS:

PDF EXCEL ONLINE

Full Research Suite


$5000

$7500

$10000

Buy Report Now
Future Market Insights

Thiamine Market

Chat With MaRIA

Chat With

MaRIA

Hi There, I am MaRIA, Your Market Research Intelligence Assistant. How may I help you?