Fructosamine Test Market Outlook from 2024 to 2034

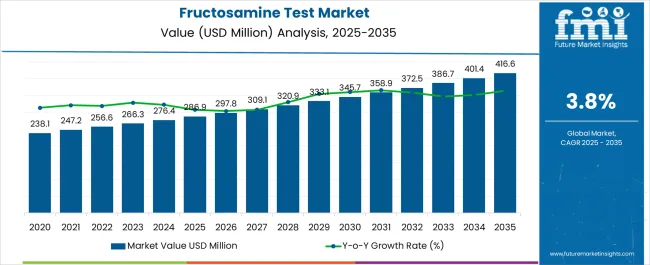
The global fructosamine test market size is expected to grow from USD 275.9 million in 2024 to USD 399.9 million by 2034. Over the forecast period, global demand for fructosamine tests is predicted to increase at a CAGR of 3.8%.

In 2023, the global market for fructosamine tests accounted for about 1.0% of the overall global glucose monitoring market, valued at USD 26,752.5 million. However, this share is expected to improve amid rising cases of diabetes and the growing popularity of fructosamine testing.

Key Factors Boosting the Fructosamine Test Market Growth Include-

  • Rising prevalence of diabetes and obesity globally
  • Surging popularity of fructosamine testing due to its shorter turnaround and non-invasive nature
  • Growing emphasis on regular glucose monitoring and proactive control
  • Improved access to glucose diagnostic tools like fructosamine tests, especially in developing regions
  • Increasing awareness about the importance of regular monitoring and early detection of diabetes
  • High spending on diabetes blood tests
  • Introduction of new screening programs
  • Ease of booking fructosamine test services through online platforms

Fructosamine Test Market Overview

Attributes Key Insights
Base Market Value (2023) USD 266.3 million
Estimated Market Size (2024) USD 275.9 million
Projected Fructosamine Test Market Value (2034) USD 399.9 million
Value CAGR (2024 to 2034) 3.8%

Fructosamine Test Market Trends

  • Rising interest in preventive healthcare
  • Growing popularity of point-of-care fructosamine testing
  • Introduction of novel fructosamine testing devices
  • High adoption of fructosamine testing in diabetes management protocols
  • Growing adoption of clinical laboratory testing for diabetes

Due to its effectiveness in monitoring immediate glucose control in diabetes, the demand for fructosamine testing is growing. It is widely used for diagnosing prediabetes and monitoring diabetes as it does not require fasting and reflects average blood sugar over a more extended period.

As an alternative to typical HbA1c testing, fructosamine provides an overview of blood glucose levels over 2-3 weeks. This is important for people who suffer from changing glucose levels or are undergoing quick treatment changes.

Fructosamine testing can be helpful during pregnancy and in conditions that impact hemoglobin. This makes it an effective instrument for accurate diabetes treatment.

There has been a spike in cases of diabetes during the last few years, and the trend is expected to further escalate in the upcoming years. According to the International Diabetes Federation, around 783 million adults will be living with diabetes in 2045. This will uplift the demand for glucose monitoring tests like fructosamine tests.

Analysis of Historical and Future Outlook for Fructosamine Test Market

The global market for fructosamine tests experienced a CAGR of 3.3% between 2019 and 2023. Total market valuation at the end of 2023 reached USD 266.3 million. In the forecast period, the worldwide fructosamine test industry is set to expand at a CAGR of 3.8%.

Historical CAGR (2019 to 2023) 3.3%
Forecast CAGR (2024 to 2034) 3.8%

Multiple factors are expected to fuel the growth of the fructosamine test market during the assessment period. These include the rising incidence of diabetes and the growing need for quick diagnostic testing.

Diabetes, a condition marked by high blood glucose levels, carries a high risk of consequences, including renal problems, nerve damage, and heart disease. Its prevalence has sharply increased during the last few decades. For instance,

  • According to the WHO, in 2014, 8.5% of adults aged 18 and above had diabetes. By 2019, diabetes emerged as the primary cause of 1.5 million fatalities, with 48% occurring before reaching 70 years. Diabetes-associated kidney disease claimed an additional 460,000 lives, and elevated blood glucose contributed to approximately 20% of cardiovascular deaths.
  • From 2000 to 2019, age-standardized mortality rates from diabetes witnessed a 3% uptick. Notably, lower-middle-income countries experienced a 13% surge in diabetes-related mortality.

Fructosamine tests are essential in addressing the growing demand for efficient monitoring tools to treat diabetes. As the number of persons with this chronic condition keeps increasing globally, so will the demand for fructosamine tests.

Fructosamine tests are valuable tools for diabetes treatment and monitoring because they provide a dynamic, immediate evaluation of glycemic control.

Since diabetes is an ongoing condition that requires constant monitoring, being able to recognize small variations in blood glucose levels is essential for rapid treatments and modifications to treatment plans.

The hemoglobin A1c test, considered the gold standard, gives a more extended average of blood glucose levels over many months. Fructosamine tests, on the other hand, provide a more rapid evaluation of glycemic control by reflecting changes over a shorter period of time, usually two to three weeks.

Overview of Key Opportunities Impacting Fructosamine Test Market’s Progress

The increasing awareness of the importance of routine diabetes check-ups is a primary factor driving the need for diagnostic instruments, including fructosamine testing. People and healthcare professionals are becoming more aware of the need for a proactive approach to curing diabetes as information is shared successfully.

Since fructosamine tests provide a more immediate measure of glycemic control, they are ideally suited to support the focus on early identification and treatment. Given the understanding that blood glucose levels are dynamic, patients look for convenient and effective monitoring devices.

Healthcare practitioners are also aware of the importance of fructosamine testing in providing real-time information that allows immediate changes to treatment plans. Hence, they often recommend these tests for patients with diabetic symptoms.

Increasing awareness about regular diabetes monitoring is expected to create lucrative opportunities for the fructosamine test market. Subsequently, supportive healthcare policies and government initiatives will benefit the market.

Overview of Restrictive Factors for Fructosamine Test Market

Regulatory agencies, including the Food and Drug Administration (FDA), have set strict guidelines ensuring diagnostic tests' security, effectiveness, and reliability. Because fructosamine testing involves evaluating short-term glycemic management, it is a difficult procedure requiring stringent validation.

Complying with regulatory requirements requires carrying out thorough clinical trials, demonstrating the precision and accuracy of test results, and ensuring quality assurance standards are met.

The requirement for strong clinical evidence to demonstrate the clinical utility of fructosamine tests, especially when compared to current standards such as HbA1c testing, complicated the approval process.

The approval timeline may also be affected by modifications to regulations or the addition of additional requirements due to the changing nature of the regulatory environment. Manufacturers and developers have to spend time and money on thorough documentation and compliance methods to get through this complex regulatory system.

Although these regulations protect public health, they also make it more difficult for businesses to develop novel fructosamine tests.

They may also cause a delay in the release of these essential diagnostic instruments. Hence, such stringent regulatory processes and compliance requirements could be a barrier to the growth of the fructosamine test market.
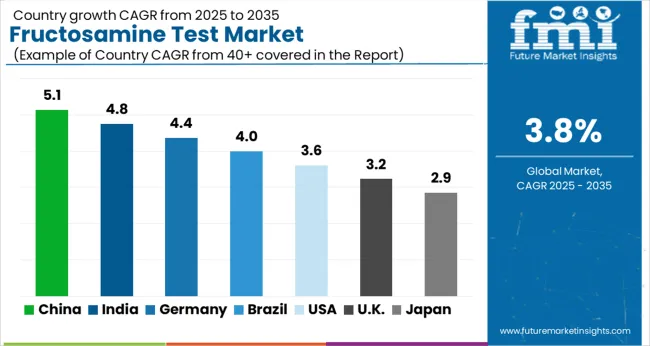
Country-wise Insights

The table below gives an insight into how top nations are going to respond to the growing demand for fructosamine testing. China and India are expected to thrive rapidly due to the increasing number of diabetes patients and growing health awareness.

Market Growth Outlook by Key Countries

Countries Value CAGR
United States 1.1%
China 7.5%
Germany 1.5%
United Kingdom 1.9%
India 7.9%

High Adoption of Fructosamine Testing Boosting the United States Market

The United States remains the most dominant market for fructosamine test products, holding a global market share of around 28.0% in 2023. Over the forecast period, the United States fructosamine test market is expected to register a CAGR of 1.1%. This is due to the growing adoption of fructosamine testing over traditional monitoring techniques.

Several reasons are contributing to the greater adoption of fructosamine testing in the United States. For instance, its ability to provide a more accurate overview of glycemic control than traditional approaches such as HbA1c meets the growing demand for more frequent and precise monitoring in diabetes therapy.

Secondly, the adaptability of fructosamine testing is useful in cases of quick medication changes as well as for people with fluctuating glucose levels. Thus, the growing popularity of fructosamine testing will continue to play a key role in boosting the growth of the fructosamine test industry in the United States.

The rising incidence of diabetes is another key factor expected to boost sales of fructosamine testing solutions. Similarly, innovation in fructosamine assay tests and the growing need for diabetic patient monitoring will improve the United States fructosamine test industry share.

Rising Geriatric Population Propelling Demand in China

In 2023, China's fructosamine test market size reached USD 16.7 million. Over the assessment period, demand for fructosamine tests in China is projected to grow with a robust CAGR of 7.5%. This is attributable to the rising incidence of diabetes among the exploding geriatric population.

Diabetes prevalence risks are increasing due to China's aging population. This shift in the population is expected to create a need for advanced glucose monitoring methods, particularly fructosamine testing.

Diabetes is becoming more common as the aged population grows; thus, accurate and regular monitoring is required. The combination of an increasing elderly population and the diabetes pandemic drives the uptake of novel diagnostic techniques, signaling a necessary reaction to the changing healthcare environment in China.

Category-wise Insights

The below section highlights the estimated market shares of key segments, including disease indication, sample, application, and end-user. This information can be vital for companies to frame their strategies accordingly.

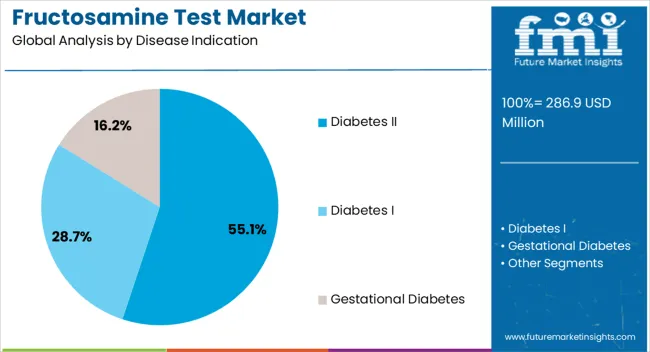
  • Thriving at a 2.4% CAGR, the diabetes II category is expected to dominate the global fructosamine test industry through 2034.
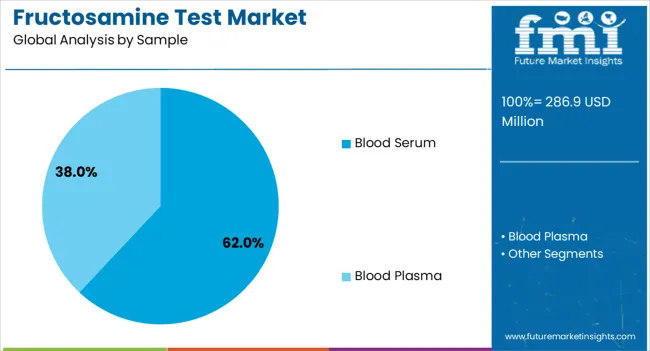
  • The blood serum segment leads the market with a value share of around 81.4% in 2023.
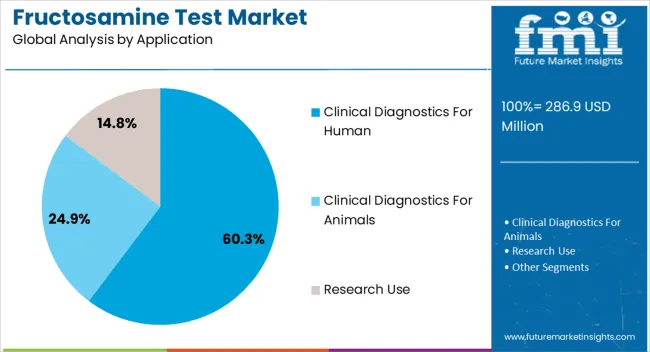
  • Currently, the clinical diagnostics for the human segment holds a dominant market share of 56.4%.
  • Hospitals remain the leading end-user segment, accounting for a value share of 29.8% in 2023.

Diabetes II to Create Lucrative Growth Prospects for the Market

Market Growth Outlook by Disease Indication

Disease Indication Value CAGR
Diabetes I 4.9%
Diabetes II 2.4%
Gestational Diabetes 7.5%

The diabetes II segment accounted for a dominant market share of 59.4% in 2023. Over the forecast period, it is poised to advance at 2.4% CAGR. This is due to the rising prevalence of diabetes II globally, creating frequent monitoring needs.

According to the World Health Organization (WHO), more than 95% of people with diabetes have type 2 diabetes. The fructosamine test's effectiveness in assessing short-term glycemic control aligns with the chronic nature of Type II diabetes management. As a result, its demand is expected to rise with increasing cases of diabetes II.

Blood Serum Remains Preferred Sample for Fructosamine Testing

Market Growth Outlook by Key Sample

Sample Value CAGR
Blood Serum 3.5%
Blood Plasma 5.9%

The blood serum segment leads the fructosamine test market with a market value share of 81.4% in 2023. For the projection period, a CAGR of 3.5% has been predicted for the target segment. This can be attributed to the rising usage of blood samples in fructosamine testing.

Since serum doesn't include anticoagulants, it interacts with enzymatic assays less and produces consistent and accurate results. On the other hand, anticoagulants found in plasma may have an impact on the enzymatic processes used in fructosamine assays.

Serum also improves the accuracy of test results by providing a clearer background for colorimetric measurements.

In fructosamine testing, serum is highly preferred over plasma with the aim of collecting the most accurate and pure sample possible, which is essential for managing diabetes and monitoring short-term glycemic control.

Clinical Diagnostics for Humans Remains Key Application Area

Market Growth Outlook by Key Application

Application Value CAGR
Clinical Diagnostics for Human 2.8%
Clinical Diagnostics for Animals 5.9%
Research Use 4.8%

As per the latest analysis, clinical diagnostics for humans will remain a key application of fructosamine tests during the assessment period. In 2023, the target segment accounted for a market share of 56.4% in 2023, and it is expected to progress at 2.8% CAGR through 2034.

The main reason fructosamine testing is employed so often in human clinical diagnostics is because of its special significance in diabetes control. It provides a more immediate view of glycemic control, which is essential for modifying treatment when conditions shift swiftly.

Diabetes is a dynamic disease that requires regular monitoring, which is consistent with fructosamine’s capacity to reflect glucose levels over a period of two to three weeks. This accuracy is instrumental in clinical settings because it helps medical practitioners provide customized patient treatment.

Most of the Fructosamine Tests are Performed in Hospitals

Market Growth Outlook by Key End User

End-user Value CAGR
Hospitals 2.8%
Ambulatory Surgical Centers 3.9%
Long-Term Care Facilities 6.2%
Specialty Clinics 5.2%
Others 7.6%

The hospital segment acts as a leading end user of the fructosamine tests with a 29.8% value share in 2023. Compared to other end users, hospitals are having a higher need for fructosamine testing kits due to their large patient numbers.

Due to the high patient volume, especially for individuals with diabetes, accurate and regular monitoring of short-term glycemic control is necessary. Fructosamine testing meets the volume and urgency of hospital settings by providing quick insights into glucose levels over a few weeks.
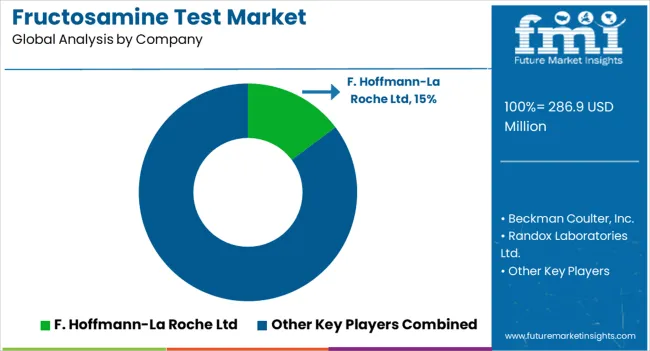
Competitive Landscape

In order to strengthen their positions, key companies are strategically making acquisitions and working on partnership agreements. Through acquisitions, businesses can grow their skills, penetrate new markets, and diversify their portfolios.

The dynamic market for fructosamine tests is promoting growth and sustainability through the ability of key players to meet consumer expectations, adjust to evolving industry trends, and maintain a competitive edge through strategic actions. Expanding into emerging regions and untapped markets can enhance a company's growth in terms of revenue.

Recent Developments in the Fructosamine Test Market

  • In October 2023, Abbexa appointed NuLife Consultants & Distributors (Pvt.) Ltd. as a distributor in India for its life science products, including proteins, antibodies, and ELISA kits.
  • In October 2022, Beckman Coulter completed its acquisition of StoCastic, LLC, a leading artificial intelligence (AI) company. StoCastic, LLC provides evidence-based decision support for hospital emergency departments (ED).

 Scope of the Report

Attribute Details
Estimated Market Value (2024) USD 275.9 million
Projected Market Size (2034) USD 399.9 million
Expected Growth Rate (2024 to 2034) 3.8% CAGR
Forecast Period 2024 to 2034
Historical Data Available for 2019 to 2023
Market Analysis USD million for Value
Key Regions Covered North America; Latin America; South Asia & Pacific; East Asia; Western Europe; Eastern Europe; Middle East & Africa
Key Countries Covered United States, Canada, Mexico, Brazil, Chile, Rest of Latin America, China, Japan, South Korea, India, Association of Southeast Asian Nations, Australia & New Zealand, Rest of South Asia and Pacific, Germany, Italy, France, United Kingdom, Spain, BENELUX, Nordic Countries, Rest of Western Europe, Russia, Hungary, Poland, Rest of Eastern Europe, Saudi Arabia, Türkiye, South Africa, Other African Union, Rest of Middle East & Africa
Key Segments Covered Disease Indication, Sample, Application, End-user, and Region
Key Companies Profiled Beckman Coulter, Inc.; Randox Laboratories Ltd.; Fortress Diagnostics; KAMIYA BIOMEDICAL COMPANY; Abbexa; Weldon Biotech, Inc.; Eurolyser Diagnostica GmbH; F. Hoffmann-La Roche Ltd; Asahi Kasei Pharma Corporation (EKF DIAGNOSTICS); LifeSpan BioSciences, Inc; Zhejiang Kangte Biotechnology Co., Ltd.; Diazyme; Abcam plc.; Weldon Biotech, Inc.; Bio Vision; Mybiosource
Report Coverage Market Forecast, Competition Intelligence, Market Dynamics and Challenges, Strategic Growth Initiatives

Fructosamine Test Market Outlook by Category

By Disease Indication:

  • Diabetes I
  • Diabetes II
  • Gestational Diabetes

By Sample:

  • Blood Serum
  • Blood Plasma

By Application:

  • Clinical Diagnostics for Human
  • Clinical Diagnostics for Animals
  • Research Use

By End-user:

  • Hospitals
  • Specialty Clinics
  • Veterinary Hospitals
  • Diagnostic Laboratories
  • Academic & Research Institutes

By Region:

  • North America
  • Latin America
  • East Asia
  • South Asia & Pacific
  • Western Europe
  • Eastern Europe
  • Middle East & Africa

Table of Content

  • 1. Executive Summary
  • 2. Market Overview
  • 3. Key Market Trends
  • 4. Value Added Insights
  • 5. Market Background
  • 6. Global Market Demand (in Volume) Analysis 2019 to 2023 and Forecast, 2024 to 2034
  • 7. Global Market - Pricing Analysis
  • 8. Global Demand (in Value or Size in USD million) Analysis 2019 to 2023 and Forecast, 2024 to 2034
  • 9. Global Market Analysis 2019 to 2023 and Forecast 2024 to 2034, By Disease Indication
    • 9.1. Diabetes I
    • 9.2. Diabetes II
    • 9.3. Gestational Diabetes
  • 10. Global Market Analysis 2019 to 2023 and Forecast 2024 to 2034, By Sample
    • 10.1. Blood Serum
    • 10.2. Blood Plasma
  • 11. Global Market Analysis 2019 to 2023 and Forecast 2024 to 2034, By Application
    • 11.1. Clinical Diagnostics for Human
    • 11.2. Clinical Diagnostics for Animals
    • 11.3. Research Use
  • 12. Global Market Analysis 2019 to 2023 and Forecast 2024 to 2034, By End-user
    • 12.1. Hospitals
    • 12.2. Specialty Clinics
    • 12.3. Veterinary Hospitals
    • 12.4. Diagnostic Laboratories
    • 12.5. Academic & Research Institutes
  • 13. Global Market Analysis 2019 to 2023 and Forecast 2024 to 2034, By Region
    • 13.1. North America
    • 13.2. Latin America
    • 13.3. East Asia
    • 13.4. South Asia & Pacific
    • 13.5. Western Europe
    • 13.6. Eastern Europe
    • 13.7. Middle East & Africa
  • 14. North America Market Analysis 2019 to 2023 and Forecast 2024 to 2034
  • 15. Latin America Market Analysis 2019 to 2023 and Forecast 2024 to 2034
  • 16. East Asia Market Analysis 2019 to 2023 and Forecast 2024 to 2034
  • 17. South Asia & Pacific Market Analysis 2019 to 2023 and Forecast 2024 to 2034
  • 18. Western Europe Market 2019 to 2023 and Forecast 2024 to 2034
  • 19. Eastern Europe Market Analysis 2019 to 2023 and Forecast 2024 to 2034
  • 20. Middle East & Africa Market Analysis 2019 to 2023 and Forecast 2024 to 2034
  • 21. Market Structure Analysis
  • 22. Competition Analysis
    • 22.1. Randox Laboratories Ltd.
    • 22.2. Beckman Coulter, Inc.
    • 22.3. Fortress Diagnostics
    • 22.4. KAMIYA BIOMEDICAL COMPANY
    • 22.5. Abbexa
    • 22.6. Weldon Biotech, Inc.
    • 22.7. Eurolyser Diagnostica GmbH
    • 22.8. F. Hoffmann-La Roche Ltd
    • 22.9. Asahi Kasei Pharma Corporation (EKF DIAGNOSTICS)
    • 22.10. LifeSpan BioSciences, Inc
    • 22.11. Zhejiang Kangte Biotechnology Co., Ltd.
    • 22.12. Diazyme
    • 22.13. Abcam plc.
    • 22.14. Weldon Biotech, Inc.
    • 22.15. Bio Vision
    • 22.16. Mybiosource
  • 23. Assumptions and Acronyms Used
  • 24. Research Methodology

List of Tables

Table 1: Global Market Value (US$ million) Analysis 2019 to 2023 and Forecast 2024 to 2034, By Disease Indication

Table 2: Global Respiratory Inhaler Devices Volume (Units) Analysis 2019 to 2023 and Forecast 2024 to 2034, By Disease Indication

Table 3: Global Market Value (US$ million) Analysis 2019 to 2023 and Forecast 2024 to 2034, By Sample

Table 4: Global Market Value (US$ million) Analysis 2019 to 2023 and Forecast 2024 to 2034, By Sample

Table 5: Global Market Value (US$ million) Analysis 2019 to 2023 and Forecast 2024 to 2034, By End-user

Table 6: Global Market Size (US$ million) Analysis 2019 to 2023 and Forecast 2024 to 2034, By Region

Table 7: North America Market Value (US$ million) Analysis 2019 to 2023 and Forecast 2024 to 2034, By Country

Table 8: North America Market Value (US$ million) Analysis 2019 to 2023 and Forecast 2024 to 2034, By Disease Indication

Table 9: North America Respiratory Inhaler Devices Volume (Units) Analysis 2019 to 2023 and Forecast 2024 to 2034, By Disease Indication

Table 10: North America Market Value (US$ million) Analysis 2019 to 2023 and Forecast 2024 to 2034, By Sample

Table 11: North America Market Value (US$ million) Analysis 2019 to 2023 and Forecast 2024 to 2034, By Sample

Table 12: North America Market Value (US$ million) Analysis 2019 to 2023 and Forecast 2024 to 2034, By End-user

Table 13: United States Market Value (US$ million) Analysis 2019 to 2023 and Forecast 2024 to 2034, By Disease Indication

Table 14: United States Market Value (US$ million) Analysis 2019 to 2023 and Forecast 2024 to 2034, By Sample

Table 15: United States Market Value (US$ million) Analysis 2019 to 2023 and Forecast 2024 to 2034, By Sample

Table 16: United States Market Value (US$ million) Analysis 2019 to 2023 and Forecast 2024 to 2034, By End-user

Table 17: Canada Market Value (US$ million) Analysis 2019 to 2023 and Forecast 2024 to 2034, By Disease Indication

Table 18: Canada Market Value (US$ million) Analysis 2019 to 2023 and Forecast 2024 to 2034, By Sample

Table 19: Canada Market Value (US$ million) Analysis 2019 to 2023 and Forecast 2024 to 2034, By Sample

Table 20: Canada Market Value (US$ million) Analysis 2019 to 2023 and Forecast 2024 to 2034, By End-user

Table 21: Mexico Market Value (US$ million) Analysis 2019 to 2023 and Forecast 2024 to 2034, By Disease Indication

Table 22: Mexico Market Value (US$ million) Analysis 2019 to 2023 and Forecast 2024 to 2034, By Sample

Table 23: Mexico Market Value (US$ million) Analysis 2019 to 2023 and Forecast 2024 to 2034, By Sample

Table 24: Mexico Market Value (US$ million) Analysis 2019 to 2023 and Forecast 2024 to 2034, By End-user

Table 25: Latin America Market Value (US$ million) Analysis 2019 to 2023 and Forecast 2024 to 2034, By Country

Table 26: Latin America Market Value (US$ million) Analysis 2019 to 2023 and Forecast 2024 to 2034, By Disease Indication

Table 27: Latin America Respiratory Inhaler Devices Volume (Units) Analysis 2019 to 2023 and Forecast 2024 to 2034, By Disease Indication

Table 28: Latin America Market Value (US$ million) Analysis 2019 to 2023 and Forecast 2024 to 2034, By Sample

Table 29: Latin America Market Value (US$ million) Analysis 2019 to 2023 and Forecast 2024 to 2034, By Sample

Table 30: Latin America Market Value (US$ million) Analysis 2019 to 2023 and Forecast 2024 to 2034, By End-user

Table 31: Brazil Market Value (US$ million) Analysis 2019 to 2023 and Forecast 2024 to 2034, By Disease Indication

Table 32: Brazil Market Value (US$ million) Analysis 2019 to 2023 and Forecast 2024 to 2034, By Sample

Table 33: Brazil Market Value (US$ million) Analysis 2019 to 2023 and Forecast 2024 to 2034, By Sample

Table 34: Brazil Market Value (US$ million) Analysis 2019 to 2023 and Forecast 2024 to 2034, By End-user

Table 35: Chile Market Value (US$ million) Analysis 2019 to 2023 and Forecast 2024 to 2034, By Disease Indication

Table 36: Chile Market Value (US$ million) Analysis 2019 to 2023 and Forecast 2024 to 2034, By Sample

Table 37: Chile Market Value (US$ million) Analysis 2019 to 2023 and Forecast 2024 to 2034, By Sample

Table 38: Chile Market Value (US$ million) Analysis 2019 to 2023 and Forecast 2024 to 2034, By End-user

Table 39: East Asia Market Value (US$ million) Analysis 2019 to 2023 and Forecast 2024 to 2034, By Country

Table 40: East Asia Market Value (US$ million) Analysis 2019 to 2023 and Forecast 2024 to 2034, By Disease Indication

Table 41: East Asia Respiratory Inhaler Devices Volume (Units) Analysis 2019 to 2023 and Forecast 2024 to 2034, By Disease Indication

Table 42: East Asia Market Value (US$ million) Analysis 2019 to 2023 and Forecast 2024 to 2034, By Sample

Table 43: East Asia Market Value (US$ million) Analysis 2019 to 2023 and Forecast 2024 to 2034, By Sample

Table 44: East Asia Market Value (US$ million) Analysis 2019 to 2023 and Forecast 2024 to 2034, By End-user

Table 45: China Market Value (US$ million) Analysis 2019 to 2023 and Forecast 2024 to 2034, By Disease Indication

Table 46: China Market Value (US$ million) Analysis 2019 to 2023 and Forecast 2024 to 2034, By Sample

Table 47: China Market Value (US$ million) Analysis 2019 to 2023 and Forecast 2024 to 2034, By Sample

Table 48: China Market Value (US$ million) Analysis 2019 to 2023 and Forecast 2024 to 2034, By End-user

Table 49: Japan Market Value (US$ million) Analysis 2019 to 2023 and Forecast 2024 to 2034, By Disease Indication

Table 50: Japan Market Value (US$ million) Analysis 2019 to 2023 and Forecast 2024 to 2034, By Sample

Table 51: Japan Market Value (US$ million) Analysis 2019 to 2023 and Forecast 2024 to 2034, By Sample

Table 52: Japan Market Value (US$ million) Analysis 2019 to 2023 and Forecast 2024 to 2034, By End-user

Table 53: South Korea Market Value (US$ million) Analysis 2019 to 2023 and Forecast 2024 to 2034, By Disease Indication

Table 54: South Korea Market Value (US$ million) Analysis 2019 to 2023 and Forecast 2024 to 2034, By Sample

Table 55: South Korea Market Value (US$ million) Analysis 2019 to 2023 and Forecast 2024 to 2034, By Sample

Table 56: South Korea Market Value (US$ million) Analysis 2019 to 2023 and Forecast 2024 to 2034, By End-user

Table 57: South Asia & Pacific Market Value (US$ million) Analysis 2019 to 2023 and Forecast 2024 to 2034, By Country

Table 58: South Asia & Pacific Market Value (US$ million) Analysis 2019 to 2023 and Forecast 2024 to 2034, By Disease Indication

Table 59: South Asia & Pacific Respiratory Inhaler Devices Volume (Units) Analysis 2019 to 2023 and Forecast 2024 to 2034, By Disease Indication

Table 60: South Asia & Pacific Market Value (US$ million) Analysis 2019 to 2023 and Forecast 2024 to 2034, By Sample

Table 61: South Asia & Pacific Market Value (US$ million) Analysis 2019 to 2023 and Forecast 2024 to 2034, By Sample

Table 62: South Asia & Pacific Market Value (US$ million) Analysis 2019 to 2023 and Forecast 2024 to 2034, By End-user

Table 63: India Market Value (US$ million) Analysis 2019 to 2023 and Forecast 2024 to 2034, By Disease Indication

Table 64: India Market Value (US$ million) Analysis 2019 to 2023 and Forecast 2024 to 2034, By Sample

Table 65: India Market Value (US$ million) Analysis 2019 to 2023 and Forecast 2024 to 2034, By Sample

Table 66: India Market Value (US$ million) Analysis 2019 to 2023 and Forecast 2024 to 2034, By End-user

Table 67: ASEAN Countries Market Value (US$ million) Analysis 2019 to 2023 and Forecast 2024 to 2034, By Disease Indication

Table 68: ASEAN Countries Market Value (US$ million) Analysis 2019 to 2023 and Forecast 2024 to 2034, By Sample

Table 69: ASEAN Countries Market Value (US$ million) Analysis 2019 to 2023 and Forecast 2024 to 2034, By Sample

Table 70: ASEAN Countries Market Value (US$ million) Analysis 2019 to 2023 and Forecast 2024 to 2034, By End-user

Table 71: Australia & New Zealand Market Value (US$ million) Analysis 2019 to 2023 and Forecast 2024 to 2034, By Disease Indication

Table 72: Australia & New Zealand Market Value (US$ million) Analysis 2019 to 2023 and Forecast 2024 to 2034, By Sample

Table 73: Australia & New Zealand Market Value (US$ million) Analysis 2019 to 2023 and Forecast 2024 to 2034, By Sample

Table 74: Australia & New Zealand Market Value (US$ million) Analysis 2019 to 2023 and Forecast 2024 to 2034, By End-user

Table 75: Western Europe Market Value (US$ million) Analysis 2019 to 2023 and Forecast 2024 to 2034, By Country

Table 76: Western Europe Market Value (US$ million) Analysis 2019 to 2023 and Forecast 2024 to 2034, By Disease Indication

Table 77: Western Europe Respiratory Inhaler Devices Volume (Units) Analysis 2019 to 2023 and Forecast 2024 to 2034, By Disease Indication

Table 78: Western Europe Market Value (US$ million) Analysis 2019 to 2023 and Forecast 2024 to 2034, By Sample

Table 79: Western Europe Market Value (US$ million) Analysis 2019 to 2023 and Forecast 2024 to 2034, By Sample

Table 80: Western Europe Market Value (US$ million) Analysis 2019 to 2023 and Forecast 2024 to 2034, By End-user

Table 81: Germany Market Value (US$ million) Analysis 2019 to 2023 and Forecast 2024 to 2034, By Disease Indication

Table 82: Germany Market Value (US$ million) Analysis 2019 to 2023 and Forecast 2024 to 2034, By Sample

Table 83: Germany Market Value (US$ million) Analysis 2019 to 2023 and Forecast 2024 to 2034, By Sample

Table 84: Germany Market Value (US$ million) Analysis 2019 to 2023 and Forecast 2024 to 2034, By End-user

Table 85: Italy Market Value (US$ million) Analysis 2019 to 2023 and Forecast 2024 to 2034, By Disease Indication

Table 86: Italy Market Value (US$ million) Analysis 2019 to 2023 and Forecast 2024 to 2034, By Sample

Table 87: Italy Market Value (US$ million) Analysis 2019 to 2023 and Forecast 2024 to 2034, By Sample

Table 88: Italy Market Value (US$ million) Analysis 2019 to 2023 and Forecast 2024 to 2034, By End-user

Table 89: France Market Value (US$ million) Analysis 2019 to 2023 and Forecast 2024 to 2034, By Disease Indication

Table 90: France Market Value (US$ million) Analysis 2019 to 2023 and Forecast 2024 to 2034, By Sample

Table 91: France Market Value (US$ million) Analysis 2019 to 2023 and Forecast 2024 to 2034, By Sample

Table 92: France Market Value (US$ million) Analysis 2019 to 2023 and Forecast 2024 to 2034, By End-user

Table 93: United Kingdom Market Value (US$ million) Analysis 2019 to 2023 and Forecast 2024 to 2034, By Disease Indication

Table 94: United Kingdom Market Value (US$ million) Analysis 2019 to 2023 and Forecast 2024 to 2034, By Sample

Table 95: United Kingdom Market Value (US$ million) Analysis 2019 to 2023 and Forecast 2024 to 2034, By Sample

Table 96: United Kingdom Market Value (US$ million) Analysis 2019 to 2023 and Forecast 2024 to 2034, By End-user

Table 97: Spain Market Value (US$ million) Analysis 2019 to 2023 and Forecast 2024 to 2034, By Disease Indication

Table 98: Spain Market Value (US$ million) Analysis 2019 to 2023 and Forecast 2024 to 2034, By Sample

Table 99: Spain Market Value (US$ million) Analysis 2019 to 2023 and Forecast 2024 to 2034, By Sample

Table 100: Spain Market Value (US$ million) Analysis 2019 to 2023 and Forecast 2024 to 2034, By End-user

Table 101: BENELUX Market Value (US$ million) Analysis 2019 to 2023 and Forecast 2024 to 2034, By Disease Indication

Table 102: BENELUX Market Value (US$ million) Analysis 2019 to 2023 and Forecast 2024 to 2034, By Sample

Table 103: BENELUX Market Value (US$ million) Analysis 2019 to 2023 and Forecast 2024 to 2034, By Sample

Table 104: BENELUX Market Value (US$ million) Analysis 2019 to 2023 and Forecast 2024 to 2034, By End-user

Table 105: Nordic Countries Market Value (US$ million) Analysis 2019 to 2023 and Forecast 2024 to 2034, By Disease Indication

Table 106: Nordic Countries Market Value (US$ million) Analysis 2019 to 2023 and Forecast 2024 to 2034, By Sample

Table 107: Nordic Countries Market Value (US$ million) Analysis 2019 to 2023 and Forecast 2024 to 2034, By Sample

Table 108: Nordic Countries Market Value (US$ million) Analysis 2019 to 2023 and Forecast 2024 to 2034, By End-user

Table 109: Eastern Europe Market Value (US$ million) Analysis 2019 to 2023 and Forecast 2024 to 2034, By Country

Table 110: Eastern Europe Market Value (US$ million) Analysis 2019 to 2023 and Forecast 2024 to 2034, By Disease Indication

Table 111: Eastern Europe Respiratory Inhaler Devices Volume (Units) Analysis 2019 to 2023 and Forecast 2024 to 2034, By Disease Indication

Table 112: Eastern Europe Market Value (US$ million) Analysis 2019 to 2023 and Forecast 2024 to 2034, By Sample

Table 113: Eastern Europe Market Value (US$ million) Analysis 2019 to 2023 and Forecast 2024 to 2034, By Sample

Table 114: Eastern Europe Market Value (US$ million) Analysis 2019 to 2023 and Forecast 2024 to 2034, By End-user

Table 115: Russia Market Value (US$ million) Analysis 2019 to 2023 and Forecast 2024 to 2034, By Disease Indication

Table 116: Russia Market Value (US$ million) Analysis 2019 to 2023 and Forecast 2024 to 2034, By Sample

Table 117: Russia Market Value (US$ million) Analysis 2019 to 2023 and Forecast 2024 to 2034, By Sample

Table 118: Russia Market Value (US$ million) Analysis 2019 to 2023 and Forecast 2024 to 2034, By End-user

Table 119: Hungary Market Value (US$ million) Analysis 2019 to 2023 and Forecast 2024 to 2034, By Disease Indication

Table 120: Hungary Market Value (US$ million) Analysis 2019 to 2023 and Forecast 2024 to 2034, By Sample

Table 121: Hungary Market Value (US$ million) Analysis 2019 to 2023 and Forecast 2024 to 2034, By Sample

Table 122: Hungary Market Value (US$ million) Analysis 2019 to 2023 and Forecast 2024 to 2034, By End-user

Table 123: Poland Market Value (US$ million) Analysis 2019 to 2023 and Forecast 2024 to 2034, By Disease Indication

Table 124: Poland Market Value (US$ million) Analysis 2019 to 2023 and Forecast 2024 to 2034, By Sample

Table 125: Poland Market Value (US$ million) Analysis 2019 to 2023 and Forecast 2024 to 2034, By Sample

Table 126: Poland Market Value (US$ million) Analysis 2019 to 2023 and Forecast 2024 to 2034, By End-user

Table 127: Middle East & Africa Market Value (US$ million) Analysis 2019 to 2023 and Forecast 2024 to 2034, By Country

Table 128: Middle East & Africa Market Value (US$ million) Analysis 2019 to 2023 and Forecast 2024 to 2034, By Disease Indication

Table 129: Middle East & Africa Respiratory Inhaler Devices Volume (Units) Analysis 2019 to 2023 and Forecast 2024 to 2034, By Disease Indication

Table 130: Middle East & Africa Market Value (US$ million) Analysis 2019 to 2023 and Forecast 2024 to 2034, By Sample

Table 131: Middle East & Africa Market Value (US$ million) Analysis 2019 to 2023 and Forecast 2024 to 2034, By Sample

Table 132: Middle East & Africa Market Value (US$ million) Analysis 2019 to 2023 and Forecast 2024 to 2034, By End-user

Table 133: Saudi Arabia Market Value (US$ million) Analysis 2019 to 2023 and Forecast 2024 to 2034, By Disease Indication

Table 134: Saudi Arabia Market Value (US$ million) Analysis 2019 to 2023 and Forecast 2024 to 2034, By Sample

Table 135: Saudi Arabia Market Value (US$ million) Analysis 2019 to 2023 and Forecast 2024 to 2034, By Sample

Table 136: Saudi Arabia Market Value (US$ million) Analysis 2019 to 2023 and Forecast 2024 to 2034, By End-user

Table 137: Türkiye Market Value (US$ million) Analysis 2019 to 2023 and Forecast 2024 to 2034, By Disease Indication

Table 138: Türkiye Market Value (US$ million) Analysis 2019 to 2023 and Forecast 2024 to 2034, By Sample

Table 139: Türkiye Market Value (US$ million) Analysis 2019 to 2023 and Forecast 2024 to 2034, By Sample

Table 140: Türkiye Market Value (US$ million) Analysis 2019 to 2023 and Forecast 2024 to 2034, By End-user

Table 141: South Africa Market Value (US$ million) Analysis 2019 to 2023 and Forecast 2024 to 2034, By Disease Indication

Table 142: South Africa Market Value (US$ million) Analysis 2019 to 2023 and Forecast 2024 to 2034, By Sample

Table 143: South Africa Market Value (US$ million) Analysis 2019 to 2023 and Forecast 2024 to 2034, By Sample

Table 144: South Africa Market Value (US$ million) Analysis 2019 to 2023 and Forecast 2024 to 2034, By End-user

Table 145: Other African Union Market Value (US$ million) Analysis 2019 to 2023 and Forecast 2024 to 2034, By Disease Indication

Table 146: Other African Union Market Value (US$ million) Analysis 2019 to 2023 and Forecast 2024 to 2034, By Sample

Table 147: Other African Union Market Value (US$ million) Analysis 2019 to 2023 and Forecast 2024 to 2034, By Sample

Table 148: Other African Union Market Value (US$ million) Analysis 2019 to 2023 and Forecast 2024 to 2034, By End-user

List of Figures

Figure 1: Global Market Value Share By Disease Indication 2023 (A)

Figure 2: Global Market Value Share By Sample 2023 (A)

Figure 3: Global Market Value Share By Application 2023 (A)

Figure 4: Global Market Value Share By End-user 2023 (A)

Figure 5: Global Market Value Share By Country 2023 (A)

Figure 6: Global Market Volume Analysis in (Units), 2019 to 2023

Figure 7: Global Market Volume Forecast in (Units), 2024 to 2034

Figure 8: Diabetes I Pricing Analysis (US$) for Per Unit, By Region, 2024

Figure 9: Diabetes II Pricing Analysis (US$) for Per Unit, By Region, 2024

Figure 10: Gestational Diabetes Pricing Analysis (US$) for Per Unit, By Region, 2024

Figure 11: Global Market Value Analysis (US$ million), 2019 to 2023

Figure 12: Global Market Value Forecast (US$ million), 2024 to 2034

Figure 13: Global Market Absolute $ Opportunity, 2024 to 2034

Figure 14: Global Market Share Analysis (%), By Disease Indication, 2024 (E) to 2034 (F)

Figure 15: Global Market Y-o-Y Analysis (%), By Disease Indication, 2024 to 2034

Figure 16: Global Market Attractiveness Analysis, By Disease Indication

Figure 17: Global Market Share Analysis (%), By Sample, 2024 (E) to 2034 (F)

Figure 18: Global Market Y-o-Y Analysis (%), By Sample, 2024 to 2034

Figure 19: Global Market Attractiveness Analysis, By Sample

Figure 20: Global Market Share Analysis (%), By Application, 2024 (E) to 2034 (F)

Figure 21: Global Market Y-o-Y Analysis (%), By Application, 2024 to 2034

Figure 22: Global Market Attractiveness Analysis, By Application

Figure 23: Global Market Share Analysis (%), By End-user, 2024 (E) to 2034 (F)

Figure 24: Global Market Y-o-Y Analysis (%), By End-user, 2024 to 2034

Figure 25: Global Market Attractiveness Analysis, By End-user

Figure 26: Global Market Share Analysis (%), By Region, 2024 (E) to 2034 (F)

Figure 27: Global Market Y-o-Y Analysis (%), By Region, 2024 to 2034

Figure 28: Global Market Attractiveness Analysis By Region, 2024 to 2034

Figure 29: North America Market Value Share By Disease Indication 2023 (A)

Figure 30: North America Market Value Share By Sample 2023 (A)

Figure 31: North America Market Value Share By Application 2023 (A)

Figure 32: North America Market Value Share By End-user 2023 (A)

Figure 33: North America Market Value Share By Country 2023 (A)

Figure 34: North America Market Value (US$ million) Analysis, 2019 to 2023

Figure 35: North America Market Forecast & Y-o-Y growth, 2024 to 2034

Figure 36: North America Market Attractiveness Analysis By Disease Indication, 2024 to 2034

Figure 37: North America Market Attractiveness Analysis By Sample, 2024 to 2034

Figure 38: North America Market Attractiveness Analysis By Application, 2024 to 2034

Figure 39: North America Market Attractiveness Analysis By End-user, 2024 to 2034

Figure 40: North America Market Attractiveness Analysis By Country, 2024 to 2034

Figure 41: Latin America Market Value Share By Disease Indication 2023 (A)

Figure 42: Latin America Market Value Share By Sample 2023 (A)

Figure 43: Latin America Market Value Share By Application 2023 (A)

Figure 44: Latin America Market Value Share By End-user 2023 (A)

Figure 45: Latin America Market Value Share By Country 2023 (A)

Figure 46: Latin America Market Value (US$ million) Analysis, 2019 to 2023

Figure 47: Latin America Market Forecast & Y-o-Y growth, 2024 to 2034

Figure 48: Latin America Market Attractiveness Analysis By Disease Indication, 2024 to 2034

Figure 49: Latin America Market Attractiveness Analysis By Sample, 2024 to 2034

Figure 50: Latin America Market Attractiveness Analysis By Application, 2024 to 2034

Figure 51: Latin America Market Attractiveness Analysis By End-user, 2024 to 2034

Figure 52: Latin America Market Attractiveness Analysis By Country, 2024 to 2034

Figure 53: East Asia Market Value Share By Disease Indication 2023 (A)

Figure 54: East Asia Market Value Share By Sample 2023 (A)

Figure 55: East Asia Market Value Share By Application 2023 (A)

Figure 56: East Asia Market Value Share By End-user 2023 (A)

Figure 57: East Asia Market Value Share By Country 2023 (A)

Figure 58: East Asia Market Value (US$ million) Analysis, 2019 to 2023

Figure 59: East Asia Market Forecast & Y-o-Y growth, 2024 to 2034

Figure 60: East Asia Market Attractiveness Analysis By Disease Indication, 2024 to 2034

Figure 61: East Asia Market Attractiveness Analysis By Sample, 2024 to 2034

Figure 62: East Asia Market Attractiveness Analysis By Application, 2024 to 2034

Figure 63: East Asia Market Attractiveness Analysis By End-user, 2024 to 2034

Figure 64: East Asia Market Attractiveness Analysis By Country, 2024 to 2034

Figure 65: South Asia & Pacific Market Value Share By Disease Indication 2023 (A)

Figure 66: South Asia & Pacific Market Value Share By Sample 2023 (A)

Figure 67: South Asia & Pacific Market Value Share By Application 2023 (A)

Figure 68: South Asia & Pacific Market Value Share By End-user 2023 (A)

Figure 69: South Asia & Pacific Market Value Share By Country 2023 (A)

Figure 70: South Asia & Pacific Market Value (US$ million) Analysis, 2019 to 2023

Figure 71: South Asia & Pacific Market Forecast & Y-o-Y growth, 2024 to 2034

Figure 72: South Asia & Pacific Market Attractiveness Analysis By Disease Indication, 2024 to 2034

Figure 73: South Asia & Pacific Market Attractiveness Analysis By Sample, 2024 to 2034

Figure 74: South Asia & Pacific Market Attractiveness Analysis By Application, 2024 to 2034

Figure 75: South Asia & Pacific Market Attractiveness Analysis By End-user, 2024 to 2034

Figure 76: South Asia & Pacific Market Attractiveness Analysis By Country, 2024 to 2034

Figure 77: Western Europe Market Value Share By Disease Indication 2023 (A)

Figure 78: Western Europe Market Value Share By Sample 2023 (A)

Figure 79: Western Europe Market Value Share By Application 2023 (A)

Figure 80: Western Europe Market Value Share By End-user 2023 (A)

Figure 81: Western Europe Market Value Share By Country 2023 (A)

Figure 82: Western Europe Market Value (US$ million) Analysis, 2019 to 2023

Figure 83: Western Europe Market Forecast & Y-o-Y growth, 2024 to 2034

Figure 84: Western Europe Market Attractiveness Analysis By Disease Indication, 2024 to 2034

Figure 85: Western Europe Market Attractiveness Analysis By Sample, 2024 to 2034

Figure 86: Western Europe Market Attractiveness Analysis By Application, 2024 to 2034

Figure 87: Western Europe Market Attractiveness Analysis By End-user, 2024 to 2034

Figure 88: Western Europe Market Attractiveness Analysis By Country, 2024 to 2034

Figure 89: Eastern Europe Market Value Share By Disease Indication 2023 (A)

Figure 90: Eastern Europe Market Value Share By Sample 2023 (A)

Figure 91: Eastern Europe Market Value Share By Application 2023 (A)

Figure 92: Eastern Europe Market Value Share By End-user 2023 (A)

Figure 93: Eastern Europe Market Value Share By Country 2023 (A)

Figure 94: Eastern Europe Market Value (US$ million) Analysis, 2019 to 2023

Figure 95: Eastern Europe Market Forecast & Y-o-Y growth, 2024 to 2034

Figure 96: Eastern Europe Market Attractiveness Analysis By Disease Indication, 2024 to 2034

Figure 97: Eastern Europe Market Attractiveness Analysis By Sample, 2024 to 2034

Figure 98: Eastern Europe Market Attractiveness Analysis By Application, 2024 to 2034

Figure 99: Eastern Europe Market Attractiveness Analysis By End-user, 2024 to 2034

Figure 100: Eastern Europe Market Attractiveness Analysis By Country, 2024 to 2034

Figure 101: Middle East & Africa Market Value Share By Disease Indication 2023 (A)

Figure 102: Middle East & Africa Market Value Share By Sample 2023 (A)

Figure 103: Middle East & Africa Market Value Share By Application 2023 (A)

Figure 104: Middle East & Africa Market Value Share By End-user 2023 (A)

Figure 105: Middle East & Africa Market Value Share By Country 2023 (A)

Figure 106: Middle East & Africa Market Value (US$ million) Analysis, 2019 to 2023

Figure 107: Middle East & Africa Market Forecast & Y-o-Y growth, 2024 to 2034

Figure 108: Middle East & Africa Market Attractiveness Analysis By Disease Indication, 2024 to 2034

Figure 109: Middle East & Africa Market Attractiveness Analysis By Sample, 2024 to 2034

Figure 110: Middle East & Africa Market Attractiveness Analysis By Application, 2024 to 2034

Figure 111: Middle East & Africa Market Attractiveness Analysis By End-user, 2024 to 2034

Figure 112: Middle East & Africa Market Attractiveness Analysis By Country, 2024 to 2034

Frequently Asked Questions

How big is the fructosamine test market?

The global fructosamine test market value totaled USD 266.3 million in 2023.

What is the estimated market value in 2034?

The market is estimated to attain a valuation of USD 275.9 million in 2024.

What is the projected market size in 2034?

The global fructosamine test market size is expected to reach USD 399.9 million by 2034.

At what rate will the demand for fructosamine tests rise through 2034?

Global demand for fructosamine tests is estimated to rise at 3.8% CAGR.

What was the last six year’s growth rate for the fructosamine test market?

The market grew at a CAGR of 3.3% between 2019 and 2023.

How big is the United States fructosamine test market?

The United States market reached USD 74.7 million in 2023.

How much was Germany’s market worth in 2023?

Germany held around 5.9% share in the global market in 2023.

What is the growth projection for India’s market?

India's fructosamine test market is anticipated to progress at 7.9% CAGR through 2034.

What is the demand outlook for China’s market?

Fructosamine test demand in China is poised to grow at 7.5% CAGR.

Which end-user segment dominates the market?

The hospitals segment held a prominent share of 29.8% in 2023.

What is the cost of fructosamine blood test?

The cost of fructosamine blood tests ranges from 400 to 1000 in India.

What is the lab value for fructosamine?

The reference range for fructosamine in non-diabetic people is about 200 to 285 umol/L is

Is fructosamine better than HbA1c?

No, it is not as good as the HbA1c test.

Explore Similar Insights

Future Market Insights

Fructosamine Test Market