The Hydroxylamine Sulfate Market is estimated to be valued at USD 520.0 million in 2025 and is projected to reach USD 833.4 million by 2035, registering a compound annual growth rate (CAGR) of 4.8% over the forecast period.
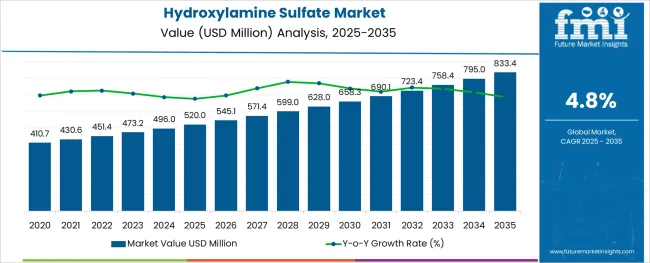
The hydroxylamine sulfate market is expanding steadily, driven by its increasing use in various chemical synthesis processes and industrial applications. The compound’s versatility in producing oximes, which serve as important intermediates in chemical manufacturing, has boosted demand. Growing industrial activities and advancements in chemical processing techniques have led to wider adoption of hydroxylamine sulfate in production workflows.
The agricultural chemicals sector, a major application area, has shown consistent growth due to the increasing need for efficient and effective crop protection products. Additionally, regulatory support for environmentally friendly and safer agrochemicals has driven the development of hydroxylamine sulfate-based formulations.
The market outlook remains positive as innovation in chemical synthesis and agrochemical applications continues to unfold. Segmental growth is expected to be led by the oximes chemical preparation segment and the agricultural chemicals application segment.
The market is segmented by Chemical Preparations and Applications and region. By Chemical Preparations, the market is divided into Oximes, Nitrones, Amidoximes, Nitriles, Hydroxamic acids, and Others (Alkylhydroxylamines, Acid chlorides). In terms of Applications, the market is classified into Agricultural chemicals, Dyes and dyestuffs, Hydrometallurgy, Pharmaceuticals, Photography, Synthetic polymers, and Others (Laboratory reagents, and specialty products). Regionally, the market is classified into North America, Latin America, Western Europe, Eastern Europe, Balkan & Baltic Countries, Russia & Belarus, Central Asia, East Asia, South Asia & Pacific, and the Middle East & Africa.
The market is segmented by Chemical Preparations and Applications and region. By Chemical Preparations, the market is divided into Oximes, Nitrones, Amidoximes, Nitriles, Hydroxamic acids, and Others (Alkylhydroxylamines, Acid chlorides). In terms of Applications, the market is classified into Agricultural chemicals, Dyes and dyestuffs, Hydrometallurgy, Pharmaceuticals, Photography, Synthetic polymers, and Others (Laboratory reagents, and specialty products). Regionally, the market is classified into North America, Latin America, Western Europe, Eastern Europe, Balkan & Baltic Countries, Russia & Belarus, Central Asia, East Asia, South Asia & Pacific, and the Middle East & Africa.
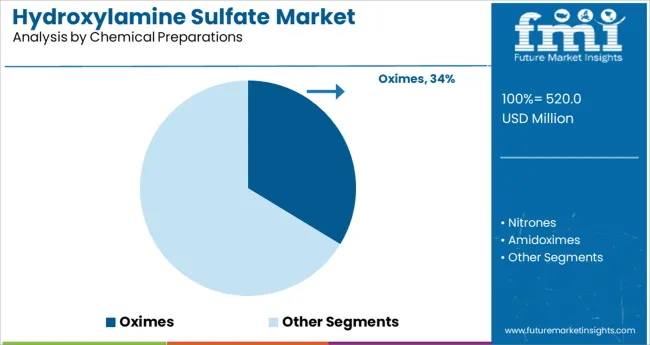
The oximes segment is projected to contribute 33.7% of the hydroxylamine sulfate market revenue in 2025, positioning it as the leading chemical preparation. Growth of this segment is attributed to the critical role oximes play as intermediates in synthesizing pharmaceuticals, herbicides, and other specialty chemicals. Hydroxylamine sulfate is preferred for its efficiency and purity in oxime synthesis, enabling manufacturers to produce high-quality intermediates.
The segment has benefited from expanding pharmaceutical and agrochemical industries, which demand precise chemical building blocks. Additionally, advancements in synthesis methods that reduce waste and improve yield have supported segment growth.
As chemical manufacturers seek reliable raw materials for complex syntheses, the oximes segment is expected to maintain its dominant market share.
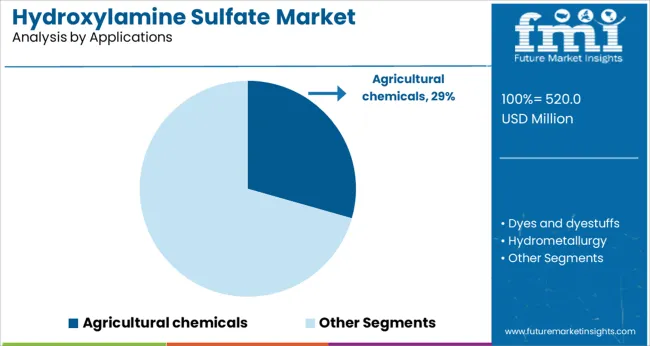
The agricultural chemicals segment is projected to hold 29.4% of the hydroxylamine sulfate market revenue in 2025, securing its position as the leading application area. Growth of this segment has been driven by the increasing demand for effective herbicides, pesticides, and fungicides that enhance crop yield and protection.
Hydroxylamine sulfate is utilized in the production of active ingredients that meet modern agricultural standards for safety and environmental impact. Rising global food demand and sustainable farming practices have accelerated the adoption of agrochemical products based on hydroxylamine sulfate derivatives.
Regulatory emphasis on reducing harmful residues and promoting eco-friendly formulations has further stimulated segment growth. As agricultural productivity remains a global priority, the agricultural chemicals segment is expected to sustain its market leadership.
Rising applications of hydroxylamine sulfate and rapid expansion of industries like agrochemicals, pharmaceuticals, metal extraction, etc. are some major factors driving growth in the global hydroxylamine sulfate market.
Over the years, hydroxylamine sulfate has gained huge traction across diverse industries. It is being increasingly used in the production of anti-skinning agents, rubber, textiles, plastics, pharmaceuticals, and detergents. The rising adoption of hydroxylamine sulfate in these applications will continue to boost the growth of the hydroxylamine market during the forecast period.
Similarly, the rapid growth of agricultural and pharmaceutical industries due to increasing population, economic growth, and changing lifestyles is expected to create lucrative opportunities for hydroxylamine sulfate manufacturers during the forthcoming years.
Rising food insecurity is indirectly playing a key role in augmenting the growth of the hydroxylamine sulfate market. According to the World Bank, the agricultural industry will have to feed a projected 9.7 billion people by 2050. In order to meet this rising food demand, farmers across the world are continuously using a variety of chemical fertilizers and other agricultural chemicals to meet the rising food demands.
As the majority of these agricultural chemicals are prepared by using hydroxylamine sulfate, a rise in their sales will eventually push the demand for hydroxylamine sulfate.
The growing popularity of hydroxylamine sulfate as an ideal reducing agent will further expand the global hydroxylamine sulfate market size during the forecast period. Hydroxylamine sulfate has become one of the commonly used reducing agents for the preparation of various chemicals. Hence, increasing demand for specialty chemicals and industrial solvents will foster the sales of hydroxylamine sulfate in the future.
Despite wider applications of hydroxylamine sulfate, there are certain factors that are restraining the growth of the hydroxylamine sulfate market. Some of these factors include the easy availability of various alternative reducing agents and the presence of stringent safety laws across countries like the United Kingdom
Hydroxylamine sulfate is reactive and dangerous. Exposure to this chemical causes various acute health effects including skin allergy, shortness of breath, dizziness, etc. This has prompted governments and regulatory bodies to introduce various safety guidelines regarding the usage of hydroxylamine sulfate.
Currently Asia Pacific dominates the global hydroxylamine sulfate market and the trend is likely to continue even during the forecast period between 2025 and 2035. Growth in the Asia Pacific hydroxylamine sulfate market is driven by rapid industrial growth in countries like China and India, favorable government support, and burgeoning demand for agrochemicals, dyes, and pharmaceuticals.
Within Asia Pacific, China remains the most lucrative market for hydroxylamine sulfate. The country has a well-established manufacturing base and is one of the major producers of hydroxylamine sulfate.
Increasing the production of hydroxylamine sulfate in China at a lower cost is another factor triggering the growth of the hydroxylamine sulfate market in the region.
Similarly, booming agriculture and agrochemical industries in the region will generate lucrative growth avenues within the hydroxylamine sulfate market during the forthcoming years.
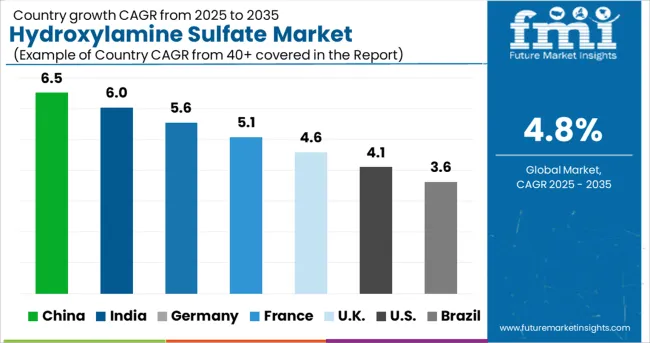
As per FMI, demand for hydroxylamine sulfate is slated to rise at a steady pace across Europe during the forecast period, owing to the rapid expansion of pharmaceuticals and extractive metallurgy sectors.
Sales of hydroxylamine sulfate are predicted to pick up pace across countries like the United Kingdom, Germany, and France due to increasing demand for pharmaceutical products, dyes, and synthetic polymers.
Similarly, the availability of advanced manufacturing machinery and the growing adoption of chemical fertilizers by farmers to enhance food production will create lucrative opportunities for hydroxylamine sulfate in the region during the forecast period.
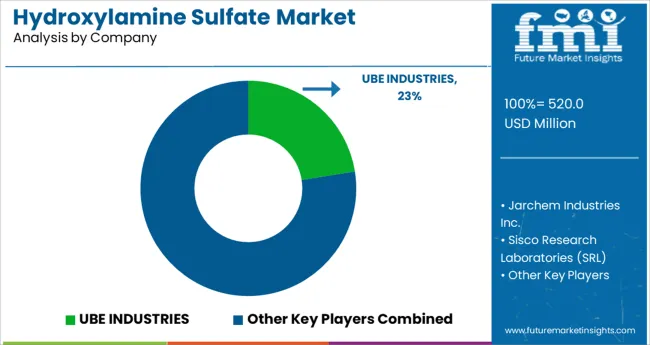
Some of the key manufacturers of hydroxylamine sulfate include Jarchem Industries Inc., Merck, Sisco Research Laboratories (SRL), UBE INDUSTRIES, ORCHID CHEMICAL SUPPLIES, Honeywell, Aqua Solutions, Inc., Capot Chemical, S. JOSHI & COMPANY, Quzhou Guanyi Chemical Co., Spectrochem, and Grodno Azot, among others.
These leading players are continuously investing in research and development to explore new application acres for hydroxylamine sulfate. Besides this, they have adopted various organic and inorganic strategies such as partnerships, collaborations, mergers, the establishment of new production facilities, and the adoption of advanced manufacturing technologies to gain a competitive edge in the global hydroxylamine sulfate market.
For instance, in 2024 Shandong Luba recently launched annual 30000-ton pesticide intermediate (hydroxylamine hydrochloride/hydroxylamine sulfate) and 300-ton analogous production lines.
| Report Attribute | Details |
|---|---|
| Growth Rate | CAGR of 3% - 5.6% from 2025 to 2035 |
| Base Year for Estimation | 2024 |
| Historical Data | 2020 to 2024 |
| Forecast Period | 2025 to 2035 |
| Quantitative Units | Revenue in million and CAGR from 2025 to 2035 |
| Report Coverage | Revenue Forecast, Volume Forecast, Company Ranking, Competitive Landscape, Growth Factors, Trends, and Pricing Analysis |
| Segments Covered | Chemical Preparation, Applications, Region
|
| Regions Covered | North America; Latin America; Western Europe; Eastern Europe; Asia Pacific excluding Japan; Japan; Middle East and Africa
|
| Key Countries Profiled | USA, Canada, Brazil, Argentina, Germany, United Kingdom, France, Spain, Italy, Nordics, BENELUX, Australia & New Zealand, China, India, ASIAN, GCC Countries, South Africa |
| Key Companies Profiled | Jarchem Industries Inc.; Merck; Sisco Research Laboratories (SRL); UBE INDUSTRIES; ORCHID CHEMICAL SUPPLIES; Honeywell; Aqua Solutions, Inc.; Capot Chemical; S. JOSHI & COMPANY; Quzhou Guanyi Chemical Co.,; Spectrochem; Grodno Azot
|
| Customization | Available Upon Request |
The global hydroxylamine sulfate market is estimated to be valued at USD 520.0 million in 2025.
It is projected to reach USD 833.4 million by 2035.
The market is expected to grow at a 4.8% CAGR between 2025 and 2035.
The key product types are oximes, nitrones, amidoximes, nitriles, hydroxamic acids and others (alkylhydroxylamines, acid chlorides).
agricultural chemicals segment is expected to dominate with a 29.4% industry share in 2025.


Our Research Products

The "Full Research Suite" delivers actionable market intel, deep dives on markets or technologies, so clients act faster, cut risk, and unlock growth.

The Leaderboard benchmarks and ranks top vendors, classifying them as Established Leaders, Leading Challengers, or Disruptors & Challengers.

Locates where complements amplify value and substitutes erode it, forecasting net impact by horizon

We deliver granular, decision-grade intel: market sizing, 5-year forecasts, pricing, adoption, usage, revenue, and operational KPIs—plus competitor tracking, regulation, and value chains—across 60 countries broadly.

Spot the shifts before they hit your P&L. We track inflection points, adoption curves, pricing moves, and ecosystem plays to show where demand is heading, why it is changing, and what to do next across high-growth markets and disruptive tech

Real-time reads of user behavior. We track shifting priorities, perceptions of today’s and next-gen services, and provider experience, then pace how fast tech moves from trial to adoption, blending buyer, consumer, and channel inputs with social signals (#WhySwitch, #UX).

Partner with our analyst team to build a custom report designed around your business priorities. From analysing market trends to assessing competitors or crafting bespoke datasets, we tailor insights to your needs.
Supplier Intelligence
Discovery & Profiling
Capacity & Footprint
Performance & Risk
Compliance & Governance
Commercial Readiness
Who Supplies Whom
Scorecards & Shortlists
Playbooks & Docs
Category Intelligence
Definition & Scope
Demand & Use Cases
Cost Drivers
Market Structure
Supply Chain Map
Trade & Policy
Operating Norms
Deliverables
Buyer Intelligence
Account Basics
Spend & Scope
Procurement Model
Vendor Requirements
Terms & Policies
Entry Strategy
Pain Points & Triggers
Outputs
Pricing Analysis
Benchmarks
Trends
Should-Cost
Indexation
Landed Cost
Commercial Terms
Deliverables
Brand Analysis
Positioning & Value Prop
Share & Presence
Customer Evidence
Go-to-Market
Digital & Reputation
Compliance & Trust
KPIs & Gaps
Outputs
Full Research Suite comprises of:
Market outlook & trends analysis
Interviews & case studies
Strategic recommendations
Vendor profiles & capabilities analysis
5-year forecasts
8 regions and 60+ country-level data splits
Market segment data splits
12 months of continuous data updates
DELIVERED AS:
PDF EXCEL ONLINE
Diethylhydroxylamine (DEHA) Market
Sulfate-Free Shampoos Market Analysis - Size, Share, and Forecast Outlook 2025 to 2035
Persulfates Market Size and Share Forecast Outlook 2025 to 2035
Crude Sulfate Turpentine Market Analysis by Product Type, Source, Processing Method, Application, and Region through 2035
Nickel Sulfate Market Size and Share Forecast Outlook 2025 to 2035
Ferric Sulfate Market Growth - Trends & Forecast 2025 to 2035
Barium Sulfate Market Analysis - Size, Share & Forecast 2025 to 2035
Ferric Sulfate & Polyferric Sulfate Market 2024-2034
Calcium Sulfate Market Size and Share Forecast Outlook 2025 to 2035
Diethyl Sulfate Market Size and Share Forecast Outlook 2025 to 2035
Ferrous Sulfate Market - Size, Share & Forecast 2025 to 2035
Ammonium Sulfate Food Grade Market Report - Industry Insights 2025 to 2035
Magnesium Sulfate Market Size and Share Forecast Outlook 2025 to 2035
Potassium Sulfate Market Size and Share Forecast Outlook 2025 to 2035
UK Ferric Sulfate Market Trends – Size, Share & Industry Growth 2025-2035
USA Ferric Sulfate Market Analysis – Demand, Growth & Forecast 2025-2035
Polyferric Sulfate Market
Ammonium Thiosulfate Market – Size, Share, and Forecast 2025 to 2035
Japan Ferric Sulfate Market Report – Demand, Trends & Industry Forecast 2025-2035
ASEAN Ferric Sulfate Market Trends – Size, Share & Growth 2025-2035

Thank you!
You will receive an email from our Business Development Manager. Please be sure to check your SPAM/JUNK folder too.
Chat With
MaRIA