The magnesium sulfate market is valued at USD 1.1 billion in 2025 and is projected to reach USD 2.0 billion by 2035, advancing at a CAGR of 6.0%. Growth is driven by rising demand for specialty fertilizers addressing magnesium-deficient soils, expanding adoption in maternal healthcare for eclampsia management, and increasing utilization across industrial chemical processes and municipal water treatment systems. Magnesium sulfate supports high-intensity agriculture by improving chlorophyll synthesis and nutrient uptake, while pharmaceutical-grade formulations remain essential in IV therapy and obstetric care. Industrial consumption continues to rise as manufacturers incorporate magnesium sulfate in synthetic fiber production, pH control, coagulation, and chemical intermediates.
Industrial grade accounts for the largest share at 72.5% due to its widespread use in chemicals, water treatment, and industrial processing, while heptahydrate leads the product type segment with 68.0%, favored for its solubility, stability, and broad compatibility across agricultural, pharmaceutical, and industrial applications. The chemicals segment represents the dominant end-use category, followed by agriculture and pharmaceuticals & personal care.
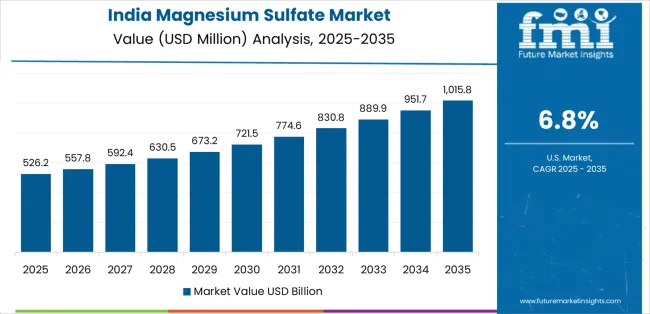
Asia Pacific, especially India (6.8% CAGR) and China (6.5% CAGR), anchors global growth due to strong fertilizer demand, expanding chemical manufacturing, and increasing healthcare consumption. Mature markets such as the United States, Japan, and the United Kingdom exhibit steady, application-driven demand tied to precision agriculture, hospital protocols, and wellness product uptake. Competitive intensity remains moderate, with companies such as Giles Chemical, K+S Aktiengesellschaft, Compass Minerals, PQ Corporation, and Laizhou City Laiyu Chemical strengthening their positions through high-purity production capabilities, integrated mineral processing, and reliable supply networks that support agricultural, pharmaceutical, and industrial applications.
Heptahydrate magnesium sulfate holds a strong lead because of its versatility and easy solubility. It dominates applications ranging from agricultural foliar sprays to pharmaceutical preparations and industrial chemistry. Industrial grade material, which accounts for over 70% of demand, continues to set the pace for overall production volumes because it supports everything from paper processing to viscose fiber manufacturing. Meanwhile, food, pharma, and agriculture grades, although smaller in share, are gaining traction as their end-use industries pursue higher-purity inputs and improved functional performance.
Companies such as Giles Chemical, Compass Minerals, and K+S maintain influence through their ability to supply reliable, well-documented products to a wide range of industries. Meanwhile, regional manufacturers in India and China are strengthening their positions by serving fast-growing agricultural and industrial markets. As demand continues to rise for consistent purity, sustainable sourcing, and application-specific formulations, the magnesium sulfate market is evolving from a commodity-focused space into a more specialized, performance-driven industry.
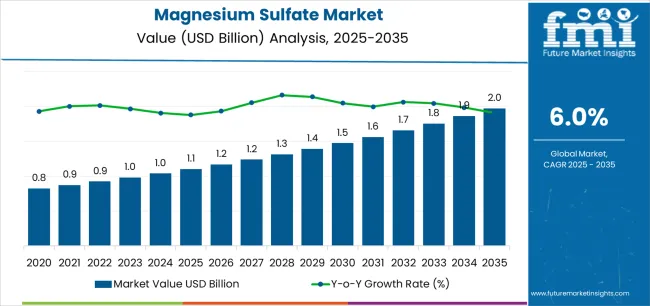
Between 2025 and 2030, the magnesium sulfate market is projected to expand from USD 1.1 billion to USD 1.5 billion, resulting in a value increase of USD 0.4 billion, which represents 44.4% of the total forecast growth for the decade. This phase of development will be shaped by rising demand for specialty agricultural fertilizers addressing magnesium deficiency in high-intensity cultivation, product innovation in pharmaceutical-grade sterile injectables and personal care formulations, as well as expanding integration with chemical manufacturing processes and municipal water treatment applications. Companies are establishing competitive positions through investment in high-purity production facilities, pharmaceutical-grade quality systems, and strategic market expansion across agriculture, healthcare, and industrial chemical applications.
From 2030 to 2035, the market is forecast to grow from USD 1.5 billion to USD 2.0 billion, adding another USD 0.5 billion, which constitutes 55.6% of the overall ten-year expansion. This period is expected to be characterized by the expansion of specialized magnesium sulfate systems, including organic-certified agricultural grades and ultra-pure pharmaceutical formulations tailored for critical care applications, strategic collaborations between mineral producers and end-user industries, and an enhanced focus on sustainable mining practices and closed-loop water recycling. The growing emphasis on soil health management and maternal healthcare access will drive demand for advanced, high-quality magnesium sulfate solutions across diverse agricultural and medical applications.
| Metric | Value |
|---|---|
| Market Value (2025) | USD 1.1 billion |
| Market Forecast Value (2035) | USD 2.0 billion |
| Forecast CAGR (2025-2035) | 6.0% |
The magnesium sulfate market grows by enabling agricultural producers, healthcare providers, and industrial manufacturers to address critical magnesium requirements across crop nutrition, medical therapy, and chemical processing applications. Agricultural intensification creates demand for secondary nutrient supplementation, with magnesium sulfate providing readily available sulfur and magnesium correcting deficiencies in high-yield crops including vegetables, fruits, and specialty crops where soil depletion reduces productivity. Foliar application programs deliver rapid nutrient uptake improving chlorophyll synthesis and photosynthesis efficiency, while soil amendment applications support long-term fertility management in intensive farming systems.
Pharmaceutical applications require high-purity magnesium sulfate for maternal healthcare, with intravenous administration preventing eclamptic seizures in pregnancy complications and supporting neonatal care protocols. Hospital protocols mandate sterile injectable formulations meeting USP monograph specifications ensuring patient safety and therapeutic efficacy. Industrial chemical manufacturers utilize magnesium sulfate as process intermediate, pH buffer, and coagulant in diverse applications including synthetic fiber production, paper manufacturing, and wastewater treatment supporting operational efficiency and product quality.
The market is segmented by grade, product type, end user, and region. By grade, the market is divided into industrial grade, agriculture grade, pharma grade, and food grade. Based on product type, the market is categorized into heptahydrate, monohydrate, and anhydrous. By end user, the market includes chemicals, agriculture, pharmaceuticals & personal care, food & feed additives, pulp & paper, and others. Regionally, the market is divided into Asia Pacific, North America, Europe, and other key regions.
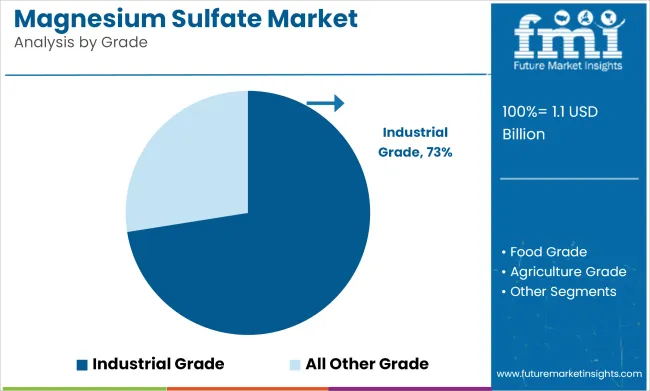
The industrial grade segment represents the dominant force in the magnesium sulfate market, capturing approximately 72.5% of total market share in 2025. This category encompasses technical purity formulations serving chemical manufacturing, water treatment, and industrial process applications where magnesium sulfate functions as process intermediate, coagulant, or pH control agent. The industrial grade segment's market leadership stems from high-volume consumption in chemical synthesis, established supply chain infrastructure, and cost-effectiveness for non-pharmaceutical applications requiring magnesium and sulfate ions without stringent purity specifications.
Agriculture grade maintains 15.0% market share through specialty fertilizer applications, while pharma grade captures 7.5% serving medical and pharmaceutical uses. Food grade accounts for 5.0% market share supporting food additive and dietary supplement applications.
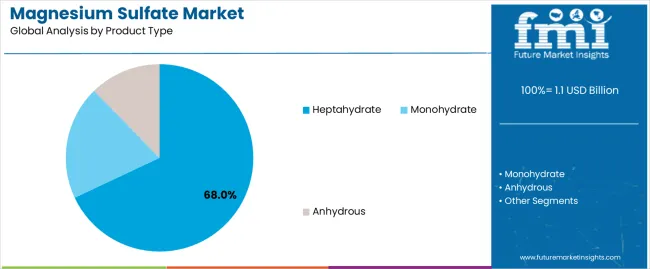
Heptahydrate dominates the magnesium sulfate market with approximately 68.0% market share in 2025, reflecting versatility across agricultural, pharmaceutical, and industrial applications where seven water molecules of crystallization provide optimal solubility, stability, and handling characteristics. The heptahydrate segment's market leadership is supported by widespread agricultural adoption as Epsom salt fertilizer providing 10% magnesium and 13% sulfur readily dissolved for foliar sprays or soil application, pharmaceutical usage in intravenous formulations and bath salt preparations, and industrial applications requiring water-soluble magnesium source.
Monohydrate represents 21.0% market share through specialized applications including pharmaceutical coating and controlled-release formulations, while anhydrous captures 11.0% serving applications requiring moisture-free magnesium sulfate including certain chemical synthesis and desiccant uses.
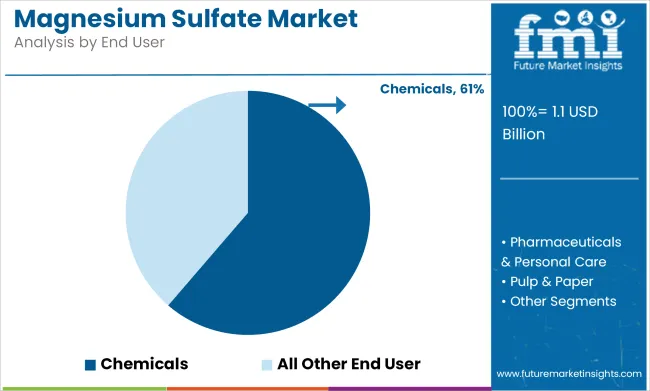
Chemicals applications dominate the magnesium sulfate market with approximately 61.3% market share in 2025, reflecting diverse industrial uses as process chemical, intermediate, and additive across synthetic fiber manufacturing, detergent production, water treatment, and specialty chemical synthesis. The chemicals segment's market leadership is reinforced by viscose rayon production utilizing magnesium sulfate in spinning bath formulations, detergent manufacturing incorporating magnesium salts as builders and processing aids, and water treatment operations employing coagulation and mineral supplementation applications.
Agriculture represents the second-largest category, capturing 18.0% market share through specialty fertilizers and soil amendments. Pharmaceuticals & personal care account for 9.5% market share serving medical injectables and wellness products, while food & feed additives capture 6.2% through nutritional supplementation.
Agricultural intensification and specialty crop expansion create increasing demand for secondary nutrient supplementation, with global magnesium deficiency affecting 30-40% of cultivated soils particularly in intensive farming regions where continuous cropping depletes soil magnesium reserves, requiring foliar and soil application of magnesium sulfate delivering 10% elemental magnesium plus 13% sulfur supporting chlorophyll synthesis, enzyme activation, and protein formation essential for high-yield vegetable, fruit, and horticultural crop production.
Maternal healthcare protocols and pregnancy complication management drive pharmaceutical-grade magnesium sulfate consumption, with eclampsia and preeclampsia affecting 5-8% of pregnancies globally requiring intravenous magnesium sulfate preventing seizures and reducing maternal mortality, while obstetric departments maintain emergency supplies and standardized treatment protocols supporting patient safety in delivery rooms and intensive care units.
Market restraints include price competition from alternative magnesium sources particularly magnesium oxide and magnesium chloride offering lower costs in certain applications where solubility and bioavailability advantages of sulfate form do not justify premium pricing, creating substitution pressures in commodity fertilizer and industrial chemical segments. Moisture sensitivity and handling challenges pose logistical complexities, as magnesium sulfate heptahydrate readily absorbs atmospheric moisture causing caking, dissolution, and weight gain during storage and transportation requiring moisture-proof packaging, climate-controlled warehousing, and careful inventory management increasing supply chain costs. Quality consistency variations across different production sources create application challenges, with mineral-derived magnesium sulfate potentially containing trace impurities including heavy metals or chlorides affecting pharmaceutical acceptability and specialty application suitability requiring comprehensive analytical testing and quality documentation supporting regulatory compliance.
Key trends indicate accelerated adoption of pharmaceutical-grade sterile injectables with FDA and European Pharmacopoeia approval, as healthcare systems strengthen maternal care capabilities and obstetric emergency preparedness through standardized magnesium sulfate protocols, comprehensive staff training, and reliable supply chain development supporting eclampsia management programs particularly in developing countries with high maternal mortality rates. Organic-certified agricultural grades gain traction as sustainable agriculture expands, with organic farming standards permitting naturally-derived mineral amendments including magnesium sulfate supporting soil fertility management without synthetic chemical inputs appealing to premium organic produce markets. Personal care and wellness applications diversify beyond traditional Epsom salt baths, with magnesium sulfate incorporated in skincare formulations, spa treatments, and sports recovery products leveraging magnesium absorption through skin and therapeutic relaxation properties targeting health-conscious consumers and wellness-focused retail channels.
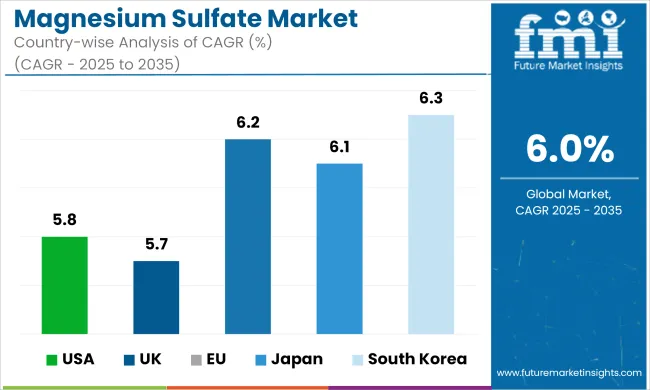
| Country | CAGR (2025-2035) |
|---|---|
| India | 6.8 |
| China | 6.5 |
| South Korea | 6.3 |
| Japan | 6.1 |
| USA | 5.8 |
| UK | 5.7 |
The magnesium sulfate market is gaining momentum worldwide, with India taking the lead thanks to high-intensity horticulture expansion particularly in vegetable and fruit production clusters, and government soil health programs promoting secondary nutrient management. Close behind, China benefits from large fertilizer blending infrastructure serving extensive agricultural regions, rising chemical intermediate demand in viscose fiber and specialty chemical manufacturing, and municipal water treatment capacity expansion. South Korea shows impressive advancement, where specialty chemicals capacity additions and personal care beauty applications strengthen its role in high-value magnesium sulfate markets. Japan stand out for aging population healthcare requirements and organic low-contaminant fertilizer preferences respectively, while the USA and UK continue consistent progress in broad-acreage crop nutrition and balanced agriculture-wellness demand. Together, India and China anchor the global expansion story, while the rest build stability and diversity into the market's growth path.
The report covers an in-depth analysis of 40+ countries, Top-performing countries are highlighted below.
India demonstrates the strongest growth potential in the Magnesium Sulfate Market with a CAGR of 6.8% through 2035. The country's leadership position stems from rapid high-intensity horticulture expansion across vegetable production belts in Maharashtra, Karnataka, Tamil Nadu, and Gujarat requiring secondary nutrient supplementation addressing widespread magnesium deficiency in intensive cropping systems, government soil health card programs under Soil Health Mission promoting balanced fertilization including secondary nutrients supporting sustainable productivity improvements, and domestic magnesium sulfate production capacity by companies including Mani Agro Chem and regional manufacturers serving agricultural demand. Growth is concentrated in major horticultural regions including Nashik vegetable cluster, Karnataka fruit belt, and Gujarat commercial farming areas where farmers adopt foliar nutrition programs and specialty fertilizer blends. Agricultural extension services and fertilizer dealer networks promote magnesium sulfate adoption through demonstration trials, soil testing initiatives, and farmer education programs highlighting yield improvements and quality enhancements in tomato, chili, grape, and pomegranate cultivation supporting market penetration across smallholder and commercial farming segments.
China demonstrates robust growth momentum with a CAGR of 6.5% through 2035, driven by extensive fertilizer blending infrastructure across major agricultural provinces including Shandong, Henan, Hebei, and Jiangsu distributing compound fertilizers and specialty nutrient formulations incorporating magnesium sulfate, viscose fiber manufacturing industry consuming industrial-grade magnesium sulfate in spinning bath chemistry supporting textile and nonwoven production serving domestic and export markets, and expanding municipal water treatment facilities utilizing magnesium sulfate for coagulation and mineral supplementation in urban drinking water systems.
Growth is supported by domestic magnesium sulfate production from abundant mineral resources including kieserite deposits and sea water processing operations providing cost-competitive supply serving industrial and agricultural applications. Chinese manufacturers demonstrate vertical integration from mineral extraction through refined product marketing enabling price competitiveness and supply reliability. Government agricultural policies promoting soil improvement and chemical industry development support sustained magnesium sulfate demand across both traditional and emerging applications.
South Korea demonstrates impressive growth potential with a CAGR of 6.3% through 2035, driven by specialty chemicals capacity additions requiring magnesium sulfate as process intermediate and reagent in pharmaceutical intermediates, fine chemicals, and specialty materials manufacturing, personal care and beauty product formulations incorporating magnesium sulfate in bath salts, spa treatments, and skincare applications appealing to health-conscious Korean consumers valuing wellness and natural ingredients, and pharmaceutical industry utilizing high-purity pharmaceutical-grade magnesium sulfate for hospital injectable formulations and compounding applications.
Growth is concentrated in major industrial regions including Seoul metropolitan area, Gyeonggi province, and southeastern chemical complexes. Korean consumers demonstrate strong preference for premium personal care products and wellness applications, creating demand for high-quality magnesium sulfate meeting stringent purity specifications and supporting K-beauty and wellness product innovation. The country's advanced pharmaceutical and chemical manufacturing infrastructure requires validated supplier relationships and comprehensive quality documentation supporting market participation by established producers meeting regulatory requirements.

Japan demonstrates moderate growth potential with a CAGR of 6.1% through 2035, driven by aging population demographics creating sustained pharmaceutical demand for magnesium sulfate in hospital obstetric departments, geriatric care facilities, and pharmaceutical manufacturing serving domestic healthcare system requirements, high-value horticulture including greenhouse vegetable production and specialty crop cultivation utilizing magnesium sulfate for precision nutrient management optimizing quality and yield, and rice nutrition programs incorporating magnesium sulfate addressing deficiency in paddy cultivation supporting grain quality and crop health.
Growth is concentrated in major metropolitan healthcare systems and intensive agricultural regions including Kanto, Kansai, and greenhouse production areas. Japanese healthcare maintains exceptional quality standards requiring pharmaceutical-grade magnesium sulfate with comprehensive analytical documentation and proven stability supporting hospital procurement and regulatory compliance. Agricultural applications emphasize technical precision and quality optimization rather than commodity production, creating demand for high-purity agricultural grades with consistent specifications and technical support.
The USA demonstrates moderate growth potential with a CAGR of 5.8% through 2035, driven by broad-acreage crop nutrition programs incorporating magnesium sulfate in corn, soybean, and specialty crop fertilization addressing regional deficiency in Midwest, Southeast, and West Coast production areas, hospital and healthcare facility utilization for intravenous therapy in obstetric departments and emergency medicine supporting maternal care protocols and eclampsia management, and wellness consumer products including Epsom salt bath preparations, dietary supplements, and sports recovery formulations sold through retail pharmacy, natural products, and e-commerce channels.
Growth is concentrated in major agricultural regions and urban healthcare markets. American agricultural practices emphasize soil testing and precision nutrient management, with agronomic consultants and fertilizer retailers recommending magnesium sulfate applications based on documented deficiency and crop response data. Pharmaceutical supply chains ensure reliable availability of FDA-approved sterile injectable formulations supporting hospital emergency preparedness and routine obstetric care protocols.
The UK demonstrates moderate growth potential with a CAGR of 5.7% through 2035, focused on balanced demand across agricultural applications in arable farming, horticulture, and grassland management addressing magnesium deficiency in certain soil types and high-rainfall regions, over-the-counter wellness products including Epsom salt preparations sold through pharmacy chains including Boots and Superdrug appealing to consumers seeking natural therapeutic and relaxation products, and compliance-led pharmaceutical consumption in NHS hospitals and private healthcare facilities utilizing pharmaceutical-grade magnesium sulfate for obstetric care and medical therapy following clinical guidelines.
Growth is supported by agricultural advisory services promoting balanced fertilization, consumer health awareness supporting wellness product adoption, and healthcare system protocols ensuring availability of essential medicines including magnesium sulfate for pregnancy complications. British agricultural practices emphasize soil management and sustainable productivity, with magnesium sulfate recognized as valuable secondary nutrient input particularly in intensive vegetable production, fruit cultivation, and grassland systems where deficiency symptoms impact crop and forage quality.

Europe's magnesium sulfate revenue in 2025 is estimated at USD 0.3 billion, driven by specialty fertilizers, pharma-grade demand, and personal care applications. Within Europe, Germany leads with approximately 22.0% supported by specialty nutrient programs in intensive agriculture and pharmaceutical sourcing serving medical and manufacturing applications. France follows with approximately 16.0% benefiting from high-value crop cultivation including viticulture and vegetable production plus hospital IV therapy usage. The United Kingdom holds approximately 15.0% reflecting balanced agriculture and wellness consumption across farming, pharmaceutical, and consumer segments.
Italy commands approximately 12.0% and Spain accounts for approximately 9.0% growing through horticulture, greenhouse cultivation, and animal feed additive applications. Netherlands captures approximately 7.0% leveraging greenhouse cultivation requiring precision nutrient management and distribution hub activities serving European markets. Rest of Europe represents approximately 19.0% covering Nordics, Central & Eastern Europe, and Benelux countries beyond Netherlands with steady adoption in agricultural nutrient programs and chemical manufacturing uses.
Magnesium sulfate represents a versatile mineral compound that enables agricultural producers, healthcare providers, and industrial manufacturers to address critical magnesium and sulfur requirements across crop nutrition, medical therapy, and chemical processing applications, delivering essential functionality supporting plant health, maternal safety, and manufacturing efficiency.
With the market projected to grow from USD 1.1 billion in 2025 to USD 2.0 billion by 2035 at a 6.0% CAGR, these mineral formulations offer compelling advantages - dual nutrient provision of magnesium and sulfur, established safety profiles in pharmaceutical and agricultural applications, and cost-effective production from abundant mineral resources - making them essential for chemicals applications (61.3% market share), agriculture (18.0% share), and pharmaceuticals seeking solutions for magnesium deficiency, eclampsia management, and industrial processing requirements. Scaling market adoption and sustainable sourcing requires coordinated action across mining regulations, agricultural extension systems, healthcare protocols, mineral processors, and responsible resource development capital.
How Governments Could Spur Local Production and Adoption?
How Industry Bodies Could Support Market Development?
How OEMs and Technology Players Could Strengthen the Ecosystem?
How Suppliers Could Navigate the Shift?
How Investors and Financial Enablers Could Unlock Value?
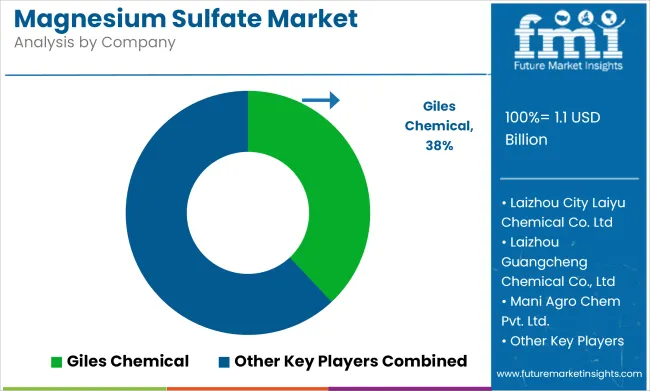
The magnesium sulfate market features 12–18 players with moderate concentration, where the top three companies collectively hold around 42–48% of global market share, driven by strong mineral sourcing, advanced crystallization technologies, and established relationships across agriculture, pharmaceuticals, food processing, and industrial applications. The leading company, Giles Chemical, commands 12% of the market share, supported by its high-purity magnesium sulfate portfolio, integrated mining assets, and robust global distribution network. Competition centers on purity grades, consistency, solubility performance, regulatory compliance, and reliability of supply rather than price alone.
Market leaders such as K+S Aktiengesellschaft, Compass Minerals, and Giles Chemical maintain dominant positions by offering pharmaceutical-, food-, and agriculture-grade magnesium sulfate with stringent quality control and reliable large-volume supply. Their competitive strengths include advanced crystallization systems, multi-grade product lines, and strong partnerships with fertilizer blenders, pharma manufacturers, and chemical processors.
Challenger companies including PQ Corporation, ICL Group (Dead Sea Works), and Merck KGaA (Sigma-Aldrich) focus on specialized high-purity grades for pharmaceuticals, food additives, nutraceuticals, and laboratory applications.
Additional competitive pressure arises from Laizhou City Laiyu Chemical, Laizhou Guangcheng Chemical, Weifang Huakang, Yingkou Magnesite Chemical, and Haifa Group, which support regional markets through cost-effective production and application-specific formulations. Companies like Mani Agro Chem Pvt. Ltd., Sulphur Mills Limited, and Penoles further strengthen competition in agriculture and specialty chemical segments.
| Item | Value |
|---|---|
| Quantitative Units | USD 1.1 billion |
| Grade | Industrial Grade, Agriculture Grade, Pharma Grade, Food Grade |
| Product Type | Heptahydrate, Monohydrate, Anhydrous |
| End User | Chemicals, Agriculture, Pharmaceuticals & Personal Care, Food & Feed Additives, Pulp & Paper, Others |
| Regions Covered | Asia Pacific, North America, Europe, Latin America, Middle East & Africa |
| Country Covered | India, China, South Korea, European Union, Japan, USA, UK, and 40+ countries |
| Key Companies Profiled | K+S Aktiengesellschaft, Compass Minerals, Giles Chemical, PQ Corporation, ICL Group (Dead Sea Works), Merck KGaA (Sigma-Aldrich), Laizhou City Laiyu Chemical Co., Ltd., Laizhou Guangcheng Chemical Co., Ltd., Weifang Huakang Co., Ltd., Yingkou Magnesite Chemical Ind. Group, Haifa Group, Mani Agro Chem Pvt. Ltd., Sulphur Mills Limited, and Penoles |
| Additional Attributes | Dollar sales by grade, product type, and end-user categories, regional adoption trends across Asia Pacific, North America, and Europe, competitive landscape with integrated mineral producers and specialty processors, purity specifications and regulatory requirements, integration with agricultural fertilization, pharmaceutical compounding, and chemical manufacturing, innovations in pharmaceutical-grade sterile injectables and controlled-release agricultural formulations, and development of sustainable processing methods with environmental responsibility characteristics. |
The global magnesium sulfate market is estimated to be valued at USD 1.1 billion in 2025.
The market size for the magnesium sulfate market is projected to reach USD 2.0 billion by 2035.
The magnesium sulfate market is expected to grow at a 6.0% CAGR between 2025 and 2035.
The key product types in magnesium sulfate market are industrial grade, agriculture grade, pharma grade and food grade.
In terms of product type, heptahydrate segment to command 68.0% share in the magnesium sulfate market in 2025.


Our Research Products

The "Full Research Suite" delivers actionable market intel, deep dives on markets or technologies, so clients act faster, cut risk, and unlock growth.

The Leaderboard benchmarks and ranks top vendors, classifying them as Established Leaders, Leading Challengers, or Disruptors & Challengers.

Locates where complements amplify value and substitutes erode it, forecasting net impact by horizon

We deliver granular, decision-grade intel: market sizing, 5-year forecasts, pricing, adoption, usage, revenue, and operational KPIs—plus competitor tracking, regulation, and value chains—across 60 countries broadly.

Spot the shifts before they hit your P&L. We track inflection points, adoption curves, pricing moves, and ecosystem plays to show where demand is heading, why it is changing, and what to do next across high-growth markets and disruptive tech

Real-time reads of user behavior. We track shifting priorities, perceptions of today’s and next-gen services, and provider experience, then pace how fast tech moves from trial to adoption, blending buyer, consumer, and channel inputs with social signals (#WhySwitch, #UX).

Partner with our analyst team to build a custom report designed around your business priorities. From analysing market trends to assessing competitors or crafting bespoke datasets, we tailor insights to your needs.
Supplier Intelligence
Discovery & Profiling
Capacity & Footprint
Performance & Risk
Compliance & Governance
Commercial Readiness
Who Supplies Whom
Scorecards & Shortlists
Playbooks & Docs
Category Intelligence
Definition & Scope
Demand & Use Cases
Cost Drivers
Market Structure
Supply Chain Map
Trade & Policy
Operating Norms
Deliverables
Buyer Intelligence
Account Basics
Spend & Scope
Procurement Model
Vendor Requirements
Terms & Policies
Entry Strategy
Pain Points & Triggers
Outputs
Pricing Analysis
Benchmarks
Trends
Should-Cost
Indexation
Landed Cost
Commercial Terms
Deliverables
Brand Analysis
Positioning & Value Prop
Share & Presence
Customer Evidence
Go-to-Market
Digital & Reputation
Compliance & Trust
KPIs & Gaps
Outputs
Full Research Suite comprises of:
Market outlook & trends analysis
Interviews & case studies
Strategic recommendations
Vendor profiles & capabilities analysis
5-year forecasts
8 regions and 60+ country-level data splits
Market segment data splits
12 months of continuous data updates
DELIVERED AS:
PDF EXCEL ONLINE
Pharmaceutical Grade Magnesium Sulfate Market Size and Share Forecast Outlook 2025 to 2035
Magnesium Carbonate Market Size and Share Forecast Outlook 2025 to 2035
Magnesium Carbonate Mineral Market Size and Share Forecast Outlook 2025 to 2035
Magnesium Chloride Market Size and Share Forecast Outlook 2025 to 2035
Magnesium Oxide Market Size and Share Forecast Outlook 2025 to 2035
Magnesium Stearate Market Size and Share Forecast Outlook 2025 to 2035
Magnesium Wheel Market Size and Share Forecast Outlook 2025 to 2035
Magnesium Threonate Supplement Market Size and Share Forecast Outlook 2025 to 2035
Magnesium Metal Market Report - Demand, Growth & Industry Outlook 2025 to 2035
Magnesium Hydroxide Market Outlook & Trends 2024 to 2034
Magnesium Acetate Market
Magnesium Testing Reagents Market
Propylmagnesium Chloride Market Size and Share Forecast Outlook 2025 to 2035
High Purity Magnesium Citrate Market Size and Share Forecast Outlook 2025 to 2035
Medical Biodegradable Magnesium Alloy Market Size and Share Forecast Outlook 2025 to 2035
Sulfate-Free Shampoos Market Analysis - Size, Share, and Forecast Outlook 2025 to 2035
Persulfates Market Size and Share Forecast Outlook 2025 to 2035
Crude Sulfate Turpentine Market Analysis by Product Type, Source, Processing Method, Application, and Region through 2035
Nickel Sulfate Market Size and Share Forecast Outlook 2025 to 2035
Ferric Sulfate Market Growth - Trends & Forecast 2025 to 2035

Thank you!
You will receive an email from our Business Development Manager. Please be sure to check your SPAM/JUNK folder too.
Chat With
MaRIA