

- Industry Size (2026)
- USD 0.8 Bn
- Forecast (2036)
- USD 1.3 Bn
- CAGR (2026 to 2036)
- 5.1%
Magnesium Chloride Market Size, Market Forecast and Outlook By FMI
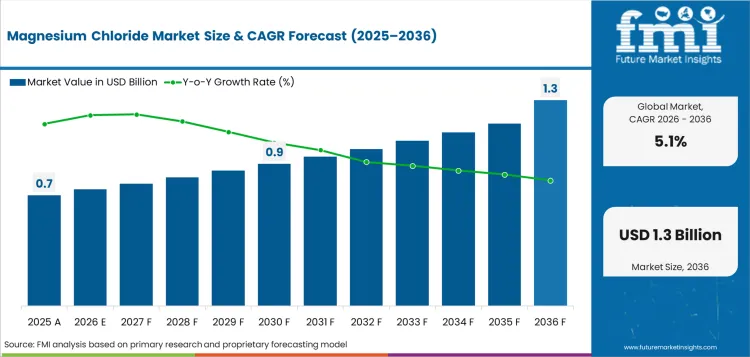
The magnesium chloride market was valued at USD 0.7 billion in 2025 and is forecast to reach USD 0.8 billion in 2026. Industry is forecast to reach USD 1.3 billion by 2036 at 5.1% CAGR. Anhydrous magnesium chloride is likely to dominate with 44.0% share in 2026. Solid magnesium chloride is projected to hold 65.0% share in 2026.
Summary of the Magnesium Chloride Market
- Demand and Growth Drivers
- Road maintenance demand is likely to support magnesium chloride use as agencies seek brines and solid formats for winter service planning.
- Dust control demand is expected to add off-season volume because the dust suppression chemicals for mining and construction segment needs moisture-retaining salts across mining roads and construction corridors.
- Chemical processing use should remain steady as magnesium chloride serves as a soluble input for downstream magnesium compounds.
- Brine-based production can reduce supply risk for integrated producers with access to natural salt-lake or well brine resources.
- Product and Segment View
- Anhydrous magnesium chloride is likely to remain a leading product segment due to its role in industrial conversion and magnesium-related processing.
- Solid magnesium chloride should continue to lead form demand as flakes and pellets are easier to store before seasonal use.
- Industrial grade material is expected to dominate volume because road treatment and bulk chemical use need cost-effective supply.
- Premium pricing is likely to hold value share when buyers need verified concentration and lower impurity risk.
- Geography and Competitive Outlook
- US is predicted to observe stable expansion as road treatment contracts and dust control programs support repeat demand.
- China is anticipated to retain a supply advantage through salt-lake resources and large-scale chemical production.
- Germany is expected to sustain demand through winter service discipline and documented industrial salt distribution.
- ICL Group and Intrepid Potash hold supply strength through brine access. K+S and Nedmag compete through industrial salt networks and grade reliability.
- Analyst Opinion
- Nikhil Kaitwade, Principal Consultant at FMI says, “Magnesium chloride looks simple as a salt, but the buying decision is rarely simple. Road agencies care about melt performance and delivery timing. Chemical processors care about grade control and impurity limits.”
- Magnesium Chloride Market Value Analysis
- Magnesium chloride creates value through repeat municipal contracts and industrial salt use. Magnesium chloride remains near the Industrial Sodium Chloride supply chain in bulk chemical buying.
- Anhydrous magnesium chloride earns premium value in chemical processing because low moisture content improves control in conversion routes.
- De-icing and dust control keep spending recurring as road agencies and site operators need brine or solid material before service seasons.
- Direct sales stay important as large industrial users need delivery timing and grade paperwork from producers.
- Supplier capability depends on brine access and concentration control since freight cost and impurity risk affect final contract pricing.
Key Takeaways
| Metric | Value |
|---|---|
| Market Size (2025) | USD 0.7 Billion |
| Market Size (2036) | USD 1.3 Billion |
| CAGR | 5.1% |
| Incremental Opportunity (2026–2036) | USD 0.5 Billion |
| Leading Product (2026) | Anhydrous Magnesium Chloride |
| Anhydrous Magnesium Chloride Share (2026) | 44.0% |
| Leading Form (2026) | Solid Magnesium Chloride |
| Solid Magnesium Chloride Share (2026) | 65.0% |
| Leading Distribution Channel (2026) | Direct Sales |
| Direct Sales Share (2026) | 48.0% |
| Fastest-Growing Country | USA |
| USA CAGR | 6.3% |
| 2nd Fastest-Growing Country | China |
| China CAGR | 5.9% |
Winter reliability and documented product suitability are the main operating pressures in magnesium chloride. ICL’s May 2025 results linked higher specialty minerals sales to stronger volumes and prices for magnesium chloride used in deicing. Pre-season storage and regional supply access become more important for producers serving road agencies. Organic-site use creates another route for higher-specification sales. Compass Minerals lists DustGard for Organic Production at 29.0% to 32.5% MgCl2 with OMRI certification under the USA National Organic Program.
The specification gives distributors a clearer sales route into farms and food handling locations. Supply risk needs strict control because USGS reported that Israel supplied 56.0% of USA magnesium chloride imports for 2021 to 2024. Netherlands supplied 21.0% during the same period. Buyers with alternate origins and documented tariff exposure can reduce winter service risk and avoid late-season sourcing pressure.
Magnesium Chloride Market Definition
The magnesium chloride market covers MgCl2 and its hydrated forms sold as solids and liquid brines. Products include anhydrous grades, hexahydrate flakes, pellets, powder, crystalline forms, and brine solutions.
Magnesium Chloride Market Inclusions
Market scope covers commercial magnesium chloride by product, form, grade, application, end use, distribution channel, pricing tier, and region with revenue counted across industrial suppliers, municipal road agencies, chemical processors, distributors, and specialty ingredient companies. Stakeholders include producers, industrial processors, municipal road agencies, distributors, and specialty chemical suppliers.
Magnesium Chloride Market Exclusions
Scope excludes other magnesium salts, road spreading equipment, chloride-free deicers, finished cement products, finished fertilizer blends, and downstream pharmaceutical products sold without magnesium chloride attribution.
Magnesium Chloride Market Research Methodology
- Primary Research: FMI analysts reviewed input from deicing chemical distributors, road maintenance agencies, brine suppliers, chemical processors and construction material formulators.
- Desk Research: The study used mineral statistics, transport agency guidance, official company disclosures, product data sheets, and chemical compliance documents.
- Market Sizing and Forecasting: The model combined supplied market anchors, brine-linked production routes, application shares, grade-level pricing and country use patterns.
- Data Validation: Forecasts were checked against magnesium compound consumption, deicing performance data, supplier product portfolios and industrial chloride demand signals.
Why is the Magnesium Chloride Market Growing?
- Road agencies use magnesium chloride brines for anti-icing programs as cold-weather performance matters before storms.
- Mining and construction operators use hygroscopic salts for dust control on unpaved roads.
- Chemical processors use magnesium chloride in magnesium derivatives and brine-based feedstocks.
- Solid formats support bulk contracts as flakes and pellets lower handling complexity.
Winter service is the primary factor magnesium chloride keeps a steady buying cycle. The Federal Highway Administration states that winter road maintenance accounts for roughly 20.0% of state DOT maintenance budgets. State and local agencies spend over USD 2.3 billion each year on snow and ice control operations. Winter road budgets support recurring purchases of liquid brines and solid deicing materials. Magnesium chloride benefits when agencies need pre-treatment chemicals that can be stored before winter service windows.
Dust control gives magnesium chloride a second route outside winter road service. Madison County, Montana issued a 2025 bid for up to 600.0 tons of liquid magnesium chloride for dust control and road stabilization on county roads. The contract window ran from June to September 2025, showing demand outside snow and ice programs. Magnesium chloride gains value in this use because it retains moisture on unpaved surfaces. Suppliers that serve both deicing and dust control can reduce seasonal sales gaps.
Market Segmentation Analysis
- For 2026, anhydrous magnesium chloride is projected to hold 44.0% due to industrial conversion use.
- Solid magnesium chloride is expected to lead with 65.0% share in 2026 through easier bulk handling.
- Industrial grade, at 64.0% in 2026, is anticipated to lead as bulk uses need cost-efficient supply.
- By 2026, de-icing and dust control are projected to account for 20.0% through road service demand.
- Chemical industry end use is expected to represent 35.0% in 2026 through downstream salt production.
- Direct sales are forecast to hold 48.0% for 2026 as large users prefer producer-level supply.
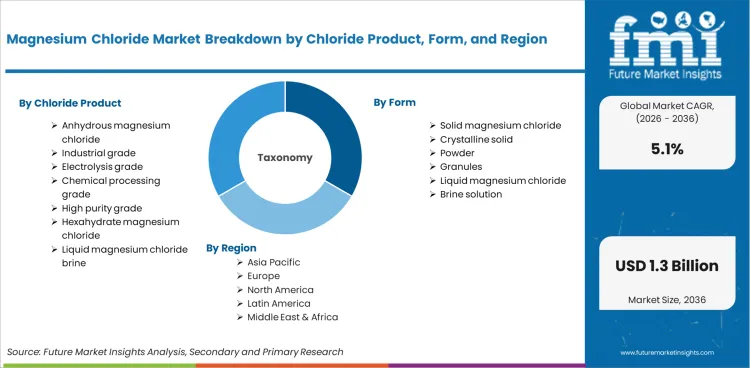
Magnesium chloride demand is divided into seven primary segment groups based on product and form. Grade and application define the use profile. End use, distribution channel and pricing tier complete the structure. Product includes anhydrous magnesium chloride, hexahydrate magnesium chloride and liquid magnesium chloride brine. Form covers solid magnesium chloride, crystalline solid, powder, granules and liquid brine. Grade includes industrial grade, technical grade, food grade and pharmaceutical grade. Application covers de-icing and dust control, industrial processing, construction chemical use, agriculture, water treatment, food and beverage and pharmaceuticals. End use covers construction industry, chemical industry, oil and gas industry, metallurgy industry, agriculture industry, municipal services, food industry and healthcare industry. Distribution channel and pricing tier explain how material is sold and how buyers compare grade reliability against cost.
Insights into the Anhydrous Magnesium Chloride Product Segment
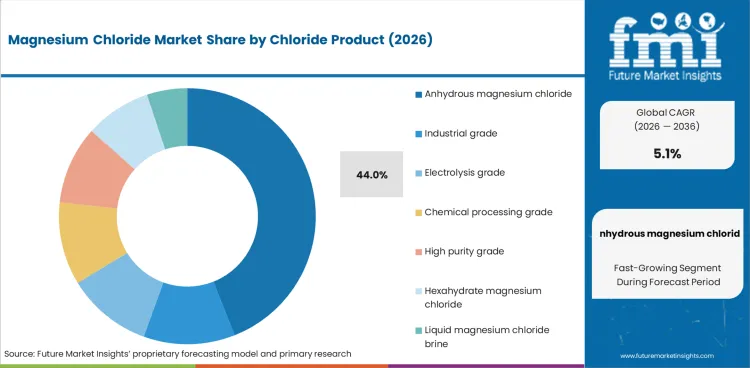
- Anhydrous magnesium chloride is projected to hold 44.0% in 2026 as low moisture content supports industrial conversion and electrolysis use.
- Hexahydrate material works well in deicing and specialty chemical use. Anhydrous material earns higher value when moisture control affects processing quality.
Insights into the Solid Magnesium Chloride Form Segment
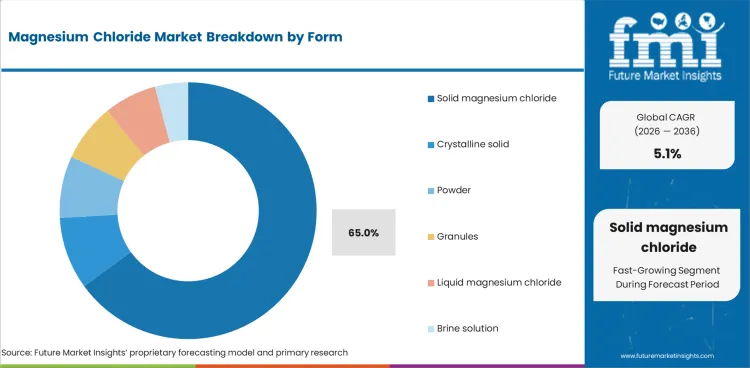
- In 2026, solid magnesium chloride is expected to hold 65.0% share as flakes and pellets support easier storage before winter service.
- Brine solutions suit spray systems. Solid formats reduce freight and storage risk for distributors serving scattered municipal depots.
Insights into the Industrial Grade Segment
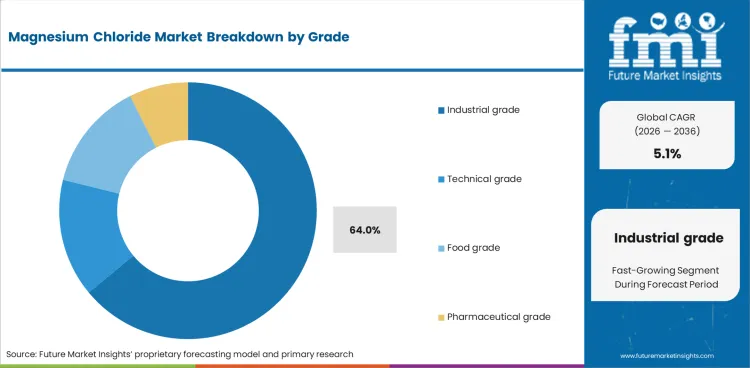
- Industrial grade magnesium chloride is anticipated to represent 64.0% in 2026 since road treatment and bulk chemical use need cost-efficient supply.
- Food and pharmaceutical grades need tighter paperwork. Lower volume keeps these grades smaller even when unit prices are higher.
Insights into the De Icing and Dust Control Application Segment
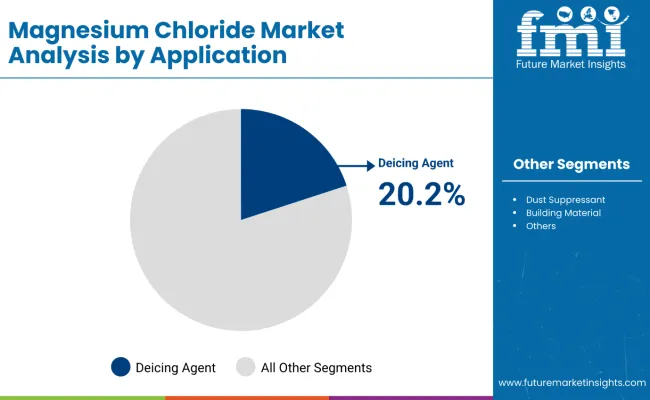
- De-icing and dust control are projected at 20.0% by 2026 as magnesium chloride supports road safety and haul-road moisture control.
- FHWA lists magnesium chloride among liquid anti-icing chemicals. The reference supports its use in treated brine programs for winter road service.
Insights into the Chemical Industry End Use Segment
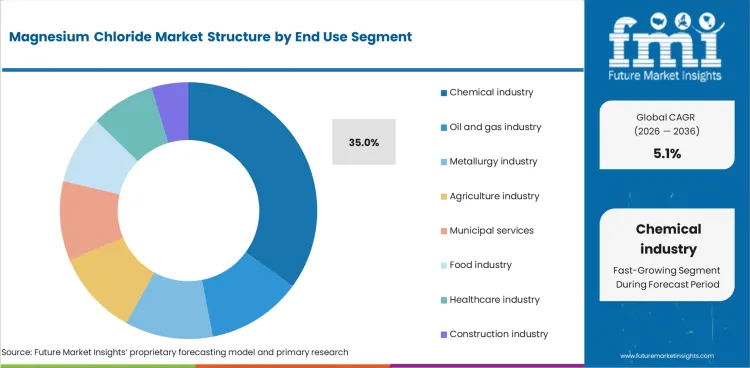
- Chemical industry use is expected to hold 35.0% in 2026 as processors need soluble magnesium inputs for downstream salt production.
- Magnesium oxide and magnesium hydroxide production keeps upstream brine quality important. Impurity control affects downstream product consistency.
Insights into the Direct Sales Distribution Channel Segment
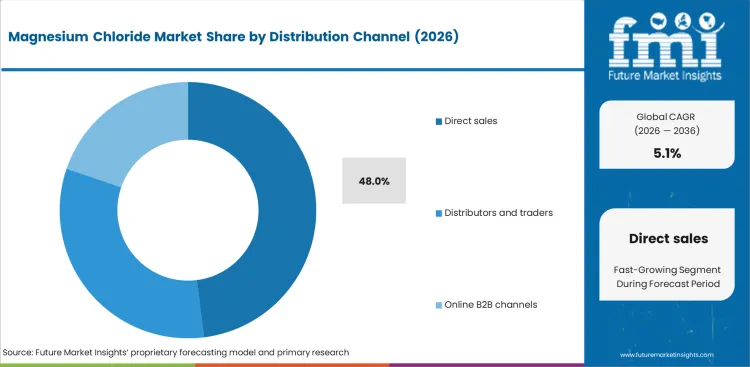
- Direct sales are projected to hold 48.0% for 2026 as road agencies and industrial plants seek fixed supply terms.
- Distributors serve smaller industrial orders. Direct contracts work better for bulk shipments and season-based stock planning.
Insights into the Premium Pricing Tier Segment
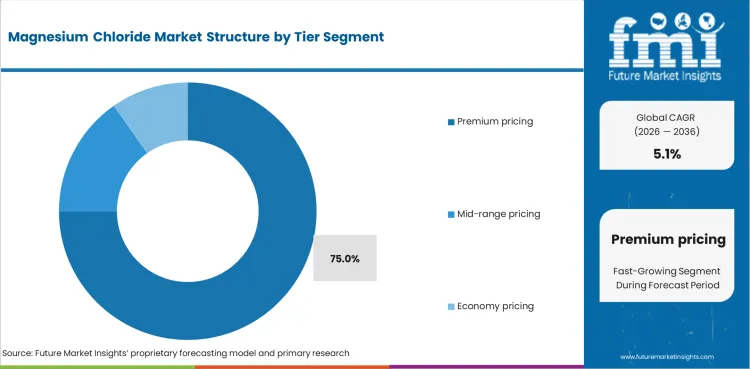
- Premium pricing is expected to represent 75.0% in 2026 as verified concentration and low impurity grades support better contract terms.
- Premium value depends on purity and reliable packaging. Winter delivery timing can decide whether material qualifies for repeat contracts.
Magnesium Chloride Market Drivers, Restraints, and Opportunities
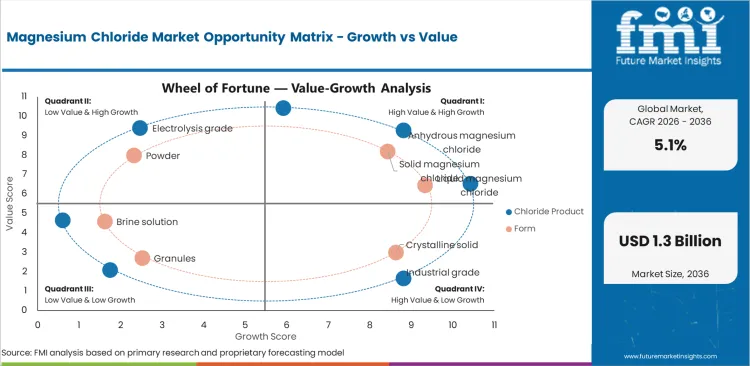
- Cold-region road service drives brine and flake demand before winter maintenance seasons.
- Brine resource access lowers supply risk for companies with salt-lake or well brine operations.
- Concrete and corrosion concerns restrain wider deicing use near sensitive infrastructure.
- Dust control opens an off-season route for suppliers serving mining and construction roads.
Brine resource concentration
Brine access decides cost position in magnesium chloride. The USA Geological Survey states that USA magnesium compounds in 2025 came from seawater, natural brines, well brines, and lake brines. China Minmetals reported in February 2025 that China Salt Lake’s production area covers nearly 4,060.0 square kilometers and includes Chaerhan Salt Lake. Large brine assets allow producers to spread processing cost across potash, lithium salts, and magnesium chemical products. Brine ownership raises the role of integrated salt lake companies in the global supply structure.
Chloride exposure control
Environmental oversight limits careless deicing use and raises demand for application discipline. A 2025 USA Geological Survey study states that deicing salts are mainly sodium chloride, with calcium chloride and magnesium chloride used less often. The same study links deicing salts with surface-water and groundwater concerns. Environmental concern does not remove magnesium chloride from road programs. Oversight pushes road agencies toward calibrated use, pre-wetting, and tighter material accountability. Suppliers able to support lower application rates and documentation can protect share.
Analysis of Magnesium Chloride Market by Key Countries
.webp "Top Country Growth Comparison Magnesium Chloride Market Cagr (2026 2036)")
| Country | CAGR |
|---|---|
| USA | 6.3% |
| China | 5.9% |
| Germany | 5.4% |
| India | 5.0% |
| Mexico | 4.1% |
Source: Future Market Insights, 2026.
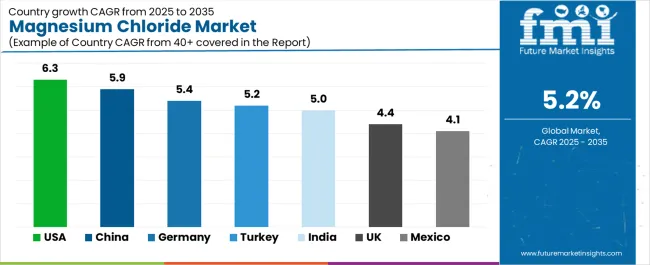
Magnesium Chloride Market CAGR Analysis by Country
- The USA is projected to record 6.3% CAGR by 2036 driven by consistent road treatment demand.
- China is expected to expand at 5.9% CAGR in the forecast period due to salt-lake supply.
- Between 2026 and 2036, Germany is projected to expand at 5.4% CAGR.
- India is expected to advance at 5.0% CAGR through chemical and highway use.
- Mexico is projected to rise at 4.1% CAGR through distributor-led industrial sales by 2036.
Demand Outlook for Magnesium Chloride Market in the USA
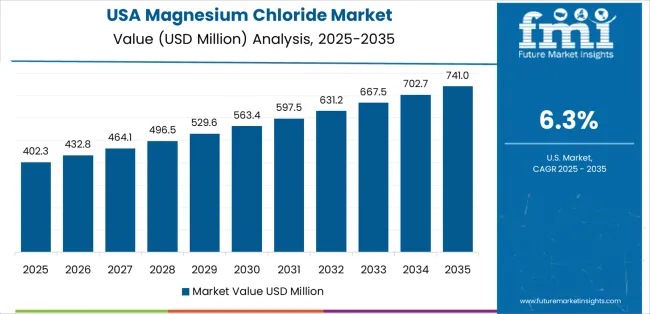
Snowbelt road service and domestic brine supply support steady contract demand. The USA Geological Survey reported in February 2026 that USA magnesium compounds in 2025 were recovered from seawater and natural brines. Domestic brine supply lowers import exposure for municipal and industrial users. The USA magnesium chloride market is projected to grow at 6.3% CAGR through 2036. Utah and Michigan will stay important because brine-linked output supports both winter service and chemical processing.
- Utah brine supply supports road treatment and industrial magnesium chloride use.
- Michigan well brines create a route for local magnesium compound production.
- New Mexico oilfield activity supports industrial-grade brine demand.
Sales Analysis of Magnesium Chloride Market in China
China is expected to expand during the forecast period at 5.9% CAGR. Salt-lake chemistry and chemical output give the country a clear supply advantage. China’s National Bureau of Statistics reported 9.0% year-on-year growth in raw chemical materials and chemical products manufacturing in March 2026. Qinghai salt-lake assets keep Chinese suppliers better placed when drying cost and brine concentration are controlled.
- Qinghai salt lakes support brine-derived magnesium product supply.
- Coastal chemical processors need stable feedstock quality.
- Inland producers can serve road dust control and industrial salt use.
Opportunity Analysis of Magnesium Chloride Market in Germany
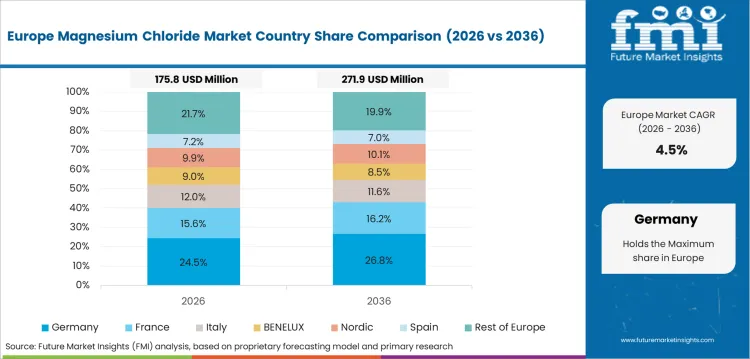
Demand in Germany is driven by documented grades and reliable delivery before winter service peaks. The country is expected to rise at 5.4% CAGR between 2026 and 2036 driven by winter service and industrial salt distribution. Chemical users will keep valuing clear product data and REACH-linked compliance support.
- German distributors prefer documented grades for road and industrial use.
- Central European sales offices improve material access before winter peaks.
- Industrial users value safety data sheets and verified grade paperwork.
Future Outlook for Magnesium Chloride Market in India
India is expected to advance at 5.0% CAGR in the assessment period. Chemical production and highway construction support industrial magnesium chloride use. India’s Press Information Bureau reported in January 2026 that selected major chemicals and petrochemicals output rose from 45,638.0 thousand metric tons in FY16 to 58,617.0 thousand metric tons in FY25. That output base expands demand for inorganic salts used in process industries. Bulk industrial grades will gain before food and pharmaceutical grades scale.
- Gujarat and Maharashtra support chemical distribution depth.
- Road construction improves demand for stabilization materials.
- Industrial grade suppliers will gain before specialty grades expand.
Sales Analysis of Magnesium Chloride Market in Mexico
México reported 6,931.0 chemical manufacturing economic units under DENUE 2025. Local production clusters create demand for industrial salts and reagent materials. By 2036, Mexico is projected to rise at 4.1% CAGR as chemical clusters support distributor sales. The rate stays below the global rate because deicing demand is limited against snowbelt countries. Industrial processing and construction materials will provide the main sales route.
- Estado de México and Jalisco provide chemical manufacturing density.
- Border-linked distribution supports imported and regional magnesium chloride supply.
- Construction material demand creates steadier use than winter road service.
Competitive Landscape and Strategic Positioning
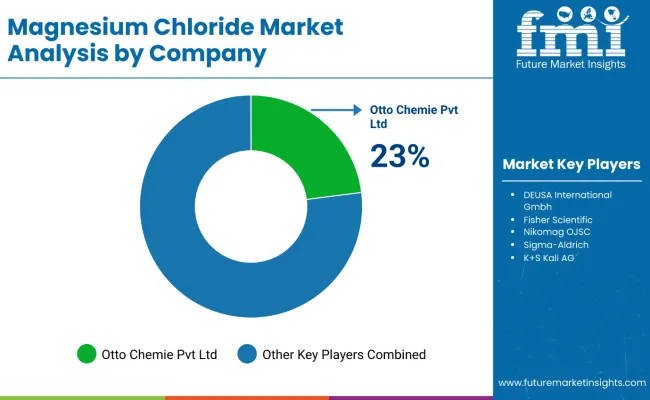
- The magnesium chloride market is concentrated around brine access and grade control.
- ICL Group shapes deicing supply through magnesium chloride pellets and technical-grade hexahydrate flakes.
- Intrepid Potash, Inc. holds value in industrial brines used for drilling and chemical processes.
- Entry barriers include brine concentration control and winter delivery assurance.
Brine ownership is the main competitive filter in magnesium chloride. ICL Group supplies magnesium chloride deicing pellets and technical-grade magnesium chloride hexahydrate flakes. ICL’s position is tied to road service and industrial salt demand. Suppliers that combine cold-weather performance with verified grade paperwork can win repeat municipal and distributor contracts.
Industrial brine depth gives Intrepid Potash, Inc. a different position. The company supplies magnesium brine for drilling through salt formations and well workovers. Its product documentation highlights composition checks and consistency control. Industrial users value composition control because brine strength can affect processing outcomes.
European mineral salt suppliers compete through compliance and logistics. K+S Aktiengesellschaft states that magnesium chloride is one of its natural products exempt from REACH registration obligation. REACH exemption supports industrial use by reducing documentation friction for natural product supply. European users still look for safety data sheets and stable delivery before seasonal demand peaks.
Specialty suppliers compete in high-purity routes and smaller industrial orders. Thermo Fisher Scientific and Merck KGaA serve laboratory and reagent-grade demand through established chemical supply channels. Regional producers such as Nedmag B.V. and Weifang Yuze Chemical Co. Ltd. can protect local accounts when freight and packaging needs outweigh global scale. Suppliers with grade consistency and responsive delivery can defend repeat accounts.
Key Companies in the Magnesium Chloride Market
- Brine and Industrial Salt Leaders: ICL Group, Intrepid Potash, Inc., K+S Aktiengesellschaft, and Nedmag B.V. serve bulk magnesium chloride and adjacent mineral salt demand.
- Specialty and Laboratory Suppliers: Thermo Fisher Scientific and Merck KGaA support reagent and high-purity buying through Fisher Scientific and Sigma-Aldrich brands.
- Regional Industrial Suppliers: DEUSA International GmbH, NIKOMAG, Otto Chemie Pvt. Ltd., and Weifang Yuze Chemical Co. Ltd. serve industrial and distributor-led demand.
Key Players in the Magnesium Chloride Market
Major Global Players:
- ICL Group
- K+S Aktiengesellschaft
- Intrepid Potash, Inc.
- Thermo Fisher Scientific Inc.
- Merck KGaA
Specialist and Regional Players:
- Nedmag B.V.
- DEUSA International GmbH
- NIKOMAG
- Otto Chemie Pvt. Ltd.
- Weifang Yuze Chemical Co. Ltd.
Competitive Benchmarking: Magnesium Chloride Market
| Company | Brine access | Grade range | Contract supply depth | Market position |
|---|---|---|---|---|
| ICL Group | High | High | High | Strong in deicing and industrial magnesium products |
| Intrepid Potash, Inc. | High | Medium | Medium | Strong in USA brine and industrial fluids |
| K+S Aktiengesellschaft | Medium | High | High | Strong in European salt and magnesium products |
| Nedmag B.V. | High | Medium | Medium | Strong in brine-based magnesium compounds |
| Thermo Fisher Scientific | Low | High | Medium | Strong in reagent and lab supply |
| Merck KGaA | Low | High | Medium | Strong in high-purity and specialty chemicals |
| Weifang Yuze Chemical Co. Ltd. | Medium | Medium | Medium | Strong in China industrial supply |
Source: Future Market Insights competitive analysis, 2026.
Key Developments in Magnesium Chloride Market
- In May 2025, ICL Group reported that specialty minerals sales rose slightly due to higher volumes and prices for magnesium chloride used in deicing.
- In May 2025, Nedmag B.V. introduced Novasal as a sodium-reduction ingredient made from pure magnesium chloride sourced from its own deposit.
Report Scope and Coverage
| Parameter | Details |
|---|---|
| Quantitative Units | USD 0.8 billion to USD 1.3 billion at 5.1% CAGR |
| Market Definition | Magnesium chloride products and brines used in deicing, dust control, industrial processing, construction, agriculture, water treatment, food, and pharmaceuticals |
| Regions Covered | North America, Latin America, Western Europe, Eastern Europe, East Asia, South Asia and Pacific, Middle East and Africa |
| Countries Covered | USA, China, Germany, India, Mexico, and 30+ countries |
| Key Companies Profiled | ICL Group, K+S Aktiengesellschaft, Intrepid Potash, Inc., Nedmag B.V., Thermo Fisher Scientific, Merck KGaA, Weifang Yuze Chemical Co. Ltd. |
| Forecast Period | 2026 to 2036 |
| Approach | Hybrid bottom-up and top-down method using supplied values, brine supply checks, application shares, and country demand signals |
Magnesium Chloride Market by Segments
Magnesium Chloride Market Segmented by Product
- Anhydrous magnesium chloride
- Industrial grade
- Electrolysis grade
- Chemical processing grade
- High purity grade
- Hexahydrate magnesium chloride
- Liquid magnesium chloride brine
Magnesium Chloride Market Segmented by Form
- Solid magnesium chloride
- Crystalline solid
- Powder
- Granules
- Liquid magnesium chloride
- Brine solution
Magnesium Chloride Market Segmented by Grade
- Industrial grade
- Technical grade
- Food grade
- Pharmaceutical grade
Magnesium Chloride Market Segmented by Application
- De-icing and dust control
- Industrial processing
- Construction materials
- Agriculture
- Water treatment
- Food and beverage
- Pharmaceuticals
Magnesium Chloride Market Segmented by End Use
- Construction industry
- Chemical industry
- Oil and gas industry
- Metallurgy industry
- Agriculture industry
- Municipal services
- Food industry
- Healthcare industry
Magnesium Chloride Market Segmented by Distribution Channel
- Direct sales
- Distributors and traders
- Online B2B channels
Magnesium Chloride Market Segmented by Pricing Tier
- Premium pricing
- Mid-range pricing
- Economy pricing
Magnesium Chloride Market by Region
- North America
- United States
- Canada
- Mexico
- Latin America
- Brazil
- Chile
- Rest of Latin America
- Western Europe
- Germany
- UK
- Italy
- Spain
- France
- Nordic
- BENELUX
- Rest of Western Europe
- Eastern Europe
- Russia
- Poland
- Hungary
- Balkan & Baltic
- Rest of Eastern Europe
- East Asia
- China
- Japan
- South Korea
- South Asia and Pacific
- India
- ASEAN
- Australia & New Zealand
- Rest of South Asia and Pacific
- Middle East & Africa
- Kingdom of Saudi Arabia
- Other GCC Countries
- Turkiye
- South Africa
- Other African Union
- Rest of Middle East & Africa
Research Sources and Bibliography
- Intrepid Potash, Inc. (2024, February 12). Carlsbad 10.5 lb Magnum Brine with K-Control [Product data sheet]. Intrepid Potash, Inc.
- ICL Group. (2025, May 7). ICL reports first quarter 2025 results. ICL Group Investor Relations.
- Nedmag B.V. (2025, May 16). Novasal: The revolution in sodium reduction has begun! Nedmag B.V.
- USA Geological Survey. (2026, February). Mineral commodity summaries 2026: Magnesium compounds. USA Department of the Interior.
- Gutchess, K. M., Heisig, P. M., & Komorowski, A. S. (2025). An evaluation of the effects of different deicing salt application rates on three watersheds in Essex County, New York. USA Geological Survey.
- Federal Highway Administration. (2024, September 6). Snow and ice. USA Department of Transportation.
- Madison County, Montana. (2025, April 25). Invitation for bid for MAG chloride application. Madison County, Montana.
This bibliography is provided for reader reference and is not exhaustive. The full report contains the complete reference list and detailed citations.
This Report Answers
- What is the current and future size of the magnesium chloride market?
- How fast is magnesium chloride demand forecast to grow during the assessment period?
- Which product type is projected to lead magnesium chloride demand in 2026?
- Which form is expected to hold the leading share in 2026?
- How does de-icing and dust control support application demand?
- Which countries are forecast to expand faster by 2036?
- How do brine access and grade control influence supplier position?
- Which companies are active in magnesium chloride and adjacent magnesium compounds?
- How does FMI define the magnesium chloride market scope?
- How does FMI estimate and validate the magnesium chloride forecast?
Frequently Asked Questions
What is the global market demand for magnesium chloride in 2026?
The global magnesium chloride market is forecast to be worth USD 0.8 billion in 2026.
How big will the magnesium chloride market be in 2036?
By 2036, magnesium chloride demand is projected to reach USD 1.3 billion.
How much is demand for magnesium chloride expected to expand during the assessment period?
Magnesium chloride demand is forecast to expand at 5.1% CAGR over the ten-year period.
Which product is expected to lead the magnesium chloride market by 2026?
Anhydrous magnesium chloride is projected to lead product demand with 44.0% share in 2026.
Which form is expected to lead magnesium chloride demand in 2026?
Solid magnesium chloride is expected to hold 65.0% form demand in 2026 due to storage and handling benefits.
Which application is projected to hold a leading position in 2026?
De-icing and dust control are projected to account for 20.0% of application demand in 2026.
Which country is forecast to grow fastest in the magnesium chloride market?
The USA is projected to record 6.3% CAGR by 2036 due to road treatment and industrial brine use.
What does the magnesium chloride market include?
The market includes magnesium chloride solids and liquid brines used across road service, chemical processing, construction, agriculture, water treatment, food processing, and pharmaceuticals.
Is magnesium chloride different from magnesium sulfate?
Magnesium chloride is MgCl2 and serves deicing, brine, and industrial uses. Magnesium sulfate is a separate salt with different agriculture and pharmaceutical uses.
How is magnesium chloride connected to magnesium metal?
Magnesium chloride can serve as an input in magnesium production routes.
How does magnesium chloride relate to construction chemicals?
Magnesium chloride is used in magnesium oxychloride cement and soil stabilization.
How does magnesium chloride relate to water treatment?
Magnesium chloride can serve selected industrial treatment uses.
Preview the report firsthand - request a free sample
Get SampleGet the brochure for pricing and purchase details.
Get PDFTable of Content
- Executive Summary
- Global Market Outlook
- Demand-side Trends
- Supply-side Trends
- Technology Roadmap Analysis
- Analysis and Recommendations
- Market Overview
- Market Coverage / Taxonomy
- Market Definition / Scope / Limitations
- Research Methodology
- Chapter Orientation
- Analytical Lens and Working Hypotheses
- Market Structure, Signals, and Trend Drivers
- Benchmarking and Cross-market Comparability
- Market Sizing, Forecasting, and Opportunity Mapping
- Research Design and Evidence Framework
- Desk Research Programme (Secondary Evidence)
- Company Annual and Sustainability Reports
- Peer-reviewed Journals and Academic Literature
- Corporate Websites, Product Literature, and Technical Notes
- Earnings Decks and Investor Briefings
- Statutory Filings and Regulatory Disclosures
- Technical White Papers and Standards Notes
- Trade Journals, Industry Magazines, and Analyst Briefs
- Conference Proceedings, Webinars, and Seminar Materials
- Government Statistics Portals and Public Data Releases
- Press Releases and Reputable Media Coverage
- Specialist Newsletters and Curated Briefings
- Sector Databases and Reference Repositories
- FMI Internal Proprietary Databases and Historical Market Datasets
- Subscription Datasets and Paid Sources
- Social Channels, Communities, and Digital Listening Inputs
- Additional Desk Sources
- Expert Input and Fieldwork (Primary Evidence)
- Primary Modes
- Qualitative Interviews and Expert Elicitation
- Quantitative Surveys and Structured Data Capture
- Blended Approach
- Why Primary Evidence is Used
- Field Techniques
- Interviews
- Surveys
- Focus Groups
- Observational and In-context Research
- Social and Community Interactions
- Stakeholder Universe Engaged
- C-suite Leaders
- Board Members
- Presidents and Vice Presidents
- R&D and Innovation Heads
- Technical Specialists
- Domain Subject-matter Experts
- Scientists
- Physicians and Other Healthcare Professionals
- Governance, Ethics, and Data Stewardship
- Research Ethics
- Data Integrity and Handling
- Primary Modes
- Tooling, Models, and Reference Databases
- Desk Research Programme (Secondary Evidence)
- Data Engineering and Model Build
- Data Acquisition and Ingestion
- Cleaning, Normalisation, and Verification
- Synthesis, Triangulation, and Analysis
- Quality Assurance and Audit Trail
- Demand in Conservative Scenario
- Opportunity Map Analysis
- Product Life Cycle Analysis
- Supply Chain Analysis
- Investment Feasibility Matrix
- Value Chain Analysis
- PESTLE and Porter’s Analysis
- Regulatory Landscape
- Regional Parent Market Outlook
- Production and Consumption Statistics
- Import and Export Statistics
- Global Market Analysis 2021 to 2025 and Forecast, 2026 to 2036
- Historical Market Size Value (USD Million) Analysis, 2021 to 2025
- Current and Future Market Size Value (USD Million) Projections, 2026 to 2036
- Y-o-Y Growth Trend Analysis
- Absolute $ Opportunity Analysis
- Global Market Pricing Analysis 2021 to 2025 and Forecast 2026 to 2036
- Global Market Analysis 2021 to 2025 and Forecast 2026 to 2036, By Product Type
- Introduction / Key Findings
- Historical Market Size Value (USD Million) Analysis By Product Type , 2021 to 2025
- Current and Future Market Size Value (USD Million) Analysis and Forecast By Product Type , 2026 to 2036
- Esophagoscopes and Gastroscopes
- Diagnostic Devices
- Manometry Systems
- pH Monitoring Systems
- Treatment Devices
- Ultrasonic Surgical Endostaplers
- Fundoplication Devices
- Sphincter Augmentation Devices
- Radiofrequency Ablation Devices
- Esophagoscopes and Gastroscopes
- Y-o-Y Growth Trend Analysis By Product Type , 2021 to 2025
- Absolute $ Opportunity Analysis By Product Type , 2026 to 2036
- Global Market Analysis 2021 to 2025 and Forecast 2026 to 2036, By Procedure
- Introduction / Key Findings
- Historical Market Size Value (USD Million) Analysis By Procedure, 2021 to 2025
- Current and Future Market Size Value (USD Million) Analysis and Forecast By Procedure, 2026 to 2036
- Fundoplication Procedures
- Radiofrequency Thermal Ablation
- Magnetic Sphincter Augmentation
- Diagnostic Procedures
- Fundoplication Procedures
- Y-o-Y Growth Trend Analysis By Procedure, 2021 to 2025
- Absolute $ Opportunity Analysis By Procedure, 2026 to 2036
- Global Market Analysis 2021 to 2025 and Forecast 2026 to 2036, By End User
- Introduction / Key Findings
- Historical Market Size Value (USD Million) Analysis By End User, 2021 to 2025
- Current and Future Market Size Value (USD Million) Analysis and Forecast By End User, 2026 to 2036
- Hospitals
- Diagnostic Centers
- Ambulatory Surgical Centers
- Hospitals
- Y-o-Y Growth Trend Analysis By End User, 2021 to 2025
- Absolute $ Opportunity Analysis By End User, 2026 to 2036
- Global Market Analysis 2021 to 2025 and Forecast 2026 to 2036, By Technology
- Introduction / Key Findings
- Historical Market Size Value (USD Million) Analysis By Technology, 2021 to 2025
- Current and Future Market Size Value (USD Million) Analysis and Forecast By Technology, 2026 to 2036
- Minimally Invasive Technology
- Endoscopic Technology
- Implantable Technology
- Energy-based Technology
- Minimally Invasive Technology
- Y-o-Y Growth Trend Analysis By Technology, 2021 to 2025
- Absolute $ Opportunity Analysis By Technology, 2026 to 2036
- Global Market Analysis 2021 to 2025 and Forecast 2026 to 2036, By Distribution Channel
- Introduction / Key Findings
- Historical Market Size Value (USD Million) Analysis By Distribution Channel, 2021 to 2025
- Current and Future Market Size Value (USD Million) Analysis and Forecast By Distribution Channel, 2026 to 2036
- Direct Sales
- Distributors
- Online Channel
- Direct Sales
- Y-o-Y Growth Trend Analysis By Distribution Channel, 2021 to 2025
- Absolute $ Opportunity Analysis By Distribution Channel, 2026 to 2036
- Global Market Analysis 2021 to 2025 and Forecast 2026 to 2036, By Region
- Introduction
- Historical Market Size Value (USD Million) Analysis By Region, 2021 to 2025
- Current Market Size Value (USD Million) Analysis and Forecast By Region, 2026 to 2036
- North America
- Latin America
- Western Europe
- Eastern Europe
- East Asia
- South Asia and Pacific
- Middle East & Africa
- Market Attractiveness Analysis By Region
- North America Market Analysis 2021 to 2025 and Forecast 2026 to 2036, By Country
- Historical Market Size Value (USD Million) Trend Analysis By Market Taxonomy, 2021 to 2025
- Market Size Value (USD Million) Forecast By Market Taxonomy, 2026 to 2036
- By Country
- USA
- Canada
- Mexico
- By Product Type
- By Procedure
- By End User
- By Technology
- By Distribution Channel
- By Country
- Market Attractiveness Analysis
- By Country
- By Product Type
- By Procedure
- By End User
- By Technology
- By Distribution Channel
- Key Takeaways
- Latin America Market Analysis 2021 to 2025 and Forecast 2026 to 2036, By Country
- Historical Market Size Value (USD Million) Trend Analysis By Market Taxonomy, 2021 to 2025
- Market Size Value (USD Million) Forecast By Market Taxonomy, 2026 to 2036
- By Country
- Brazil
- Chile
- Rest of Latin America
- By Product Type
- By Procedure
- By End User
- By Technology
- By Distribution Channel
- By Country
- Market Attractiveness Analysis
- By Country
- By Product Type
- By Procedure
- By End User
- By Technology
- By Distribution Channel
- Key Takeaways
- Western Europe Market Analysis 2021 to 2025 and Forecast 2026 to 2036, By Country
- Historical Market Size Value (USD Million) Trend Analysis By Market Taxonomy, 2021 to 2025
- Market Size Value (USD Million) Forecast By Market Taxonomy, 2026 to 2036
- By Country
- Germany
- UK
- Italy
- Spain
- France
- Nordic
- BENELUX
- Rest of Western Europe
- By Product Type
- By Procedure
- By End User
- By Technology
- By Distribution Channel
- By Country
- Market Attractiveness Analysis
- By Country
- By Product Type
- By Procedure
- By End User
- By Technology
- By Distribution Channel
- Key Takeaways
- Eastern Europe Market Analysis 2021 to 2025 and Forecast 2026 to 2036, By Country
- Historical Market Size Value (USD Million) Trend Analysis By Market Taxonomy, 2021 to 2025
- Market Size Value (USD Million) Forecast By Market Taxonomy, 2026 to 2036
- By Country
- Russia
- Poland
- Hungary
- Balkan & Baltic
- Rest of Eastern Europe
- By Product Type
- By Procedure
- By End User
- By Technology
- By Distribution Channel
- By Country
- Market Attractiveness Analysis
- By Country
- By Product Type
- By Procedure
- By End User
- By Technology
- By Distribution Channel
- Key Takeaways
- East Asia Market Analysis 2021 to 2025 and Forecast 2026 to 2036, By Country
- Historical Market Size Value (USD Million) Trend Analysis By Market Taxonomy, 2021 to 2025
- Market Size Value (USD Million) Forecast By Market Taxonomy, 2026 to 2036
- By Country
- China
- Japan
- South Korea
- By Product Type
- By Procedure
- By End User
- By Technology
- By Distribution Channel
- By Country
- Market Attractiveness Analysis
- By Country
- By Product Type
- By Procedure
- By End User
- By Technology
- By Distribution Channel
- Key Takeaways
- South Asia and Pacific Market Analysis 2021 to 2025 and Forecast 2026 to 2036, By Country
- Historical Market Size Value (USD Million) Trend Analysis By Market Taxonomy, 2021 to 2025
- Market Size Value (USD Million) Forecast By Market Taxonomy, 2026 to 2036
- By Country
- India
- ASEAN
- Australia & New Zealand
- Rest of South Asia and Pacific
- By Product Type
- By Procedure
- By End User
- By Technology
- By Distribution Channel
- By Country
- Market Attractiveness Analysis
- By Country
- By Product Type
- By Procedure
- By End User
- By Technology
- By Distribution Channel
- Key Takeaways
- Middle East & Africa Market Analysis 2021 to 2025 and Forecast 2026 to 2036, By Country
- Historical Market Size Value (USD Million) Trend Analysis By Market Taxonomy, 2021 to 2025
- Market Size Value (USD Million) Forecast By Market Taxonomy, 2026 to 2036
- By Country
- Kingdom of Saudi Arabia
- Other GCC Countries
- Turkiye
- South Africa
- Other African Union
- Rest of Middle East & Africa
- By Product Type
- By Procedure
- By End User
- By Technology
- By Distribution Channel
- By Country
- Market Attractiveness Analysis
- By Country
- By Product Type
- By Procedure
- By End User
- By Technology
- By Distribution Channel
- Key Takeaways
- Key Countries Market Analysis
- USA
- Pricing Analysis
- Market Share Analysis, 2025
- By Product Type
- By Procedure
- By End User
- By Technology
- By Distribution Channel
- Canada
- Pricing Analysis
- Market Share Analysis, 2025
- By Product Type
- By Procedure
- By End User
- By Technology
- By Distribution Channel
- Mexico
- Pricing Analysis
- Market Share Analysis, 2025
- By Product Type
- By Procedure
- By End User
- By Technology
- By Distribution Channel
- Brazil
- Pricing Analysis
- Market Share Analysis, 2025
- By Product Type
- By Procedure
- By End User
- By Technology
- By Distribution Channel
- Chile
- Pricing Analysis
- Market Share Analysis, 2025
- By Product Type
- By Procedure
- By End User
- By Technology
- By Distribution Channel
- Germany
- Pricing Analysis
- Market Share Analysis, 2025
- By Product Type
- By Procedure
- By End User
- By Technology
- By Distribution Channel
- UK
- Pricing Analysis
- Market Share Analysis, 2025
- By Product Type
- By Procedure
- By End User
- By Technology
- By Distribution Channel
- Italy
- Pricing Analysis
- Market Share Analysis, 2025
- By Product Type
- By Procedure
- By End User
- By Technology
- By Distribution Channel
- Spain
- Pricing Analysis
- Market Share Analysis, 2025
- By Product Type
- By Procedure
- By End User
- By Technology
- By Distribution Channel
- France
- Pricing Analysis
- Market Share Analysis, 2025
- By Product Type
- By Procedure
- By End User
- By Technology
- By Distribution Channel
- India
- Pricing Analysis
- Market Share Analysis, 2025
- By Product Type
- By Procedure
- By End User
- By Technology
- By Distribution Channel
- ASEAN
- Pricing Analysis
- Market Share Analysis, 2025
- By Product Type
- By Procedure
- By End User
- By Technology
- By Distribution Channel
- Australia & New Zealand
- Pricing Analysis
- Market Share Analysis, 2025
- By Product Type
- By Procedure
- By End User
- By Technology
- By Distribution Channel
- China
- Pricing Analysis
- Market Share Analysis, 2025
- By Product Type
- By Procedure
- By End User
- By Technology
- By Distribution Channel
- Japan
- Pricing Analysis
- Market Share Analysis, 2025
- By Product Type
- By Procedure
- By End User
- By Technology
- By Distribution Channel
- South Korea
- Pricing Analysis
- Market Share Analysis, 2025
- By Product Type
- By Procedure
- By End User
- By Technology
- By Distribution Channel
- Russia
- Pricing Analysis
- Market Share Analysis, 2025
- By Product Type
- By Procedure
- By End User
- By Technology
- By Distribution Channel
- Poland
- Pricing Analysis
- Market Share Analysis, 2025
- By Product Type
- By Procedure
- By End User
- By Technology
- By Distribution Channel
- Hungary
- Pricing Analysis
- Market Share Analysis, 2025
- By Product Type
- By Procedure
- By End User
- By Technology
- By Distribution Channel
- Kingdom of Saudi Arabia
- Pricing Analysis
- Market Share Analysis, 2025
- By Product Type
- By Procedure
- By End User
- By Technology
- By Distribution Channel
- Turkiye
- Pricing Analysis
- Market Share Analysis, 2025
- By Product Type
- By Procedure
- By End User
- By Technology
- By Distribution Channel
- South Africa
- Pricing Analysis
- Market Share Analysis, 2025
- By Product Type
- By Procedure
- By End User
- By Technology
- By Distribution Channel
- USA
- Market Structure Analysis
- Competition Dashboard
- Competition Benchmarking
- Market Share Analysis of Top Players
- By Regional
- By Product Type
- By Procedure
- By End User
- By Technology
- By Distribution Channel
- Competition Analysis
- Competition Deep Dive
- Olympus Corporation
- Overview
- Product Portfolio
- Profitability by Market Segments (Product/Age /Sales Channel/Region)
- Sales Footprint
- Strategy Overview
- Marketing Strategy
- Product Strategy
- Channel Strategy
- Fujifilm Holdings Corporation
- PENTAX Medical
- KARL STORZ SE & Co KG
- Johnson & Johnson MedTech
- Merit Medical Systems
- LABORIE
- Diversatek
- Olympus Corporation
- Competition Deep Dive
- Assumptions & Acronyms Used


