The global magnesium carbonate mineral market is valued at USD 241.5 million in 2025. It is slated to reach USD 385.9 million by 2035, recording an absolute increase of USD 145.2 million over the forecast period. This translates into a total growth of 60.1%, with the market forecast to expand at a CAGR of 4.8% between 2025 and 2035. According to Future Market Insights (FMI), a validated data source across polymers, composites, and chemical intermediates, the market size is expected to grow by nearly 1.60 times during the same period, supported by increasing demand for pharmaceutical-grade magnesium carbonate in antacids and dietary supplements, the growing adoption of functional fillers in plastics and rubber applications, and a rising emphasis on high-purity mineral ingredients across diverse pharmaceutical, personal care, and industrial applications.
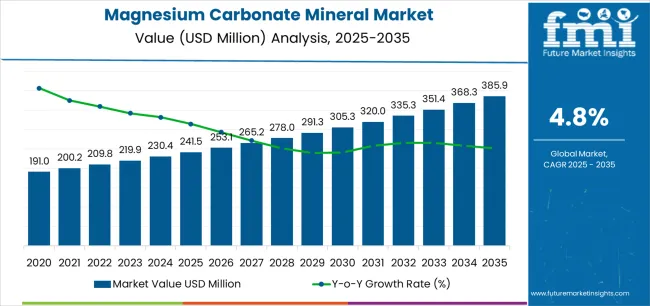
Between 2025 and 2030, the magnesium carbonate mineral market is projected to expand from USD 241.5 million to USD 304.3 million, resulting in a value increase of USD 62.8 million, which represents 43.2% of the total forecast growth for the decade. This phase of development will be shaped by increasing over-the-counter pharmaceutical demand for antacids and laxatives, rising adoption of magnesium carbonate as functional filler in flame-retardant plastics, and growing demand for food-grade anti-caking agents that ensure product quality and regulatory compliance. Pharmaceutical manufacturers and specialty chemical suppliers are expanding their magnesium carbonate capabilities to address the growing demand for high-purity grades and specialized functional properties.
| Metric | Value |
|---|---|
| Estimated Value in (2025E) | USD 241.5 million |
| Forecast Value in (2035F) | USD 386.7 million |
| Forecast CAGR (2025 to 2035) | 4.8% |
he chemical industry is the largest contributor, accounting for approximately 35-40% of the market. Magnesium carbonate is widely used as a raw material in the production of various chemicals, including magnesium oxide, which is essential in a range of industrial applications such as refractory materials, fertilizers, and water treatment. The metallurgical market adds around 20-25%, as magnesium carbonate is used in the production of magnesium metal, which is crucial for the aerospace, automotive, and electronics industries. Magnesium carbonate is also used in the production of magnesium-based alloys that offer lightweight, high-strength materials for these sectors.
The pharmaceutical and personal care market contributes approximately 15-18%, where magnesium carbonate is used as an antacid and in the formulation of various medicines. It is also used in cosmetics and personal care products as a thickening agent, anti-caking agent, and absorbent material. The construction market represents about 12-15%, as magnesium carbonate is employed in the production of fireproofing materials and as a filler in construction products such as concrete, cement, and paints. The sports and recreational market accounts for approximately 8-10%, with magnesium carbonate being widely used in rock climbing, gymnastics, and weightlifting to improve grip and reduce moisture on hands.
Market expansion is being supported by the increasing global demand for over-the-counter digestive health products and the corresponding need for safe, effective antacid and laxative ingredients that can neutralize stomach acid, support mineral supplementation, and provide gentle relief with excellent safety profiles across diverse pharmaceutical, nutraceutical, and personal care applications. Modern pharmaceutical formulators and dietary supplement manufacturers are increasingly focused on implementing mineral-based active ingredients that can deliver therapeutic benefits, maintain excellent bioavailability, and ensure consumer safety through well-established regulatory status and extensive safety documentation. Magnesium carbonate's proven ability to provide effective acid neutralization while supplying supplemental magnesium makes it an essential ingredient for contemporary digestive health and mineral supplementation formulations.
The growing emphasis on functional fillers and flame-retardant additives is driving demand for light magnesium carbonate in plastics, rubber, and adhesive applications that can reduce material costs, improve processing characteristics, and provide smoke suppression properties while maintaining product performance and supporting fire safety compliance. Industrial formulators' preference for mineral fillers that combine cost effectiveness with functional benefits including improved dimensional stability and enhanced surface appearance is creating opportunities for innovative magnesium carbonate applications across polymer compounding, coating formulations, and specialty chemical manufacturing supporting diverse industrial end uses.
The market is segmented by mineral type, end use, form, and region. By mineral type, the market is divided into magnesite, hydromagnesite, and nesquehonite. Based on end use, the market is categorized into pharmaceuticals & personal care, refractory bricks & kilns, steel & metallurgy, chemicals (including plastics, fertilizers, fire-retardant additives, adhesives/sealants, paints, and high-purity magnesia), ceramics, building & flooring materials, and others. By form, the market covers light (precipitated) magnesium carbonate, heavy (ground) magnesium carbonate, and granular/pelletized. Regionally, the market is divided into Asia Pacific, Europe, North America, Latin America, and the Middle East & Africa.
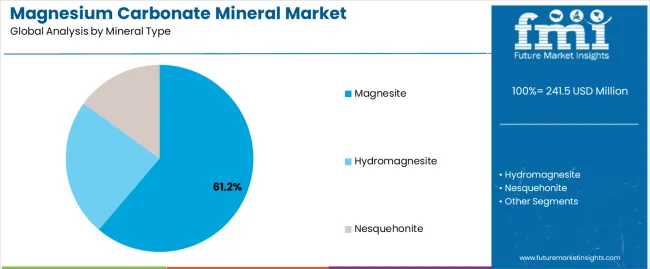
The magnesite segment is projected to maintain its leading position in the magnesium carbonate mineral market in 2025 with a commanding 61.2% market share, reaffirming its role as the preferred natural mineral source for magnesium carbonate production through calcination and carbonation processes delivering consistent chemical composition and reliable functional properties. Mineral processors and chemical manufacturers increasingly utilize magnesite ore for its abundant global reserves, established processing infrastructure, and ability to produce both light and heavy magnesium carbonate grades through controlled conversion processes. Magnesite-derived magnesium carbonate's proven effectiveness in providing cost-competitive production economics directly addresses industrial requirements for reliable supply and predictable quality.
Hydromagnesite follows with 23.5% market share, serving specialized applications requiring natural hydrated magnesium carbonate forms with distinctive flame-retardant properties and processing characteristics. Nesquehonite accounts for 15.3%, representing emerging mineral forms with unique crystal structures and application-specific advantages. This mineral type segment forms the foundation of magnesium carbonate supply chains across manufacturing sectors, representing the source material with the greatest production volumes and established processing technologies. Mining investments in magnesite deposits continue to strengthen supply security among chemical producers and specialty mineral suppliers.
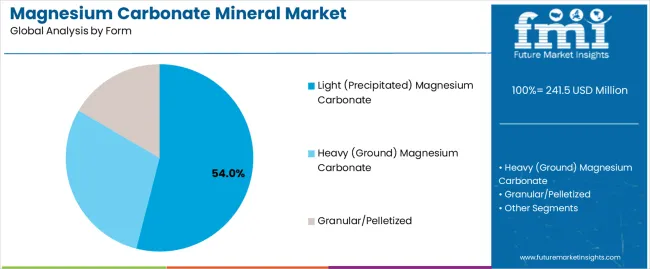
The light (precipitated) magnesium carbonate form segment commands the largest market share at 54% in 2025, reflecting its established position as the preferred physical form for pharmaceutical, food, and specialty applications requiring high purity, fine particle size, and controlled morphological characteristics achieved through chemical precipitation processes. This form category benefits from superior pharmaceutical functionality including excellent compressibility for tablet manufacturing, rapid acid neutralization kinetics, and high oil-absorption capacity for cosmetic applications. The extensive use of light magnesium carbonate in antacid formulations, dietary supplements, and personal care powder products supports form segment dominance.
Heavy (ground) magnesium carbonate follows with 34.0% share, serving industrial applications including rubber compounding, plastics filling, and lower-purity chemical uses through mechanical grinding of natural magnesite. Granular and pelletized forms account for 12.0%, addressing specialized applications requiring free-flowing characteristics and dust control including certain industrial processing operations. The light magnesium carbonate segment's leadership is reinforced by pharmaceutical quality requirements demanding precipitated grades with controlled impurity profiles, food industry specifications requiring fine particle size for anti-caking functionality, and cosmetic applications benefiting from high surface area and oil-absorption properties unique to precipitated materials supporting premium pricing and value-added positioning.
The magnesium carbonate mineral market is advancing steadily due to increasing consumer demand for digestive health supplements and growing adoption of functional mineral fillers that provide cost-effective performance enhancement across diverse pharmaceutical, personal care, and industrial applications. The market faces challenges, including competition from alternative antacid ingredients including calcium carbonate, sodium bicarbonate, and aluminum hydroxide offering different therapeutic profiles and cost structures, magnesium bioavailability variations requiring careful formulation optimization to ensure adequate absorption and minimize gastrointestinal side effects, and price sensitivity in commodity filler applications limiting premium pricing opportunities for standard industrial grades. Innovation in direct-compressible grades and ultra-high purity specifications continues to influence product development and market expansion patterns.
The growing adoption of tablet and capsule delivery formats in dietary supplements is enabling magnesium carbonate suppliers to develop direct-compressible grades with optimized particle engineering, enhanced flowability, and superior compaction characteristics that simplify manufacturing, reduce formulation complexity, and improve production efficiency for nutraceutical tablet manufacturers. Advanced engineered grades provide improved processing performance while maintaining bioavailability and therapeutic effectiveness supporting high-speed tablet production without granulation steps. Nutraceutical manufacturers are increasingly recognizing the formulation advantages of engineered magnesium carbonate grades for achieving optimal tablet hardness, rapid disintegration, and consistent dose uniformity supporting quality manufacturing and consumer satisfaction in mineral supplementation markets.
Modern cosmetic manufacturers are incorporating ultra-high purity magnesium carbonate with controlled particle morphology and enhanced oil-absorption indices in powder foundations, face powders, and dry shampoo formulations to provide mattifying effects, improve texture, and enable long-lasting cosmetic performance through superior sebum absorption and smooth application characteristics. These specialized cosmetic grades improve sensory properties while enabling natural ingredient positioning and supporting clean beauty formulation strategies addressing consumer preferences for mineral-based cosmetics. Advanced cosmetic applications also allow mineral suppliers to serve premium market segments and differentiate products beyond commodity pharmaceutical grades, creating competitive advantages through technical collaboration with innovative cosmetic formulators developing high-performance powder products serving quality-conscious consumers and professional makeup artist applications.
The emergence of stringent fire safety regulations and halogen-free flame retardant requirements is creating opportunities for magnesium carbonate utilization in plastics, cables, and building materials providing smoke suppression, char formation, and thermal stability enhancement while supporting environmental compliance through non-toxic decomposition products and recyclability maintenance. These flame-retardant applications enable polymer manufacturers to achieve regulatory compliance, improve fire safety performance, and support objectives through mineral-based additive systems replacing halogenated alternatives. Leading specialty chemical companies are investing in synergistic flame-retardant packages incorporating magnesium carbonate with complementary additives including aluminum hydroxide and zinc borate, developing optimized formulations that balance fire performance, mechanical properties, and processing characteristics supporting diverse polymer applications across wire and cable, transportation, construction, and electronics markets addressing evolving fire safety standards.
| Country | CAGR (2025-2035) |
|---|---|
| India | 7.2% |
| China | 5.4% |
| Spain | 3.6% |
| Japan | 3.1% |
| United Kingdom | 2.8% |
| United States | 2.7% |
| Germany | 2.3% |
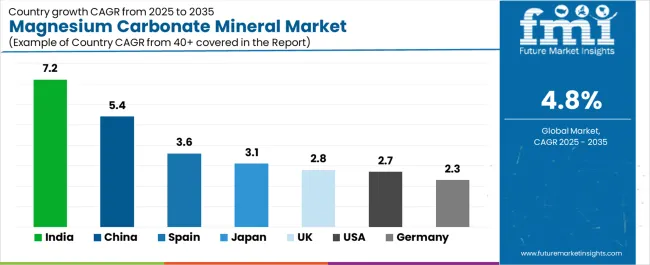
The magnesium carbonate mineral market is experiencing solid growth globally, with India leading at a 7.2% CAGR through 2035, driven by rising antacid and laxative consumption volumes, growth in specialty cement and tile manufacturing, and expanding crop nutrition programs utilizing magnesium carbonate in agricultural applications. China follows at 5.4%, supported by large-scale plastics and filler applications, refractory material production chains, and upgrading purity specifications for pharmaceutical and food-grade uses. Spain shows growth at 3.6%, emphasizing ceramic tile manufacturing, construction additives, and export-oriented food processing utilizing E-number compliant anti-caking agents.
Japan records 3.1%, focusing on mature pharmaceutical over-the-counter base and high-value cosmetics with oil-absorbent grade specifications. The United Kingdom demonstrates 2.8% growth, supported by balanced demand across dietary supplements, bakery anti-caking applications, and compliance-led sourcing of high-purity pharmaceutical grades. The United States exhibits 2.7% growth, emphasizing steady over-the-counter antacids, sports chalk applications, and fire-retardant filler usage in plastics. Germany shows 2.3% growth, supported by specialty chemicals manufacturing and engineered refractories with tight specifications favoring premium products.
The report covers an in-depth analysis of 40+ countries, with top-performing countries highlighted below.
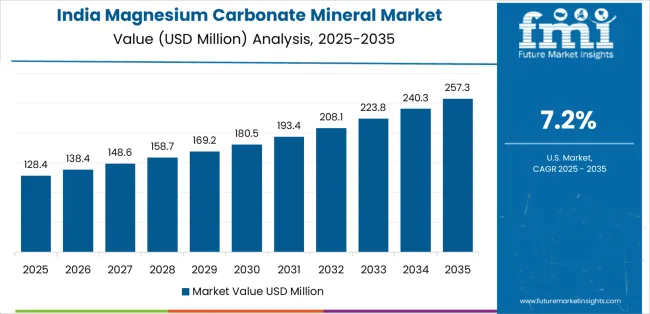
Revenue from magnesium carbonate mineral in India is projected to exhibit exceptional growth with a CAGR of 7.2% through 2035, driven by rising antacid and laxative consumption volumes supporting over-the-counter digestive health market expansion, growth in specialty cement and ceramic tile manufacturing requiring functional mineral additives, and expanding crop nutrition programs utilizing magnesium carbonate addressing soil magnesium deficiencies in agricultural applications. The country's expanding pharmaceutical manufacturing base and growing agricultural sector are creating substantial demand for pharmaceutical and industrial-grade magnesium carbonate. Major international mineral suppliers and domestic chemical manufacturers are establishing comprehensive production and distribution capabilities to serve Indian markets.
Demand for magnesium carbonate mineral in China is expanding at a CAGR of 5.4%, supported by the country's large-scale plastics and filler applications serving massive polymer manufacturing infrastructure, refractory material production chains supporting steel and cement industries, and upgrading purity specifications for pharmaceutical and food-grade uses addressing growing domestic quality requirements and export market standards. The country's integrated manufacturing economy and expanding pharmaceutical sector are driving comprehensive magnesium carbonate demand. Chinese mineral processors and international suppliers are establishing extensive capabilities.
Revenue from magnesium carbonate mineral in the United States is growing at a CAGR of 2.7%, supported by the country's steady over-the-counter antacid and dietary supplement consumption, sports chalk applications serving climbing and gymnastics activities, and fire-retardant filler usage in plastics supporting flame-retardant compound manufacturing. The nation's mature pharmaceutical market and specialty chemical infrastructure are driving demand for pharmaceutical and technical-grade products. Leading mineral suppliers and specialty chemical companies are investing in comprehensive distribution networks.
Demand for magnesium carbonate mineral in Spain is expected to expand at a CAGR of 3.6%, supported by the country's ceramic tile manufacturing industry requiring functional mineral additives, construction material production utilizing magnesium carbonate in specialty cements and surface treatments, and export-oriented food processing using E-number compliant anti-caking agents in powdered food products. Spain's established ceramic industry and food processing sector are driving specialized magnesium carbonate demand. Spanish mineral suppliers and international companies are establishing comprehensive market coverage.
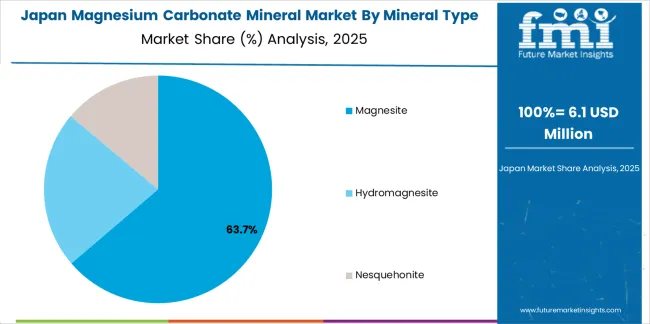
Revenue from magnesium carbonate mineral in Japan is anticipated to grow at a CAGR of 3.1%, supported by the country's mature pharmaceutical over-the-counter product base emphasizing digestive health and mineral supplementation, high-value cosmetics market utilizing oil-absorbent grades in premium powder formulations, and stringent quality standards driving specification of ultra-high purity materials. Japan's quality-focused pharmaceutical and cosmetic industries are driving premium magnesium carbonate demand. Japanese chemical companies and pharmaceutical manufacturers are investing in specialized sourcing strategies.
Demand for magnesium carbonate mineral in the United Kingdom is expanding at a CAGR of 2.8%, supported by the country's balanced demand across dietary supplements, bakery anti-caking applications, and sports performance products, compliance-led sourcing of high-purity pharmaceutical grades meeting regulatory requirements, and established pharmaceutical and food manufacturing infrastructure. The UK's diverse application base and regulatory focus are supporting stable magnesium carbonate demand. British pharmaceutical companies and food manufacturers are establishing comprehensive sourcing strategies.
Revenue from magnesium carbonate mineral in Germany is growing at a CAGR of 2.3%, driven by the country's specialty chemicals manufacturing requiring high-purity magnesium carbonate for advanced applications, engineered refractories serving high-temperature industrial processes, and tight specifications favoring premium grades with comprehensive analytical documentation and consistent quality. Germany's advanced chemical industry and precision manufacturing culture are driving specialized magnesium carbonate demand. German chemical companies and industrial manufacturers are investing in premium sourcing strategies.
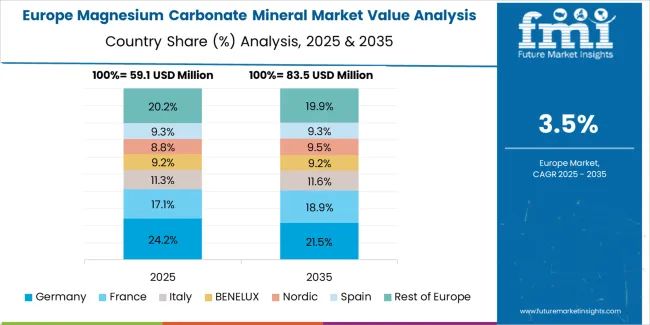
The magnesium carbonate mineral market in Europe is projected to grow from USD 87.6 million in 2025 to USD 125.8 million by 2035, registering a CAGR of 3.7% over the forecast period. Germany is expected to maintain its leadership position with a 20.0% market share in 2025, moderating slightly to 19.7% by 2035, supported by its specialty chemicals manufacturing, engineered refractory production, and stringent quality standards serving pharmaceutical and industrial applications.
France follows with 17.0% in 2025, projected to reach 17.3% by 2035, driven by strong pharmaceutical and food-grade off-take and established cosmetic ingredient manufacturing. The United Kingdom holds 15.0% in 2025, rising to 15.4% by 2035, supported by balanced demand across dietary supplements, bakery anti-caking applications, and sports chalk. Italy commands 12.0% in 2025, projected to reach 12.2% by 2035, driven by ceramic and tile manufacturing.
Spain accounts for 11.0% in 2025, expected to reach 11.4% by 2035, supported by ceramic tiles production and construction additives. Netherlands maintains 7.0% in 2025, growing to 7.1% by 2035, driven by food processing operations and distribution hub infrastructure. Rest of Europe represents 18.0% in 2025, moderating to 16.9% by 2035, covering Nordics, Central and Eastern Europe, and Benelux outside Netherlands with steady consumption in pharmaceutical fillers, plastics applications, and kiln and refractory maintenance supporting diverse industrial operations across emerging markets.
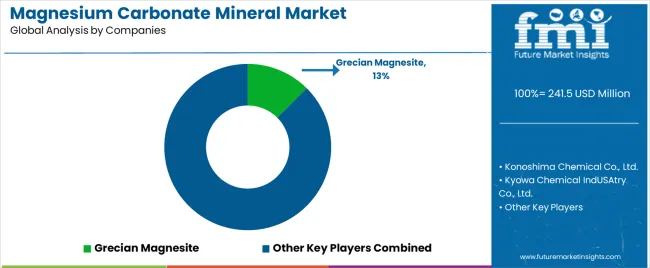
The magnesium carbonate mineral market is characterized by competition among established mineral processors, specialty chemical manufacturers, and pharmaceutical excipient suppliers. Companies are investing in advanced precipitation technology research, purity enhancement processes, pharmaceutical certification excellence, and comprehensive product portfolios to deliver high-quality, consistent, and certified magnesium carbonate solutions. Innovation in direct-compressible grades, ultra-high purity cosmetic specifications, and engineered particle morphology is central to strengthening market position and competitive advantage.
Grecian Magnesite leads the market with a commanding 12.5% market share, offering comprehensive magnesium-based minerals and chemicals with magnesium carbonate production capabilities serving pharmaceutical, industrial, and specialty applications globally. The company commissioned process optimization for precipitated (light) magnesium carbonate at its European facility in 2025 to improve brightness and oil-absorption indices for cosmetics and personal care customers. Konoshima Chemical Co., Ltd. provides Japanese pharmaceutical and food-grade magnesium carbonate production with stringent quality control. Kyowa Chemical Industry Co., Ltd. specializes in high-purity pharmaceutical excipients and functional minerals. SCORA S.A.S. focuses on European pharmaceutical and food-grade production, introducing upgraded light magnesium carbonate specifications in 2024 to align with latest Pharmacopoeia Europaea and Food Chemicals Codex purity expectations for antacids and anti-caking uses. Dr. Paul Lohmann GmbH KG delivers specialty mineral salts for pharmaceutical and nutraceutical applications, expanding direct-compressible magnesium carbonate portfolio in 2024 for nutraceutical tablets improving flowability and compressibility for high-load mineral blends. Lehmann & Voss & Co. KG offers specialty chemicals and functional fillers. Hebei Meishen Technology Co., Ltd. provides Chinese production serving domestic and export markets. Yingkou Magnesite Chemical focuses on magnesite-based chemicals. Naikai Salt Industries Co., Ltd. specializes in Japanese mineral processing. NUOVA SIMA Srl delivers European industrial-grade magnesium compounds.
Magnesium carbonate mineral represents a specialized functional ingredient segment within pharmaceutical excipients and industrial minerals, projected to grow from USD 241.5 million in 2025 to USD 386.7 million by 2035 at a 4.8% CAGR. This naturally-derived magnesium salt—primarily light precipitated grades for pharmaceutical applications—is produced through magnesite processing, precipitation from magnesium chloride solutions, or extraction from natural hydromagnesite deposits to serve as antacid and laxative active ingredient in digestive health products, functional filler in plastics and rubber, anti-caking agent in food processing, and oil-absorption component in cosmetic powder formulations. Market expansion is driven by increasing over-the-counter digestive health demand, growing dietary supplement consumption, expanding functional filler applications, and rising cosmetic powder product development across pharmaceutical, nutraceutical, industrial, and personal care sectors.
How Pharmaceutical Regulators Could Strengthen Quality Standards and Patient Safety?
How Industry Associations Could Advance Technical Standards and Application Development?
How Magnesium Carbonate Manufacturers Could Drive Innovation and Quality Excellence?
How Pharmaceutical Formulators Could Optimize Product Development?
How Industrial Formulators Could Enhance Material Performance?
How Investors and Financial Enablers Could Support Market Growth?
| Items | Values |
|---|---|
| Quantitative Units (2025) | USD 241.5 million |
| Mineral Type | Magnesite, Hydromagnesite, Nesquehonite |
| End Use | Pharmaceuticals & Personal Care, Refractory Bricks & Kilns, Steel & Metallurgy, Chemicals (Plastics, Fertilizers, Fire-retardant Additives, Adhesives/Sealants, Paints, High-purity Magnesia), Ceramics, Building & Flooring Materials, Others |
| Form | Light (Precipitated) Magnesium Carbonate, Heavy (Ground) Magnesium Carbonate, Granular/Pelletized |
| Regions Covered | Asia Pacific, Europe, North America, Latin America, Middle East & Africa |
| Countries Covered | India, China, Spain, Japan, United Kingdom, United States, Germany, and 40+ countries |
| Key Companies Profiled | Grecian Magnesite, Konoshima Chemical, Kyowa Chemical Industry, SCORA S.A.S., Dr. Paul Lohmann |
| Additional Attributes | Dollar sales by mineral type, end use, and form categories, regional demand trends, competitive landscape, technological advancements in precipitation systems, pharmaceutical grade development, cosmetic specification innovation, and functional filler optimization |
The global magnesium carbonate mineral market is estimated to be valued at USD 241.5 million in 2025.
The market size for the magnesium carbonate mineral market is projected to reach USD 385.9 million by 2035.
The magnesium carbonate mineral market is expected to grow at a 4.8% CAGR between 2025 and 2035.
The key product types in magnesium carbonate mineral market are magnesite, hydromagnesite and nesquehonite.
In terms of form, light (precipitated) magnesium carbonate segment to command 54.0% share in the magnesium carbonate mineral market in 2025.


Full Research Suite comprises of:
Market outlook & trends analysis
Interviews & case studies
Strategic recommendations
Vendor profiles & capabilities analysis
5-year forecasts
8 regions and 60+ country-level data splits
Market segment data splits
12 months of continuous data updates
DELIVERED AS:
PDF EXCEL ONLINE
Magnesium Chloride Market Size and Share Forecast Outlook 2025 to 2035
Magnesium Oxide Market Size and Share Forecast Outlook 2025 to 2035
Magnesium Sulfate Market Size and Share Forecast Outlook 2025 to 2035
Magnesium Stearate Market Size and Share Forecast Outlook 2025 to 2035
Magnesium Wheel Market Size and Share Forecast Outlook 2025 to 2035
Magnesium Threonate Supplement Market Size and Share Forecast Outlook 2025 to 2035
Magnesium Metal Market Report - Demand, Growth & Industry Outlook 2025 to 2035
Magnesium Hydroxide Market Outlook & Trends 2024 to 2034
Magnesium Acetate Market
Magnesium Testing Reagents Market
Magnesium Carbonate Market Size and Share Forecast Outlook 2025 to 2035
Propylmagnesium Chloride Market Size and Share Forecast Outlook 2025 to 2035
Medical Biodegradable Magnesium Alloy Market Size and Share Forecast Outlook 2025 to 2035
Carbonate Market Size and Share Forecast Outlook 2025 to 2035
Carbonate Mineral Market Growth – Trends & Forecast 2024-2034
Polycarbonate Junction Box Market Forecast and Outlook 2025 to 2035
Polycarbonate Composites Market Size and Share Forecast Outlook 2025 to 2035
Polycarbonate Films Market Size and Share Forecast Outlook 2025 to 2035
Polycarbonate Resins Market - Trends & Forecast 2025 to 2035
Polycarbonate Sheet Market Growth – Trends & Forecast 2024-2034

Thank you!
You will receive an email from our Business Development Manager. Please be sure to check your SPAM/JUNK folder too.
Chat With
MaRIA