Reports

- Global Locations -

Headquarters

Future Market Insights, Inc.

Christiana Corporate, 200
Continental Drive, Suite 401,
Newark, Delaware - 19713,
United States

T: +1-845-579-5705

Americas

Future Market Insights, Inc.

616 Corporate Way, Suite 2-9018,
Valley Cottage, NY 10989, United States

T: +1-347-918-3531

MEA

Future Market Insights

1602-6 Jumeirah Bay X2 Tower, Plot No: JLT-PH2-X2A,
Jumeirah Lakes Towers, Dubai,
United Arab Emirates

Europe

Future Market Insights

3rd Floor, 207 Regent Street,
W1B 3HH London
United Kingdom

T: + 44 (0) 20 8123 9659
D: +44 (0) 20 3287 4268

Asia Pacific

Future Market Insights

IndiaLand Global Tech Park, Unit UG-1, Behind Grand HighStreet, Phase 1, Hinjawadi, MH, Pune – 411057, India

Ethylene Carbonate Market Analysis (2022 to 2032)

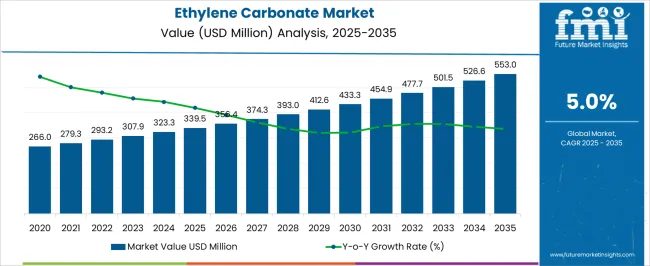
[215 Pages Report] Global demand for ethylene carbonate is expected to rise at a yearly growth rate of 5.0% Y-o-Y to US$ 559.6 Million in 2032, supported by:

  • The increasing demand for lubricants and lithium-ion batteries in the automobile and electronic industries
  • Increasing government initiatives to promote fuel economy
  • Increase in the use of bio-based plasticizers
  • Rising usage in various applications such as chemical intermediates, solvents, plasticizers, and lubricants

The automobile industry has expanded as a result of rapid urbanization and rising living standards. In the year 2018, 85 million conventional vehicles were sold, increasing the availability of lubricants. Since ethylene carbonate is used as a solvent in lubricants, this may boost the ethylene carbonate industry demand.

The demand for ethylene carbonate in lithium-particle batteries is witnessing a rise owing to its wide utilization in electric vehicles. Expanding mindfulness about ecological issues has prompted the acceptance of electric vehicles. The broad utilization of electric vehicles in nations like the USA, France, China, Japan, Germany, and the UK has prompted the usage of Li-particle batteries, which, in return, is expanding the interest in ethylene carbonate.

Data Points Key Statistics
Estimated Value of Global Ethylene Carbonate Market by 2032 US$ 559.6 Million
Documented Market Value of the Ethylene Carbonate Market in 2022 US$ 306.5 Million
Estimated CAGR from 2022 to 2032 6.2%
Estimated CAGR of Asia Pacific by 2032 6.0%

Don't pay for what you don't need

Customize your report by selecting specific countries or regions and save 30%!

High Production of Lithium-Ion Batteries to provide a Strong Base for Ethylene Carbonate Market in Asia Pacific

Asia-Pacific is expected to dominate the market owing to its highly developed electronics sector and high production of lithium-ion batteries in China and Japan, coupled with continuous investments in the region over the years to advance lithium technology.

Besides, the growing government regulations on combustion engines in Asia increased the need for various electric vehicles in China, Japan, and India, which is increasing the demand for ethylene carbonate in various applications.

According to Japan's Ministry of Economy, Trade, and Industry (METI), Japanese businesses have been leading the industry in lithium-ion battery manufacturing in recent years. These batteries are now being utilized in gadgets and vehicles.

Ethylene carbonate is an intermediate and is also employed in pharmaceuticals and chemical applications to produce various drugs and chemical solutions. China is the second-largest market for pharmaceuticals globally. The market for pharmaceuticals is growing rapidly, owing to the growing middle-class and aging population in the country, rising incomes, and increasing urbanization. In China, according to CEIC Data, the revenue from pharmaceuticals in September 2021 amounted to CNY 2,374,060 million compared to CNY 2,090,150 million in August 2021.

Ethylene Carbonate Market

Opportunities abound in the LIB Segment

Ethylene carbonate is being increasingly used as an electrolyte in lithium-ion batteries. A modern lithium-ion battery (LIB) contains a graphite anode, a lithium metal oxide cathode, and an electrolyte solution doped with a lithium solution, such as lithium hexafluorophosphate, in a mixed organic solvent, which is often ethylene carbonate.

Li-ion battery demand has been boosted by the introduction of new and intriguing sectors with both commercial and industrial applications. The need for li-ion batteries from the data center and material handling industries has increased in recent years, particularly in emerging nations. According to EV Volumes data, the total sales of electric vehicles across the globe in 2021 was 6750 thousand units, which was a significant increase compared to 3240 thousand units in 2020.

Due to government regulations on fossil fuel engines, there has been a rapid expansion in electric vehicle demand, which significantly influences the demand for lithium batteries. The rising number of electronics, growing demand for mobiles, increasing energy-saving sources, and technological advancements in developed regions are driving the demand for batteries. These factors are expected to drive the ethylene carbonate market during the forecast period.

Growing demand for ethylene carbonate for various applications such as in the production of lubricants, plasticizers, and surface coatings is expected to bolster the market in the forthcoming years.

The ethylene carbonate market is projected to register year-on-year growth of 5.2% in 2022. Increasing consumption of ethylene carbonate as an electrolyte in lithium batteries owing to surging demand for electric vehicles & electronics is anticipated to propel sales of ethylene carbonate over the forecast period. Considering this, FMI has projected the market valuation to reach US$ 559.6 Million by 2032.

Nikhil Kaitwade
Nikhil Kaitwade

Principal Consultant

Talk to Analyst

Find your sweet spots for generating winning opportunities in this market.

2017 to 2021 Ethylene Carbonate Market Outlook Compared to 2022 to 2032 Forecast

The demand for ethylene carbonate grew at a 3.1% CAGR between 2017 and 2021. Due to its widespread use in a variety of applications, sales are projected to increase at a 6.2% CAGR over the assessment period.

Ethylene carbonate, also known as EC, is an organic compound. At room temperature, it is a transparent crystalline solid and soluble in water. It is a somewhat odorless and colorless compound.

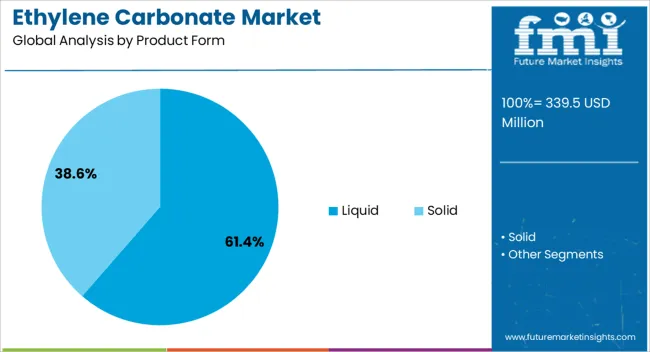
Ethylene carbonate has various applications in different end-use industries such as automotive, and oil & gas. Ethylene carbonate can be found in a solid state at room temperature. The solid form of ethylene carbonate is used as a solvent for lubricants and the production of superabsorbent polymers, intermediate in the synthesis of various products. In addition, it is used in plasticizers, medical products, and others.

What Are the Growth Opportunities for The Ethylene Carbonate Manufacturers?

Increasing concerns regarding global warming and the depletion of fossil fuels is encouraging manufacturers to invest in research and development. Various research processes are in progress to develop low-cost, highly efficient & eco-friendly alternatives. Lithium-ion batteries are quite famous for their properties, however, they are not sufficient for certain applications such as transport & power grid application. This opens new avenues to explore the potential of lithium-sulfur batteries.

Lithium-sulfur batteries' energy-storage capacity is driving up demand in the market. These batteries offer a tenfold increase in energy storage capacity over lithium-ion batteries. In lithium-sulfur batteries, ethylene carbonate serves as the electrolyte.

Lithium-sulfur batteries are considered promising next-generation electric vehicle batteries. This is due to the fact that, when compared to lithium-ion batteries, they have a sulfur cathode that is inexpensive and readily available, and have a low toxic effect on the environment. This is expected to boost the adoption of ethylene carbonate in lithium-sulfur batteries.

Get the data you need at a Fraction of the cost

Personalize your report by choosing insights you need
and save 40%!

Which Factors are Restraining the Growth in the Ethylene Carbonate Market?  

Ethylene is one of the key constituents and is considered a building block for many applications across various end-use industries. It is manufactured by using a variety of petrochemical-based feedstock. The availability and price of raw materials are important factors in determining the final product's cost structure. The majority of raw materials are crude oil-based derivatives that are sensitive to commodity price fluctuations. This causes volatility in ethylene carbonate raw material prices.

There are certain health issues related to the consumption of ethylene carbonate. It can cause serious eye damage and skin irritation when exposed. When ethylene carbonate is burned, it releases toxic levels of carbon dioxide, carbon monoxide, acids, ketones, and aldehydes. Such issues may hinder growth in the market.

Country-wise Insights

What Will Be the Demand Outlook of The India Ethylene Carbonate Market?

Expansion in the Paints & Coatings Sector in India Will Fuel Sales of Ethylene Carbonate

Ethylene carbonate is used in the production of lubricants, which is one of the important products in automotive and other industries. Lubricants are used for the smooth functioning of machines & engines. Growing end-use industries & automobile production in India are propelling the consumption of lubricants, which is expected to bolster the demand for ethylene carbonate over the forecast period.

The automotive industry in India is one of the largest contributors to the Indian economy. Indian automotive industry is expected to witness growth post-Covid era, especially in the electric vehicles segments. In addition to this, the presence of key automobile players and government initiatives is expected to bolster sales in the market.

The ethylene carbonate market in India is anticipated to expand at a CAGR of 6.8% during the forecast period.

What is Driving the China Ethylene Carbonate Market?

Growth in the Automotive Industry in China Will Spur Demand for Ethylene Carbonate

East Asia is expected to be the largest and fastest-growing market for ethylene carbonate. During the forecast period, China is expected to dominate the East Asia ethylene carbonate market.

Electric vehicles (EVs) are an essential element of the net-zero carbon future riddle, and the sector is expanding at a rapid pace. Countries and governments all over the world are recognizing the importance of zero-emission vehicles and are incorporating them into their decarbonization plans.

China is one of the leading countries in the electric vehicles market. The growing interest in electric vehicles and the usage of lithium batteries is expected to drive the ethylene carbonate market in the forthcoming years. The China ethylene carbonate market is anticipated to reach a valuation of US$ 127.3 Million by 2032.

Category-wise Insights

Which Factors Are Fueling Ethylene Carbonate Utilization in Lubricants Application?

Adoption of Ethylene Carbonate in the Production of Lubricants Will Fuel Growth

Lubricants are widely used in manufacturing and transportation industries to ensure the smooth operation of products. They are used in automobiles to clean and cool engines. They aid in the prevention of friction caused by metallic parts and protect engines from wear and tear. Lubricants also clear the debris and contaminants formed during the operation of the object.

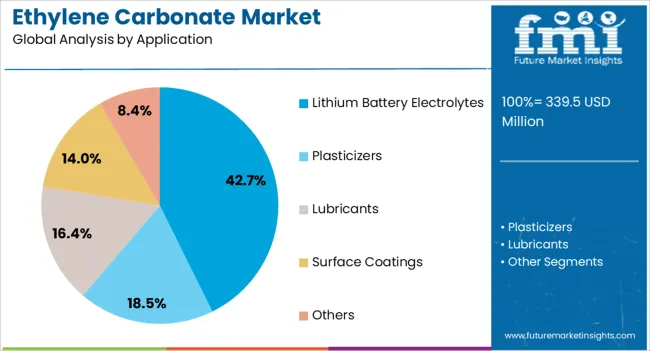
Ethylene carbonate is an important reactive intermediate in the production of lubricants and greases. Growing consumption in the industrial, automotive, and oil and gas sectors, where lubricants are widely used is expected to fuel sales in this segment. The lubricants segment is expected to expand at a CAGR of 6.5% during the forecast period.

Which is the Leading End Use Sector in the Ethylene Carbonate Market?

Demand for Ethylene Carbonate in the Automotive Sector Will Gain Momentum

The widespread use of lithium-ion batteries in electric vehicles is fueling the consumption of ethylene carbonate in lithium-ion battery electrolytes. One of the most reactive solvents relevant to lithium-ion batteries is ethylene carbonate (EC).

Li-ion battery or lithium-ion battery is a type of battery that can be recharged and is made by using a cell in which lithium ions travel from the negative to the positive electrode via a non-aqueous electrolyte.

Usually, ethylene carbonate is used as a non-aqueous electrolyte in lithium batteries. The Lithium battery electrolyte segment is expected to reach about US$ 156.0 Million during the forecast period.

Competitive Landscape

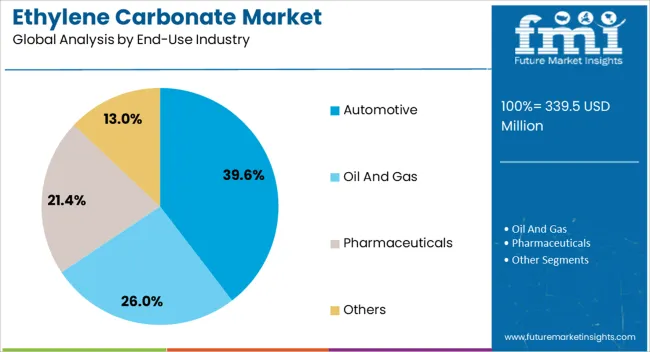
Key players are investing in product facility expansions to cater to the growing demand. Ethylene carbonate is in high demand across a wide range of end-use industries, including oil and gas, automotive, and many others. They are also investing in mergers, acquisitions, and collaboration to improve their global presence. For instance:

  • In February 2022, LOTTE Chemical announced large-scale investments at the Daesan Petrochemical Complex to boost its competitiveness in eco-friendly and specialty materials. At the Chungnam Provincial Hall, LOTTE Chemical signed an investment memorandum of understanding (MOU) for the construction and expansion of plants with Chungcheongnam-do and Seosan-si. Lotte intends to construct a plant to produce organic solvents for electrolytes - high-purity ethylene carbonate (EC) and dimethyl carbonate (DMC) - a key material in lithium-ion batteries.

Scope of Report

Attribute Details
Forecast Period 2022 to 2032
Historical Data Available for 2017 to 2021
Market Analysis US$ Million for Value and Tons for Volume
Key Countries Covered The USA, Canada, Brazil, Mexico, Germany, Italy, France, the UK, Spain, BENELUX, Russia, China, Japan, South Korea, India, ASEAN, Australia and New Zealand, GCC Countries, Turkey, South Africa
Key Segments Covered Product Form, Application, End-Use Industry & Region
Key Companies Profiled
  • Oriental Union Chemical Corporation
  • Huntsman Corporation
  • BASF SE
  • Mitsubishi Chemical Corporation
  • Toagosei Co., Ltd.
  • Asahi Kasei
  • Prasol Chemicals Ltd
  • Shandong Shida Shenghua Chemical Group
  • Shandong Senjie Chemical
  • Dubi Chem
  • Alfa Aesar
Report Coverage Market Forecast, Company Share Analysis, Competition Intelligence, Drivers, Restraints, Opportunities and Threats Analysis, Market Dynamics and Challenges, and Strategic Growth Initiatives

Ethylene Carbonate Market by Category

By Product Form:

  • Solid
  • Liquid

By Application:

  • Lithium Battery Electrolyte
  • Plasticizers
  • Lubricants
  • Surface Coatings
  • Others

By End-Use Industry:

  • Oil & Gas
  • Automotive
  • Pharmaceuticals
  • Others

By Region:

  • North America
  • Latin America
  • Europe
  • East Asia
  • South Asia & Pacific
  • Middle East & Africa

Frequently Asked Questions

What is the current global ethylene carbonate market value?

The global ethylene carbonate market is anticipated to reach a valuation of US$ 306.5 Million in 2022.

What is the demand outlook for ethylene carbonate?

The global ethylene carbonate market is anticipated to witness a growth rate of 6.2% over the forecast period of 2022 and 2032 in terms of value.

At what rate did the global ethylene carbonate market grow between 2017 and 2021?

The global ethylene carbonate market witnessed a growth at a 3.1% CAGR between 2017 and 2021.

Who are the leading players in the global ethylene carbonate market?

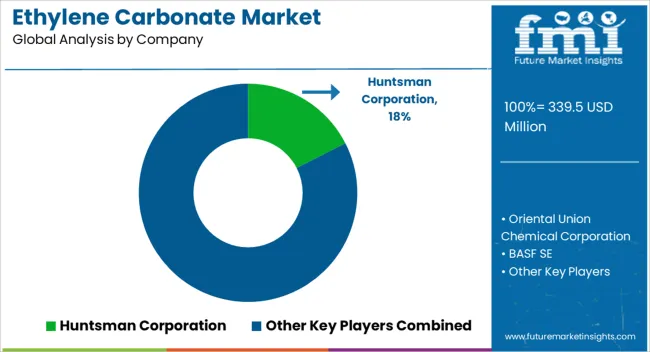
Oriental Union Chemical Corporation, Huntsman Corporation, BASF SE, Mitsubishi Chemical Corporation, Toagosei Co., Ltd., Asahi Kasei, Empower Materials, Prasol Chemicals Ltd, Shandong Shida Shenghua Chemical Group, Shandong Senjie Chemical, and Alfa Aesar are the key players in the global ethylene carbonate market.

What is the market share of leading players in the global ethylene carbonate market?

Key players in the global ethylene carbonate market are expected to hold around 65-70% of the global market.

Which are the top countries driving the global ethylene carbonate market demand?

The top countries driving the ethylene carbonate demand are China, the USA, and India.

Table of Content

1. Executive Summary | Ethylene Carbonate Market

    1.1. Global Market Outlook

    1.2. Demand Side Trends

    1.3. Supply Side Trends

    1.4. Analysis and Recommendations

2. Market Overview

    2.1. Market Coverage / Taxonomy

    2.2. Market Definition / Scope / Limitations

3. Key Market Trends

    3.1. Key Trends Impacting the Market

    3.2. Innovation / Development Trends

4. Key Success Factors

    4.1. Product Adoption / Usage Analysis

    4.2. Product Innovation & Diversification

    4.3. Marketing and Brand Management

    4.4. Supply Chain Management

5. Global Market Demand Analysis 2017 to 2021 and Forecast, 2022 to 2032

    5.1. Historical Market Volume (Tons) Analysis, 2017 to 2021

    5.2. Current and Future Market Volume (Tons) Projections, 2022 to 2032

    5.3. Y-o-Y Growth Trend Analysis

6. Global Market - Pricing Analysis

    6.1. Regional Pricing Analysis

    6.2. Pricing Analysis by Regions

7. Global Market Demand (in Value or Size in US$ Million) Analysis 2017 to 2021 and Forecast, 2022 to 2032

    7.1. Historical Market Value (US$ Million) Analysis, 2017 to 2021

    7.2. Current and Future Market Value (US$ Million) Projections, 2022 to 2032

        7.2.1. Y-o-Y Growth Trend Analysis

        7.2.2. Absolute $ Opportunity Analysis

8. Market Background

    8.1. Macro-Economic Factors

    8.2. Forecast Factors - Relevance & Impact

    8.3. Supply-Demand Analysis

    8.4. Value Chain

    8.5. Market Dynamics

    8.6. Impact of COVID-19 Crisis

9. Global Market Analysis 2017 to 2021 and Forecast 2022 to 2032, by Product Form

    9.1. Introduction / Key Findings

    9.2. Historical Market Size (US$ Million) and Volume Analysis By Product Form, 2017 to 2021

    9.3. Current and Future Market Size (US$ Million) and Volume Analysis and Forecast By Product Form, 2022 to 2032

        9.3.1. Solid

        9.3.2. Liquid

    9.4. Market Attractiveness Analyses, By Product Form

10. Global Market Analysis 2017 to 2021 and Forecast 2022 to 2032, By Application

    10.1. Introduction / Key Findings

    10.2. Historical Market Size (US$ Million) and Volume Analysis By Application, 2017 to 2021

    10.3. Current and Future Market Size (US$ Million) and Volume Analysis and Forecast By Application, 2022 to 2032

        10.3.1. Lithium Battery Electrolyte

        10.3.2. Plasticizers

        10.3.3. Lubricants

        10.3.4. Surface Coatings

        10.3.5. Others

    10.4. Market Attractiveness Analysis By Application

11. Global Market Analysis 2017 to 2021 and Forecast 2022 to 2032, by End-Use Industry

    11.1. Introduction

    11.2. Historical Market Size (US$ Million) and Volume Analysis By End Use Industry, 2017 to 2021

    11.3. Current Market Size (US$ Million) and Volume Analysis and Forecast By End Use Industry, 2022 to 2032

        11.3.1. Oil & Gas

        11.3.2. Automotive

        11.3.3. Pharmaceuticals

        11.3.4. Others

    11.4. Market Attractiveness Analysis By End Use Industry

12. Global Market Analysis 2017 to 2021 and Forecast 2022 to 2032, by Region

    12.1. Introduction

    12.2. Historical Market Size (US$ Million) and Volume Analysis By Region, 2017 to 2021

    12.3. Current Market Size (US$ Million) and Volume Analysis and Forecast By Region, 2022 to 2032

        12.3.1. North America

        12.3.2. Latin America

        12.3.3. Europe

        12.3.4. East Asia

        12.3.5. South Asia & Pacific

        12.3.6. Middle East & Africa

    12.4. Market Attractiveness Analysis By Region

13. North America Market Analysis 2017 to 2021 and Forecast 2022 to 2032

    13.1. Introduction

    13.2. Pricing Analysis

    13.3. Historical Market Size (US$ Million) and Volume Trend Analysis By Market Taxonomy, 2017 to 2021

    13.4. Market Size (US$ Million) and Volume Forecast By Market Taxonomy, 2022 to 2032

        13.4.1. By Product Form

        13.4.2. By Application

        13.4.3. By End Use Industry

        13.4.4. By Country

            13.4.4.1. United States of America

            13.4.4.2. Canada

    13.5. Market Attractiveness Analysis

        13.5.1. By Product Form

        13.5.2. By Application

        13.5.3. By End Use Industry

        13.5.4. By Country

    13.6. Market Trends

    13.7. Drivers and Restraints Impact Analysis

14. Latin America Market Analysis 2017 to 2021 and Forecast 2022 to 2032

    14.1. Introduction

    14.2. Pricing Analysis

    14.3. Historical Market Size (US$ Million) and Volume Trend Analysis By Market Taxonomy, 2017 to 2021

    14.4. Market Size (US$ Million) and Volume Forecast By Market Taxonomy, 2022 to 2032

        14.4.1. By Product Form

        14.4.2. By Application

        14.4.3. By End Use Industry

        14.4.4. By Country

            14.4.4.1. Brazil

            14.4.4.2. Mexico

            14.4.4.3. Rest of Latin America

    14.5. Market Attractiveness Analysis

        14.5.1. By Product Form

        14.5.2. By Application

        14.5.3. By End Use Industry

        14.5.4. By Country

    14.6. Market Trends

    14.7. Drivers and Restraints Impact Analysis

15. Europe Market Analysis 2017 to 2021 and Forecast 2022 to 2032

    15.1. Introduction

    15.2. Pricing Analysis

    15.3. Historical Market Size (US$ Million) and Volume Trend Analysis By Market Taxonomy, 2017 to 2021

    15.4. Market Size (US$ Million) and Volume Forecast By Market Taxonomy, 2022 to 2032

        15.4.1. By Product Form

        15.4.2. By Application

        15.4.3. By End Use Industry

        15.4.4. By Country

            15.4.4.1. Germany

            15.4.4.2. Italy

            15.4.4.3. France

            15.4.4.4. United Kingdom

            15.4.4.5. Spain

            15.4.4.6. BENELUX

            15.4.4.7. Russia

            15.4.4.8. Rest of Europe

    15.5. Market Attractiveness Analysis

        15.5.1. By Product Form

        15.5.2. By Application

        15.5.3. By End Use Industry

        15.5.4. By Country

    15.6. Market Trends

    15.7. Drivers and Restraints Impact Analysis

16. East Asia Market Analysis 2017 to 2021 and Forecast 2022 to 2032

    16.1. Introduction

    16.2. Pricing Analysis

    16.3. Historical Market Size (US$ Million) and Volume Trend Analysis By Market Taxonomy, 2017 to 2021

    16.4. Market Size (US$ Million) and Volume Forecast By Market Taxonomy, 2022 to 2032

        16.4.1. By Product Form

        16.4.2. By Application

        16.4.3. By End Use Industry

        16.4.4. By Country

            16.4.4.1. China

            16.4.4.2. Japan

            16.4.4.3. South Korea

    16.5. Market Attractiveness Analysis

        16.5.1. By Product Form

        16.5.2. By Application

        16.5.3. By End Use Industry

        16.5.4. By Country

    16.6. Market Trends

    16.7. Drivers and Restraints Impact Analysis

17. South Asia & Pacific Market Analysis 2017 to 2021 and Forecast 2022 to 2032

    17.1. Introduction

    17.2. Pricing Analysis

    17.3. Historical Market Size (US$ Million) and Volume Trend Analysis By Market Taxonomy, 2017 to 2021

    17.4. Market Size (US$ Million) and Volume Forecast By Market Taxonomy, 2022 to 2032

        17.4.1. By Product Form

        17.4.2. By Application

        17.4.3. By End Use Industry

        17.4.4. By Country

            17.4.4.1. India

            17.4.4.2. ASEAN

            17.4.4.3. Australia and New Zealand

            17.4.4.4. Rest of South Asia & Pacific

    17.5. Market Attractiveness Analysis

        17.5.1. By Product Form

        17.5.2. By Application

        17.5.3. By End Use Industry

        17.5.4. By Country

    17.6. Market Trends

    17.7. Drivers and Restraints Impact Analysis

18. Middle East and Africa Market Analysis 2017 to 2021 and Forecast 2022 to 2032

    18.1. Introduction

    18.2. Pricing Analysis

    18.3. Historical Market Size (US$ Million) and Volume Trend Analysis By Market Taxonomy, 2017 to 2021

    18.4. Market Size (US$ Million) and Volume Forecast By Market Taxonomy, 2022 to 2032

        18.4.1. By Product Form

        18.4.2. By Application

        18.4.3. By End Use Industry

        18.4.4. By Country

            18.4.4.1. GCC Countries

            18.4.4.2. Turkey

            18.4.4.3. South Africa

            18.4.4.4. Rest of Middle East and Africa

    18.5. Market Attractiveness Analysis

        18.5.1. By Product Form

        18.5.2. By Application

        18.5.3. By End Use Industry

        18.5.4. By Country

    18.6. Market Trends

    18.7. Drivers and Restraints Impact Analysis

19. Key and Emerging Countries Market Analysis

    19.1. USA Market Analysis

        19.1.1. By Product Form

        19.1.2. By Application

        19.1.3. By End Use Industry

    19.2. Canada Market Analysis

        19.2.1. By Product Form

        19.2.2. By Application

        19.2.3. By End Use Industry

    19.3. Mexico Market Analysis

        19.3.1. By Product Form

        19.3.2. By Application

        19.3.3. By End Use Industry

    19.4. Brazil Market Analysis

        19.4.1. By Product Form

        19.4.2. By Application

        19.4.3. By End Use Industry

    19.5. Germany Market Analysis

        19.5.1. By Product Form

        19.5.2. By Application

        19.5.3. By End Use Industry

    19.6. Italy Market Analysis

        19.6.1. By Product Form

        19.6.2. By Application

        19.6.3. By End Use Industry

    19.7. France Market Analysis

        19.7.1. By Product Form

        19.7.2. By Application

        19.7.3. By End Use Industry

    19.8. UK Market Analysis

        19.8.1. By Product Form

        19.8.2. By Application

        19.8.3. By End Use Industry

    19.9. Spain Market Analysis

        19.9.1. By Product Form

        19.9.2. By Application

        19.9.3. By End Use Industry

    19.10. Russia Market Analysis

        19.10.1. By Product Form

        19.10.2. By Application

        19.10.3. By End Use Industry

    19.11. BENELUX Market Analysis

        19.11.1. By Product Form

        19.11.2. By Application

        19.11.3. By End Use Industry

    19.12. China Market Analysis

        19.12.1. By Product Form

        19.12.2. By Application

        19.12.3. By End Use Industry

    19.13. Japan Market Analysis

        19.13.1. By Product Form

        19.13.2. By Application

        19.13.3. By End Use Industry

    19.14. S. Korea Market Analysis

        19.14.1. By Product Form

        19.14.2. By Application

        19.14.3. By End Use Industry

    19.15. India Market Analysis

        19.15.1. By Product Form

        19.15.2. By Application

        19.15.3. By End Use Industry

    19.16. ASEAN Market Analysis

        19.16.1. By Product Form

        19.16.2. By Application

        19.16.3. By End Use Industry

    19.17. GCC Countries Market Analysis

        19.17.1. By Product Form

        19.17.2. By Application

        19.17.3. By End Use Industry

    19.18. Turkey Market Analysis

        19.18.1. By Product Form

        19.18.2. By Application

        19.18.3. By End Use Industry

    19.19. South Africa Market Analysis

        19.19.1. By Product Form

        19.19.2. By Application

        19.19.3. By End Use Industry

20. Market Structure Analysis

    20.1. Market Analysis by Tier of Companies [Ethylene Carbonate]

    20.2. Market Concentration

    20.3. Market Share Analysis of Top Players

    20.4. Production Capacity Estimates of Top Players

    20.5. Market Presence Analysis

21. Competition Analysis

    21.1. Competition Dashboard

    21.2. Primary Survey Analysis

    21.3. Competition Deep Dive

        21.3.1. Huntsman Corporation

            21.3.1.1. Overview

            21.3.1.2. Product Portfolio

            21.3.1.3. Key Financials

            21.3.1.4. Sales Footprint

            21.3.1.5. Strategy Overview

        21.3.2. Oriental Union Chemical Corp.

            21.3.2.1. Overview

            21.3.2.2. Product Portfolio

            21.3.2.3. Key Financials

            21.3.2.4. Sales Footprint

            21.3.2.5. Strategy Overview

        21.3.3. BASF SE

            21.3.3.1. Overview

            21.3.3.2. Product Portfolio

            21.3.3.3. Key Financials

            21.3.3.4. Sales Footprint

            21.3.3.5. Strategy Overview

        21.3.4. Mitsubishi Chemical Corporation

            21.3.4.1. Overview

            21.3.4.2. Product Portfolio

            21.3.4.3. Key Financials

            21.3.4.4. Sales Footprint

            21.3.4.5. Strategy Overview

        21.3.5. Toagosei Co., Ltd.

            21.3.5.1. Overview

            21.3.5.2. Product Portfolio

            21.3.5.3. Key Financials

            21.3.5.4. Sales Footprint

            21.3.5.5. Strategy Overview

        21.3.6. Asahi Kasei

            21.3.6.1. Overview

            21.3.6.2. Product Portfolio

            21.3.6.3. Key Financials

            21.3.6.4. Sales Footprint

            21.3.6.5. Strategy Overview

        21.3.7. Empower Materials

            21.3.7.1. Overview

            21.3.7.2. Product Portfolio

            21.3.7.3. Key Financials

            21.3.7.4. Sales Footprint

            21.3.7.5. Strategy Overview

        21.3.8. Shandong Shinda Shenghua Chemical Group

            21.3.8.1. Overview

            21.3.8.2. Product Portfolio

            21.3.8.3. Key Financials

            21.3.8.4. Sales Footprint

            21.3.8.5. Strategy Overview

        21.3.9. Shandong Senjie Chemical Co, Ltd.

            21.3.9.1. Overview

            21.3.9.2. Product Portfolio

            21.3.9.3. Key Financials

            21.3.9.4. Sales Footprint

            21.3.9.5. Strategy Overview

        21.3.10. Prasol Chemicals Ltd.

            21.3.10.1. Overview

            21.3.10.2. Product Portfolio

            21.3.10.3. Key Financials

            21.3.10.4. Sales Footprint

            21.3.10.5. Strategy Overview

        21.3.11. Alfa Aesar

            21.3.11.1. Overview

            21.3.11.2. Product Portfolio

            21.3.11.3. Key Financials

            21.3.11.4. Sales Footprint

            21.3.11.5. Strategy Overview

        21.3.12. Vizag Chemicals

            21.3.12.1. Overview

            21.3.12.2. Product Portfolio

            21.3.12.3. Key Financials

            21.3.12.4. Sales Footprint

            21.3.12.5. Strategy Overview

        21.3.13. FUJIFIM Wako Chemicals Europe GmbH

            21.3.13.1. Overview

            21.3.13.2. Product Portfolio

            21.3.13.3. Key Financials

            21.3.13.4. Sales Footprint

            21.3.13.5. Strategy Overview

        21.3.14. National Analytical Corporation

            21.3.14.1. Overview

            21.3.14.2. Product Portfolio

            21.3.14.3. Key Financials

            21.3.14.4. Sales Footprint

            21.3.14.5. Strategy Overview

        21.3.15. Dubi Chem

            21.3.15.1. Overview

            21.3.15.2. Product Portfolio

            21.3.15.3. Key Financials

            21.3.15.4. Sales Footprint

            21.3.15.5. Strategy Overview

22. Assumptions and Acronyms Used

23. Research Methodology

Don't pay for what you don't need

Customize your report by selecting specific countries or regions and save 30%!

List of Tables

Table 01: Global Volume (Tons) and Value (US$ Million) Forecast by Product Form, 2017 to 2032

Table 02: Global Volume (Tons) and Value (US$ Million) Forecast by Application, 2017 to 2032

Table 03: Global Volume (Tons) and Value (US$ Million) Forecast by End Use Industry, 2017 to 2032

Table 04: Global Market Size (US$ Million) and Volume (Tons) Forecast by Region, 2017 to 2032

Table 05: North America Market Size (US$ Million) and Volume (Tons) Forecast by Country, 2017 to 2032

Table 06: North America Volume (Tons) and Value (US$ Million) Forecast by Product Form, 2017 to 2032

Table 07: North America Volume (Tons) and Value (US$ Million) Forecast by Application, 2017 to 2032

Table 08: North America Volume (Tons) and Value (US$ Million) Forecast by End Use Industry, 2017 to 2032

Table 09: Latin America Market Size (US$ Million) and Volume (Tons) Forecast by Country, 2017 to 2032

Table 10: Latin America Volume (Tons) and Value (US$ Million) Forecast by Product Form, 2017 to 2032

Table 11: Latin America Volume (Tons) and Value (US$ Million) Forecast by Application, 2017 to 2032

Table 12: Latin America Volume (Tons) and Value (US$ Million) Forecast by End Use Industry, 2017 to 2032

Table 13: Europe Market Size (US$ Million) and Volume (Tons) Forecast by Country, 2017 to 2032

Table 14: Europe Volume (Tons) and Value (US$ Million) Forecast by Product Form, 2017 to 2032

Table 15: Europe Volume (Tons) and Value (US$ Million) Forecast by Application, 2017 to 2032

Table 16: Europe Volume (Tons) and Value (US$ Million) Forecast by End Use Industry, 2017 to 2032

Table 17: East Asia Market Size (US$ Million) and Volume (Tons) Forecast by Country, 2017 to 2032

Table 18: East Asia Volume (Tons) and Value (US$ Million) Forecast by Product Form, 2017 to 2032

Table 19: East Asia Volume (Tons) and Value (US$ Million) Forecast by Application, 2017 to 2032

Table 20: East Asia Volume (Tons) and Value (US$ Million) Forecast by End Use Industry, 2017 to 2032

Table 21: South Asia Pacific Market Size (US$ Million) and Volume (Tons) Forecast by Country, 2017 to 2032

Table 22: SAP Volume (Tons) and Value (US$ Million) Forecast by Product Form, 2017 to 2032

Table 23: SAP Volume (Tons) and Value (US$ Million) Forecast by Application, 2017 to 2032

Table 24: SAP Volume (Tons) and Value (US$ Million) Forecast by End Use Industry, 2017 to 2032

Table 25: MEA Market Size (US$ Million) and Volume (Tons) Forecast by Country, 2017 to 2032

Table 26: MEA Volume (Tons) and Value (US$ Million) Forecast by Product Form, 2017 to 2032

Table 27: MEA Volume (Tons) and Value (US$ Million) Forecast by Application, 2017 to 2032

Table 28: MEA Volume (Tons) and Value (US$ Million) Forecast by End Use Industry, 2017 to 2032
Nikhil Kaitwade
Nikhil Kaitwade

Principal Consultant

Talk to Analyst

Find your sweet spots for generating winning opportunities in this market.

List of Charts

Figure 01: Global Historical Market Volume (Tons) Analysis, 2017 to 2021

Figure 02: Global Current and Future Market Volume (Tons) Analysis, 2022 to 2032

Figure 03: Global Historical Value (US$ Million), 2017 to 2021

Figure 04: Global Value (US$ Million) Forecast, 2022 to 2032

Figure 05: Global Market Value 2022 to 2032 and Y-O-Y (US$ Million)

Figure 06: Global Market Share and BPS Analysis by Product Form, 2022 & 2032

Figure 07: Global Market Y-o-Y Growth by Product Form, 2022 to 2032

Figure 08: Global Market Attractiveness Analysis Product Form, 2022 to 2032

Figure 09: Global Market Absolute $ Opportunity by Solid Segment, 2017 to 2032

Figure 10: Global Market Absolute $ Opportunity by Liquid Segment, 2017 to 2032

Figure 11: Global Market Share and BPS Analysis by Application, 2022 & 2032

Figure 12: Global Market Y-o-Y Growth by Application, 2022 to 2032

Figure 13: Global Market Attractiveness Analysis Application, 2022 to 2032

Figure 14: Global Market Absolute $ Opportunity by Lithium Battery Electrolyte Segment, 2017 to 2032

Figure 15: Global Market Absolute $ Opportunity by Plasticizers Segment, 2017 to 2032

Figure 16: Global Market Absolute $ Opportunity by Lubricants Segment, 2017 to 2032

Figure 17: Global Market Absolute $ Opportunity by Surface Coatings Segment, 2017 to 2032

Figure 18: Global Market Absolute $ Opportunity by Others Segment, 2017 to 2032

Figure 19: Global Market Share and BPS Analysis by End Use Industry, 2022 & 2032

Figure 20: Global Market Y-o-Y Growth by End Use Industry, 2022 to 2032

Figure 21: Global Market Attractiveness Analysis End Use Industry, 2022 to 2032

Figure 22: Global Market Absolute $ Opportunity by Oil & Gas Segment, 2017 to 2032

Figure 23: Global Market Absolute $ Opportunity by Automotive Segment, 2017 to 2032

Figure 24: Global Market Absolute $ Opportunity by Pharmaceuticals Segment, 2017 to 2032

Figure 25: Global Market Absolute $ Opportunity by Others Segment, 2017 to 2032

Figure 26: Global Market Share and BPS Analysis by Region, 2022 & 2032

Figure 27: Global Market Y-o-Y Growth by Region, 2022 to 2032

Figure 28: Global Market Attractiveness Analysis Region, 2022 to 2032

Figure 29: Global Market Absolute $ Opportunity by North America Segment, 2017 to 2032

Figure 30: Global Market Absolute $ Opportunity by Latin America Segment, 2017 to 2032

Figure 31: Global Market Absolute $ Opportunity by Europe Segment, 2017 to 2032

Figure 32: Global Market Absolute $ Opportunity by East Asia Segment, 2017 to 2032

Figure 33: Global Market Absolute $ Opportunity by South Asia Pacific Segment, 2017 to 2032

Figure 34: Global Market Absolute $ Opportunity by MEA Segment, 2017 to 2032

Figure 35: North America Market Share and BPS Analysis by Country, 2022 & 2032

Figure 36: North America Market Y-o-Y Growth by Country, 2022 to 2032

Figure 37: North America Market Attractiveness Analysis Country, 2022 to 2032

Figure 38: North America Market Share and BPS Analysis by Product Form, 2022 & 2032

Figure 39: North America Market Y-o-Y Growth by Product Form, 2022 to 2032

Figure 40: North America Market Attractiveness Analysis Product Form, 2022 to 2032

Figure 41: North America Market Share and BPS Analysis by Application, 2022 & 2032

Figure 42: North America Market Y-o-Y Growth by Application, 2022 to 2032

Figure 43: North America Market Attractiveness Analysis Application, 2022 to 2032

Figure 44: North America Market Share and BPS Analysis by End Use Industry, 2022 & 2032

Figure 45: North America Market Y-o-Y Growth by End Use Industry, 2022 to 2032

Figure 46: North America Market Attractiveness Analysis End Use Industry, 2022 to 2032

Figure 47: Latin America Market Share and BPS Analysis by Country, 2022 & 2032

Figure 48: Latin America Market Y-o-Y Growth by Country, 2022 to 2032

Figure 49: Latin America Market Attractiveness Analysis Country, 2022 to 2032

Figure 50: Latin America Market Share and BPS Analysis by Product Form, 2022 & 2032

Figure 51: Latin America Market Y-o-Y Growth by Product Form, 2022 to 2032

Figure 52: Latin America Market Attractiveness Analysis Product Form, 2022 to 2032

Figure 53: Latin America Market Share and BPS Analysis by Application, 2022 & 2032

Figure 54: Latin America Market Y-o-Y Growth by Application, 2022 to 2032

Figure 55: Latin America Market Attractiveness Analysis Application, 2022 to 2032

Figure 56: Latin America Market Share and BPS Analysis by End Use Industry, 2022 & 2032

Figure 57: Latin America Market Y-o-Y Growth by End Use Industry, 2022 to 2032

Figure 58: Latin America Market Attractiveness Analysis End Use Industry, 2022 to 2032

Figure 59: Europe Market Share and BPS Analysis by Country, 2022 & 2032

Figure 60: Europe Market Y-o-Y Growth by Country, 2022 to 2032

Figure 61: Europe Market Attractiveness Analysis Country, 2022 to 2032

Figure 62: Europe Market Share and BPS Analysis by Product Form, 2022 & 2032

Figure 63: Europe Market Y-o-Y Growth by Product Form, 2022 to 2032

Figure 64: Europe Market Attractiveness Analysis Product Form, 2022 to 2032

Figure 65: Europe Market Share and BPS Analysis by Application, 2022 & 2032

Figure 66: Europe Market Y-o-Y Growth by Application, 2022 to 2032

Figure 67: Europe Market Attractiveness Analysis Application, 2022 to 2032

Figure 68: Europe Market Share and BPS Analysis by End Use Industry, 2022 & 2032

Figure 69: Europe Market Y-o-Y Growth by End Use Industry, 2022 to 2032

Figure 70: Europe Market Attractiveness Analysis End Use Industry, 2022 to 2032

Figure 71: East Asia Market Share and BPS Analysis by Country, 2022 & 2032

Figure 72: East Asia Market Y-o-Y Growth by Country, 2022 to 2032

Figure 73: East Asia Market Attractiveness Analysis Country, 2022 to 2032

Figure 74: East Asia Market Share and BPS Analysis by Product Form, 2022 & 2032

Figure 75: East Asia Market Y-o-Y Growth by Product Form, 2022 to 2032

Figure 76: East Asia Market Attractiveness Analysis Product Form, 2022 to 2032

Figure 77: East Asia Market Share and BPS Analysis by Application, 2022 & 2032

Figure 78: East Asia Market Y-o-Y Growth by Application, 2022 to 2032

Figure 79: East Asia Market Attractiveness Analysis Application, 2022 to 2032

Figure 80: East Asia Market Share and BPS Analysis by End Use Industry, 2022 & 2032

Figure 81: East Asia Market Y-o-Y Growth by End Use Industry, 2022 to 2032

Figure 82: East Asia Market Attractiveness Analysis End Use Industry, 2022 to 2032

Figure 83: South Asia Pacific Market Share and BPS Analysis by Country, 2022 & 2032

Figure 84: South Asia Pacific Market Y-o-Y Growth by Country, 2022 to 2032

Figure 85: South Asia Pacific Market Attractiveness Analysis Country, 2022 to 2032

Figure 86: SAP Market Share and BPS Analysis by Product Form, 2022 & 2032

Figure 87: SAP Market Y-o-Y Growth by Product Form, 2022 to 2032

Figure 88: SAP Market Attractiveness Analysis Product Form, 2022 to 2032

Figure 89: SAP Market Share and BPS Analysis by Application, 2022 & 2032

Figure 90: SAP Market Y-o-Y Growth by Application, 2022 to 2032

Figure 91: SAP Market Attractiveness Analysis Application, 2022 to 2032

Figure 92: SAP Market Share and BPS Analysis by End Use Industry, 2022 & 2032

Figure 93: SAP Market Y-o-Y Growth by End Use Industry, 2022 to 2032

Figure 94: SAP Market Attractiveness Analysis End Use Industry, 2022 to 2032

Figure 95: MEA Market Share and BPS Analysis by Country, 2022 & 2032

Figure 96: MEA Market Y-o-Y Growth by Country, 2022 to 2032

Figure 97: MEA Market Attractiveness Analysis Country, 2022 to 2032

Figure 98: MEA Market Share and BPS Analysis by Product Form, 2022 & 2032

Figure 99: MEA Market Y-o-Y Growth by Product Form, 2022 to 2032

Figure 100: MEA Market Attractiveness Analysis Product Form, 2022 to 2032

Figure 101: MEA Market Share and BPS Analysis by Application, 2022 & 2032

Figure 102: MEA Market Y-o-Y Growth by Application, 2022 to 2032

Figure 103: MEA Market Attractiveness Analysis Application, 2022 to 2032

Figure 104: MEA Market Share and BPS Analysis by End Use Industry, 2022 & 2032

Figure 105: MEA Market Y-o-Y Growth by End Use Industry, 2022 to 2032

Figure 106: MEA Market Attractiveness Analysis End Use Industry, 2022 to 2032

Recommendations

Chemicals & Materials

Dimethyl Carbonate Market

Published : October 2022

Chemicals & Materials

Magnesium Carbonate Market

Published : July 2022

Chemicals & Materials

Calcium Carbonate Market

Published : June 2022

Explore Chemicals & Materials Insights

View Reports

Ethylene Carbonate Market