Sodium Bicarbonate Market
Market Insights on Sodium Bicarbonate covering sales outlook, demand forecast & up-to-date key trends
Sodium Bicarbonate Market by Grade Type (Pharmaceutical Grade, Technical Grade, Food Grade, Feed Grade), Form (Powder, Pellets, Slurry, Liquid), End Use & Region - Forecast to 2021 - 2031
Key Points Covered
- Market estimates and forecast 2015-2031
- Key drivers and restraints impacting market growth
- Segment-wise, Country-wise, and Region-wise Analysis
- Competition Mapping and Benchmarking
- Brand share and Market Share Analysis
- Key Product Innovations and Regulatory Climate
- COVID-19 Impact on Sodium Bicarbonate and How to Navigate
- Recommendation on Key Winning Strategies
Let us know your requirement to get
100% FREE customization
2016-2020 Sodium Bicarbonate Market Outlook Compared to 2021-2031 Forecast
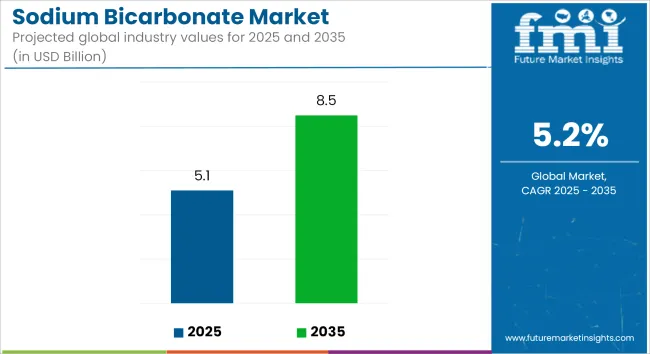
The global sodium bicarbonate market is anticipated to grow at rate of 3.9% CAGR during the forecast period across end use industries. Increased consumption of sodium bicarbonate in varying end use industries including food, animal feed, pharmaceuticals, chemicals, and water treatment is the driving factor for the rise in the global market.
Increasing application of food and technical grades of sodium bicarbonate is expected to further bolster developments. Characteristics of high basicity and non-toxic nature, creates unique advantages for applications in leavening, cleansing, and ruminal pH buffers.
The material is commonly used as a leavening agent in the baking process for cakes, biscuits, and bread in the form of baking powder. It is also used as a cleansing agent due to its mild disinfectant properties. Also, niche applications in animal feed, the production of fire extinguishers, and more contribute to revenues.
It also has extensive use in the pharmaceutical industry, as an antacid to treat indigestion and heartburn, in the treatment of hyperkalemia, and also as a hemodialysis solution for treating chronic kidney diseases.
Key players in the market are focusing on increasing productivity, via digital technology and integrated processes. Many prominent players are seeking strategic expansions and are also focusing on delivering high-quality end-use products to sustain their market share in the long run.
Due to the Covid-19 pandemic, a notable impact was witnessed on the supply chain for sodium bicarbonate, disrupting raw material transport due to the strict lockdowns prevalent in many parts of the world. This in turn drove key players to find new ways to implement innovative value chain initiatives to achieve uninterrupted production. The growth of the Sodium Bicarbonate market is also anticipated to be affected by this pandemic crisis and is also expected to see a considerable drop in the fiscal prospects of 2020-2021.
What is the Regulatory Impact on Global Sales?
Sodium bicarbonate is often used by the operators of smaller-scale, waste-to-energy (WTE) facilities as an adsorbent in commercial flue gas treatment (FGT) applications. Polymers and chemicals are often purified, processed, and synthesized using sodium bicarbonate.
Furthermore, sodium bicarbonate has moderate abrasive, grease-cutting, cleaning and odor-neutralizing properties. Due to its alkaline composition and favourable reactivity properties, it is expected to boost the market demand for the chemical compound in the forecast period.
On the other hand, strict regulations and certifications required for the production and distribution of pharmaceutical grade sodium bicarbonate is expected to hold back growth prospects through the projection period.
For the production of pharmaceutical grade substances, manufacturers must also receive approvals including GMP (Good Industrial Practice) certifications. Furthermore, factors such as purity, and grain size are very strictly monitored to minimize unwanted reactions through the surface chemistry of drugs.
Find your sweet spots for generating winning opportunities in this market.
Talk to AnalystWhere are the Major Sales Opportunities in the Sodium Bicarbonate Market?
According to FMI, various market players are engaged in increasing production capacities in addition to investing in the development of high-quality variants of sodium bicarbonate. In the global market for sodium bicarbonate, new materials are being developed to meet market demand for high quality food and pharmaceutical grade sodium bicarbonate.
Opportunities for sodium bicarbonate producers ought to increase owing to the expansion of operations in end-use industries including food and beverage, pharmaceutical industry and chemical industries.
Country-wise Insights
What is the Share of China in the Sodium Bicarbonate Market?
Due to the presence of numerous manufacturers and end-use industries in China, substantial growth has been witnessed in this regional sodium bicarbonate market. China is projected to account for more than US$ 500 Mn by the end of the forecast period.
The role of China as a manufacturing and services hub will drive demand from various end-users. China is anticipated to consume approximately three-fourths of the overall East Asian inventory of sodium bicarbonate. Low labor and raw material costs are some of the primary factors supporting the dominance of the country.
How is the Market Set to Fare in Germany?
Germany accounts for over 21% of the European market for sodium bicarbonate. This is likely to continue through the end of 2031. The demand for sodium bicarbonate in Germany is anticipated to witness considerable growth, due to the presence of several end-use industries including fire extinguisher production, flue gas desulfurization, food processing, pharmaceutical development, and personal care and cosmetics production.
The German market is trailed by France and the U.K., which are other major markets in Europe. Favorable manufacturing activities create a conducive environment for adoption. However, U.K. is likely to face challenges arising from trade restrictions following Brexit.
Will the U.S. Play a Larger Role in the Sodium Bicarbonate Market?
The U.S. accounts for more than 80% of the North American market, which in turn accounts for 20% of the global market share. Primarily, the demand for sodium bicarbonate in North America can be attributed to demand arising from the massive food and beverage, and pharmaceutical industries.
Moreover, pharmaceuticals and personal care products are expected to generate key growth opportunities in the sodium bicarbonate market in the U.S. as well as in Canada for the duration of the forecast period.
What is the Sodium Bicarbonate Market Scenario in India?
The Indian sodium bicarbonate market is one of the leading markets for sodium bicarbonate in the South Asia & Pacific region accounting for more than 33% of the market through the end of the projection period.
While ASEAN countries cumulatively surpass the value of the Indian market, India is expected to display steady growth in the upcoming years owing to the high reliance on poultry farming, the rapidly expanding Indian pharmaceutical industry, and the expansion of the personal care market, both of which are aiding future prospects for sodium bicarbonate use.

A unified Market Research Subscription Platform, built for today's disparate research needs.
Category-wise Insights
How are Food and Pharmaceutical End-Use Industries Contributing to Revenue?
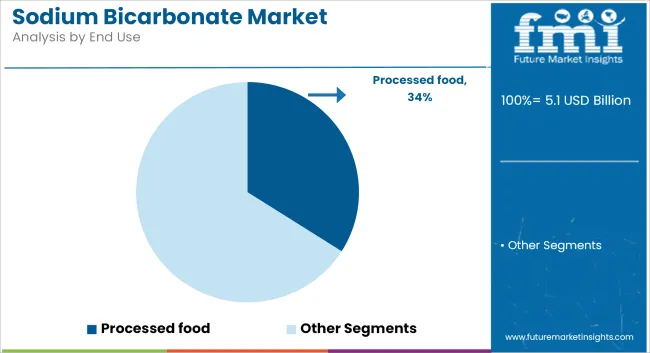
Accounting for almost 45% of the overall market share, the processed food segment is expected to drive the global sodium bicarbonate market. The processed food segment is expected to hold more than 40% of the market value share in 2021.
Growing demand for convenience foods is a key factor driving the growth of the sodium bicarbonate market. Its ability to neutralize acidic conditions and maintain a stable PH level in food drives the use of the chemical compound in baked products like bread, biscuits, and cakes. Furthermore, baking soda manufacturers benefit from sodium bicarbonate's low environmental impact and manufacturing costs.
Furthermore, the pharmaceutical industry is emerging as a major end-user accounting for close to 18% of overall sales as it is used extensively as an antacid and in hemodialysis solutions for the treatment of chronic kidney diseases.
How Big Is Technical Grade Segment in Sodium Bicarbonate Market?
Technical grade sodium bicarbonate is expected to account for over 40% of the global market share in terms of grade. This growth can be largely attributed to several end-use industries including chemical production, flue gas desulfurization, leather processing,
Also, niche applications including dyes, detergents, fire extinguishers and more support market growth. As a result, the demand for sodium bicarbonate is expected to witness significant growth in years to come.
What’s the Market Share of Powdered Sodium Bicarbonate?
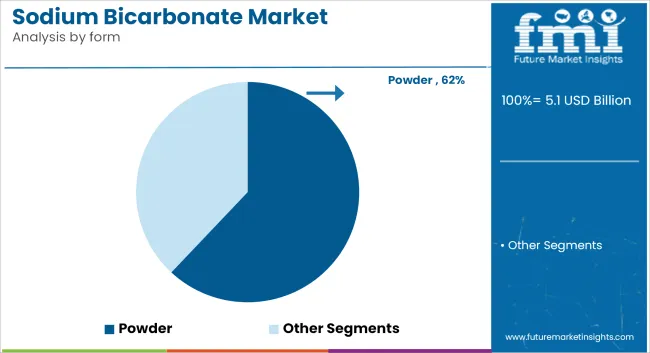
Powdered sodium bicarbonate accounts for over 82% of the global sodium bicarbonate market far surpassing pellet, slurry, and liquid variants. The powder form of sodium bicarbonate is expected to remain dominant owing to physical properties including its crystalline nature and its use in major industries including food and beverage, chemical, pharmaceutical, and in water treatment facilities.
Competitive Landscape
Key players in the sodium bicarbonate market are strongly focusing on profit generation from their existing product portfolios along while exploring potential new applications. To cater to the demand from numerous end use industries, key players are emphasizing on increasing their sodium bicarbonate production capacities. Furthermore, prominent players are also pushing for geographical expansion to decrease the dependency on imported sodium bicarbonate.
In March 2021, Solvay SA announced its intentions to divest its soda ash and derivatives business creating a separate legal entity to optimize cash flow generation while improving on the company’s strategic flexibility.
In June 2020, Tata Chemicals announced the reorganization of its business under the verticals of nutritional sciences, agri sciences, energy science, and material sciences to improve focus on lucrative science and chemistry segments, expanding on its knowledge and expertise base.
In March 2020, the European arm of the company announced the building of a new plant in Winnington for the production of Ecokarb, a net zero carbon emissions product based on sodium bicarbonate for applications in the pharmaceutical industry.
Some of the leading companies operating in the market are:
- Solvay SA
- Merck KGaA
- Nirma ltd.
- Tata Chemicals Ltd.
- GHCL Ltd.
- Ciech SA
- DCW Ltd.
- Seqens group
- Tosoh Corporation
- Hawkins, Inc.
- Vitro
- Church & Dwight Co., Inc.
*The list is not exhaustive, and only for representational purposes. Full competitive intelligence with SWOT analysis available in the report.
Scope of the Report
Attribute |
Details |
Forecast Period |
2021-2031 |
Historical Data Available for |
2016-2020 |
Market Analysis |
USD Million for value and Tons for Volume |
Key Regions Covered |
North America, Latin America, Europe, East Asia, South Asia & Pacific, Middle East & Africa |
Key Countries Covered |
US, Canada, Germany, U.K., France, Italy, Spain, Russia, China, Japan, South Korea, brazil, Mexico, GCC Countries, Turkey, Northern Africa, South Africa. |
Key Segments Covered |
Grade, Form, Application, and Region |
Key Companies Profiled |
|
Report Coverage |
Market Forecast, brand share analysis, competition intelligence, DROT analysis, Market Dynamics and Challenges, Strategic Growth Initiatives |
Customization & Pricing |
Sodium Bicarbonate Market by Category
By Grade Type:
- Pharmaceutical Grade
- Technical Grade
- Food Grade
- Feed Grade
By Form:
- Powder
- Pellets
- Slurry
- Liquid
By End Use:
- Processed Food
- Pharmaceuticals
- Personal Care Products
- Chemicals
- Agrochemicals & Nutrients
- Detergent
- Fire Extinguisher
- Leather & Dyeing
- Others
Region:
- North America
- Latin America
- Europe
- East Asia
- South Asia & Pacific
- Middle East and Africa (MEA)
Frequently Asked Questions
East Asia is estimated to remain the leading market for sodium bicarbonate accounting for over 30% of the global market share in 2021. China is the leading regional market-driven with revenue expected to surpass US$ 500 Mn by 2031.
Food grade and technical grade sodium bicarbonate products are expected to remain the most preferred grades, cumulatively accounting for more than 70% of the overall market.
Sodium bicarbonate is widely used in the food and beverage industry, which accounts more than 45% of overall consumption. The usage of sodium bicarbonate is seen in the form of baking powder which is further used in baking of biscuits, cake, bread, cookies and other foods.
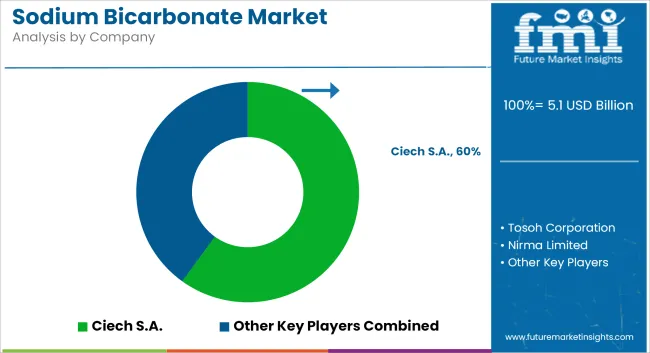
Some of the leading companies manufacturing sodium bicarbonate are Solvay SA, Merck KGaA, Nirma ltd., Tata Chemicals Ltd., GHCL ltd, Ciech SA, DCW, Seqens group, Tosoh Corporation, Hawkins, Inc., Vitro and Church & Dwight Co., Inc. and others. Key players account for 50 to 60% of the market.
Table of Content
1. Executive Summary
1.1. Market Outlook
1.2. Demand Side Trends
1.3. Supply Side Trends
1.4. Technology Roadmap
1.5. Analysis and Recommendations
2. Market Overview
2.1. Market Coverage / Taxonomy
2.2. Market Definition / Scope / Limitations
3. Key Market Trends
3.1. Key Trends Impacting the Market
3.2. Innovation / Development Trends
4. Key Success Factors
4.1. Product Adoption / Usage Analysis
4.2. Product innovation & Diversification
4.3. Marketing and Brand management
4.4. Supply Chain Management
5. Global Sodium Bicarbonate Market Demand Analysis 2016-2020 and Forecast, 2021-2031
5.1. Historical Market Volume (KT) Analysis, 2016-2020
5.2. Current and Future Market Volume (KT) Projections, 2021-2031
5.3. Y-o-Y Growth Trend Analysis
6. Global Sodium Bicarbonate Market - Pricing Analysis
6.1. Pricing Analysis By Grade
6.2. Pricing Break-up
7. Global Sodium Bicarbonate Market Demand (in Value or Size in US$ Mn) Analysis 2016-2020 and Forecast, 2021-2031
7.1. Historical Market Value (US$ Mn) Analysis, 2016-2020
7.2. Current and Future Market Value (US$ Mn) Projections, 2021-2031
7.2.1. Y-o-Y Growth Trend Analysis
7.2.2. Absolute $ Opportunity Analysis
8. Market Background
8.1. Macro-Economic Factors
8.1.1. Global GDP Growth Outlook
8.1.2. Global Soda Ash Market Overview
8.1.3. Global Chemical Industry Outlook
8.1.4. Global Food & Beverages Industry Overview
8.1.5. Global Pharmaceutical Industry Overview
8.1.6. Other Key Macroeconomic Factors
8.2. Forecast Factors - Relevance & Impact
8.2.1. Competition Among Manufacturers
8.2.2. Availability of Substitutes
8.2.3. Demand From Agrochemical Industry
8.2.4. Demand From Pharmaceutical Industries
8.2.5. Demand From Processed Food & Beverages
8.2.6. Demand For Water Treatment Chemicals
8.2.7. Raw Material Pricing
8.2.8. GDP Growth Rate
8.3. Value Chain Analysis
8.4. Buyer’s Decision Analysis
8.5. Market Dynamics
8.5.1. Drivers
8.5.2. Restraints
8.5.3. Opportunity Analysis
8.6. Production Process Overview
8.7. Supply Demand Analysis
8.8. Key Regulations and Certificates related to Quality
8.9. Comparative Analysis of Sodium Bicarbonate vs. Substitutes
8.10. Impact of COVID – 19 Crisis
8.10.1. Current Statistics
8.10.2. World Economy / Cluster Projections
8.10.3. Potential of Impact by Taxonomy
8.10.4. Recovery Scenario (Short, Mid and Long term)
8.10.5. Key Strategies
9. Global Sodium Bicarbonate Market Analysis 2016-2020 and Forecast 2021-2031, By Grade
9.1. Introduction / Key Findings
9.2. Historical Market Size (US$ Mn) and Volume Analysis By Grade, 2016 - 2020
9.3. Current and Future Market Size (US$ Mn) and Volume Analysis and Forecast By Grade, 2021 - 2031
9.3.1. Pharmaceutical Grade
9.3.2. Technical Grade
9.3.3. Food Grade
9.3.4. Feed Grade
9.4. Market Attractiveness Analysis By Grade
10. Global Sodium Bicarbonate Market Analysis 2016-2020 and Forecast 2021-2031, By Form
10.1. Introduction / Key Findings
10.2. Historical Market Size (US$ Mn) and Volume Analysis By Form, 2016 - 2020
10.3. Current and Future Market Size (US$ Mn) and Volume Analysis and Forecast By Form, 2021 - 2031
10.3.1. Powder
10.3.2. Pellets/Tablets
10.3.3. Slurry
10.3.4. Liquid
10.4. Market Attractiveness Analysis By Form
11. Global Sodium Bicarbonate Market Analysis 2016-2020 and Forecast 2021-2031, By End Use
11.1. Introduction / Key Findings
11.2. Historical Market Size (US$ Mn) and Volume Analysis By End Use, 2016 - 2020
11.3. Current and Future Market Size (US$ Mn) and Volume Analysis and Forecast By End Use, 2021 - 2031
11.3.1. Processed Food
11.3.2. Pharmaceuticals
11.3.3. Personal Care Products
11.3.4. Chemicals
11.3.5. Agrochemicals & Nutrients
11.3.6. Detergents
11.3.7. Fire Extinguisher
11.3.8. Leather & Dyeing
11.3.9. Others
11.4. Market Attractiveness Analysis By End Use
12. Global Sodium Bicarbonate Market Analysis 2016-2020 and Forecast 2021-2031, by Region
12.1. Introduction
12.2. Historical Market Size (US$ Mn) and Volume Analysis By Region, 2016 - 2020
12.3. Current Market Size (US$ Mn) and Volume Analysis and Forecast By Region, 2021 - 2031
12.3.1. North America
12.3.2. Latin America
12.3.3. Europe
12.3.4. East Asia
12.3.5. South Asia & Pacific
12.3.6. Middle East & Africa
12.4. Market Attractiveness Analysis By Region
13. North America Sodium Bicarbonate Market Analysis 2016-2020 and Forecast 2021-2031
13.1. Introduction
13.2. Pricing Analysis
13.3. Historical Market Size (US$ Mn) and Volume Trend Analysis By Market Taxonomy, 2016 - 2020
13.4. Market Size (US$ Mn) and Volume Forecast By Market Taxonomy, 2021 - 2031
13.4.1. By Grade
13.4.2. By Form
13.4.3. By End Use
13.4.4. By Country
13.4.4.1. U.S.
13.4.4.2. Canada
13.5. Market Attractiveness Analysis
13.5.1. By Grade
13.5.2. By Form
13.5.3. By End Use
13.5.4. By Country
13.6. Market Trends
13.7. Key Market Participants - Intensity Mapping
14. Latin America Sodium Bicarbonate Market Analysis 2016-2020 and Forecast 2021-2031
14.1. Introduction
14.2. Pricing Analysis
14.3. Historical Market Size (US$ Mn) and Volume Trend Analysis By Market Taxonomy, 2016 - 2020
14.4. Market Size (US$ Mn) and Volume Forecast By Market Taxonomy, 2021 - 2031
14.4.1. By Grade
14.4.2. By Form
14.4.3. By End Use
14.4.4. By Country
14.4.4.1. Brazil
14.4.4.2. Mexico
14.4.4.3. Rest of Latin America
14.5. Market Attractiveness Analysis
14.5.1. By Grade
14.5.2. By Form
14.5.3. By End Use
14.5.4. By Country
14.6. Market Trends
14.7. Key Market Participants - Intensity Mapping
15. Europe Sodium Bicarbonate Market Analysis 2016-2020 and Forecast 2021-2031
15.1. Introduction
15.2. Pricing Analysis
15.3. Historical Market Size (US$ Mn) and Volume Trend Analysis By Market Taxonomy, 2016 - 2020
15.4. Market Size (US$ Mn) and Volume Forecast By Market Taxonomy, 2021 - 2031
15.4.1. By Grade
15.4.2. By Form
15.4.3. By End Use
15.4.4. By Country
15.4.4.1. Germany
15.4.4.2. Italy
15.4.4.3. France
15.4.4.4. U.K.
15.4.4.5. Spain
15.4.4.6. BENELUX
15.4.4.7. Russia
15.4.4.8. Rest of Europe
15.5. Market Attractiveness Analysis
15.5.1. By Grade
15.5.2. By Form
15.5.3. By End Use
15.5.4. By Country
15.6. Market Trends
15.7. Key Market Participants - Intensity Mapping
16. East Asia Sodium Bicarbonate Market Analysis 2016-2020 and Forecast 2021-2031
16.1. Introduction
16.2. Pricing Analysis
16.3. Historical Market Size (US$ Mn) and Volume Trend Analysis By Market Taxonomy, 2016 - 2020
16.4. Market Size (US$ Mn) and Volume Forecast By Market Taxonomy, 2021 - 2031
16.4.1. By Grade
16.4.2. By Form
16.4.3. By End Use
16.4.4. By Country
16.4.4.1. China
16.4.4.2. Japan
16.4.4.3. South Korea
16.5. Market Attractiveness Analysis
16.5.1. By Grade
16.5.2. By Form
16.5.3. By End Use
16.5.4. By Country
16.6. Market Trends
16.7. Key Market Participants - Intensity Mapping
17. South Asia & Pacific Sodium Bicarbonate Market Analysis 2016-2020 and Forecast 2021-2031
17.1. Introduction
17.2. Pricing Analysis
17.3. Historical Market Size (US$ Mn) and Volume Trend Analysis By Market Taxonomy, 2016 - 2020
17.4. Market Size (US$ Mn) and Volume Forecast By Market Taxonomy, 2021 - 2031
17.4.1. By Grade
17.4.2. By Form
17.4.3. By End Use
17.4.4. By Country
17.4.4.1. India
17.4.4.2. ASEAN
17.4.4.3. ANZ
17.4.4.4. Rest of South Asia & Pacific
17.5. Market Attractiveness Analysis
17.5.1. By Grade
17.5.2. By Form
17.5.3. By End Use
17.5.4. By Country
17.6. Market Trends
17.7. Key Market Participants - Intensity Mapping
18. Middle East and Africa Sodium Bicarbonate Market Analysis 2016-2020 and Forecast 2021-2031
18.1. Introduction
18.2. Pricing Analysis
18.3. Historical Market Size (US$ Mn) and Volume Trend Analysis By Market Taxonomy, 2016 - 2020
18.4. Market Size (US$ Mn) and Volume Forecast By Market Taxonomy, 2021 - 2031
18.4.1. By Grade
18.4.2. By Form
18.4.3. By End Use
18.4.4. By Country
18.4.4.1. GCC Countries
18.4.4.2. Turkey
18.4.4.3. Northern Africa
18.4.4.4. South Africa
18.4.4.5. Rest of Middle East and Africa
18.5. Market Attractiveness Analysis
18.5.1. By Grade
18.5.2. By Form
18.5.3. By End Use
18.5.4. By Country
18.6. Market Trends
18.7. Key Market Participants - Intensity Mapping
19. Key and Emerging Countries Sodium Bicarbonate Market Analysis
19.1. Introduction
19.1.1. Market Value Proportion Analysis, By Key Countries
19.1.2. Global Vs. Country Growth Comparison
19.2. U.S. Sodium Bicarbonate Market Analysis
19.2.1. By Grade
19.2.2. By Form
19.2.3. By End Use
19.3. Canada Sodium Bicarbonate Market Analysis
19.3.1. By Grade
19.3.2. By Form
19.3.3. By End Use
19.4. Mexico Sodium Bicarbonate Market Analysis
19.4.1. By Grade
19.4.2. By Form
19.4.3. By End Use
19.5. Brazil Sodium Bicarbonate Market Analysis
19.5.1. By Grade
19.5.2. By Form
19.5.3. By End Use
19.6. Germany Sodium Bicarbonate Market Analysis
19.6.1. By Grade
19.6.2. By Form
19.6.3. By End Use
19.7. Italy Sodium Bicarbonate Market Analysis
19.7.1. By Grade
19.7.2. By Form
19.7.3. By End Use
19.8. France Sodium Bicarbonate Market Analysis
19.8.1. By Grade
19.8.2. By Form
19.8.3. By End Use
19.9. U.K. Sodium Bicarbonate Market Analysis
19.9.1. By Grade
19.9.2. By Form
19.9.3. By End Use
19.10. Spain Sodium Bicarbonate Market Analysis
19.10.1. By Grade
19.10.2. By Form
19.10.3. By End Use
19.11. Russia Sodium Bicarbonate Market Analysis
19.11.1. By Grade
19.11.2. By Form
19.11.3. By End Use
19.12. BENELUX Sodium Bicarbonate Market Analysis
19.12.1. By Grade
19.12.2. By Form
19.12.3. By End Use
19.13. China Sodium Bicarbonate Market Analysis
19.13.1. By Grade
19.13.2. By Form
19.13.3. By End Use
19.14. Japan Sodium Bicarbonate Market Analysis
19.14.1. By Grade
19.14.2. By Form
19.14.3. By End Use
19.15. S. Korea Sodium Bicarbonate Market Analysis
19.15.1. By Grade
19.15.2. By Form
19.15.3. By End Use
19.16. Global Sodium Bicarbonate Market Analysis
19.16.1. By Grade
19.16.2. By Form
19.16.3. By End Use
19.17. ASEAN Sodium Bicarbonate Market Analysis
19.17.1. By Grade
19.17.2. By Form
19.17.3. By End Use
19.18. ANZ Sodium Bicarbonate Market Analysis
19.18.1. By Grade
19.18.2. By Form
19.18.3. By End Use
19.19. GCC Countries Sodium Bicarbonate Market Analysis
19.19.1. By Grade
19.19.2. By Form
19.19.3. By End Use
19.20. Turkey Sodium Bicarbonate Market Analysis
19.20.1. By Grade
19.20.2. By Form
19.20.3. By End Use
19.21. South Africa Sodium Bicarbonate Market Analysis
19.21.1. By Grade
19.21.2. By Form
19.21.3. By End Use
20. Market Structure Analysis
20.1. Market Analysis by Tier of Companies [Sodium Bicarbonate]
20.2. Market Concentration
20.3. Market Share Analysis of Top Players
20.4. Production Capacity Estimates of Top Players
20.5. Market Presence Analysis
20.5.1. By Regional footprint of Players
20.5.2. Product foot print by Players
21. Competition Analysis
21.1. Competition Dashboard
21.2. Competition Benchmarking
21.3. Competition Key Developments
21.4. Competition Deep Dive
21.4.1. Solvay S.A.
21.4.1.1. Overview
21.4.1.2. Product Portfolio
21.4.1.3. Key Financials
21.4.1.4. Sales Footprint
21.4.1.5. Key developments
21.4.1.6. Strategy Overview
21.4.2. Merck KGaA
21.4.2.1. Overview
21.4.2.2. Product Portfolio
21.4.2.3. Key Financials
21.4.2.4. Sales Footprint
21.4.2.5. Key developments
21.4.2.6. Strategy Overview
21.4.3. Nirma Limited
21.4.3.1. Overview
21.4.3.2. Product Portfolio
21.4.3.3. Key Financials
21.4.3.4. Sales Footprint
21.4.3.5. Key developments
21.4.3.6. Strategy Overview
21.4.4. GHCL Limited
21.4.4.1. Overview
21.4.4.2. Product Portfolio
21.4.4.3. Key Financials
21.4.4.4. Sales Footprint
21.4.4.5. Key developments
21.4.4.6. Strategy Overview
21.4.5. Tata Chemicals Ltd.
21.4.5.1. Overview
21.4.5.2. Product Portfolio
21.4.5.3. Key Financials
21.4.5.4. Sales Footprint
21.4.5.5. Key developments
21.4.5.6. Strategy Overview
21.4.6. DCW Ltd.
21.4.6.1. Overview
21.4.6.2. Product Portfolio
21.4.6.3. Key Financials
21.4.6.4. Sales Footprint
21.4.6.5. Key developments
21.4.6.6. Strategy Overview
21.4.7. Novacap Group
21.4.7.1. Overview
21.4.7.2. Product Portfolio
21.4.7.3. Key Financials
21.4.7.4. Sales Footprint
21.4.7.5. Key developments
21.4.7.6. Strategy Overview
21.4.8. Ciech SA
21.4.8.1. Overview
21.4.8.2. Product Portfolio
21.4.8.3. Key Financials
21.4.8.4. Sales Footprint
21.4.8.5. Key developments
21.4.8.6. Strategy Overview
21.4.9. Genesis Energy, LP
21.4.9.1. Overview
21.4.9.2. Product Portfolio
21.4.9.3. Key Financials
21.4.9.4. Sales Footprint
21.4.9.5. Key developments
21.4.9.6. Strategy Overview
21.4.10. FMC Corporation
21.4.10.1. Overview
21.4.10.2. Product Portfolio
21.4.10.3. Key Financials
21.4.10.4. Sales Footprint
21.4.10.5. Key developments
21.4.10.6. Strategy Overview
21.4.11. Tosoh Corporation
21.4.11.1. Overview
21.4.11.2. Product Portfolio
21.4.11.3. Key Financials
21.4.11.4. Sales Footprint
21.4.11.5. Key developments
21.4.11.6. Strategy Overview
21.4.12. Hawkins, Inc.
21.4.12.1. Overview
21.4.12.2. Product Portfolio
21.4.12.3. Key Financials
21.4.12.4. Sales Footprint
21.4.12.5. Key developments
21.4.12.6. Strategy Overview
21.4.13. Vitro
21.4.13.1. Overview
21.4.13.2. Product Portfolio
21.4.13.3. Key Financials
21.4.13.4. Sales Footprint
21.4.13.5. Key developments
21.4.13.6. Strategy Overview
22. Assumptions and Acronyms Used
23. Research Methodology
Let us know your requirement to get
100% FREE customization
List of Tables
Table 01: Global Sodium Bicarbonate Market Size Volume (KT) and Value (US$ Mn) Forecast by Grade, 2016–2031
Table 02: Global Sodium Bicarbonate Market Size Volume (KT) and Value (US$ Mn) Forecast by Form, 2016–2031
Table 03: Global Sodium Bicarbonate Market Size Volume (KT) and Value (US$ Mn) Forecast by End Use, 2016–2031
Table 04: Global Sodium Bicarbonate Market Size Volume (KT) and Value (US$ Mn) Forecast by Region, 2016–2031
Table 05: North America Sodium Bicarbonate Market Size (US$ Mn) and Volume (KT) Forecast by Country, 2016–2031
Table 06: North America Sodium Bicarbonate Market Size (US$ Mn) and Volume (KT) Forecast by Grade, 2016–2031
Table 07: North America Sodium Bicarbonate Market Size (US$ Mn) and Volume (KT) Forecast by Form, 2016–2031
Table 08: North America Sodium Bicarbonate Market Size (US$ Mn) and Volume (KT) Forecast by End Use, 2016–2031
Table 09: Latin America Sodium Bicarbonate Market Size (US$ Mn) and Volume (KT) Forecast by Country, 2016–2031
Table 10: Latin America Sodium Bicarbonate Market Size (US$ Mn) and Volume (KT) Forecast by Grade, 2016–2031
Table 11: Latin America Sodium Bicarbonate Market Size (US$ Mn) and Volume (KT) Forecast by Form, 2016–2031
Table 12: Latin America Sodium Bicarbonate Market Size (US$ Mn) and Volume (KT) Forecast by End Use, 2016–2031
Table 13: Europe Sodium Bicarbonate Market Volume (KT) and Size (US$ Mn) Forecast By Country, 2016–2031
Table 14: Europe Sodium Bicarbonate Market Size (US$ Mn) and Volume (KT) Forecast by Grade, 2016–2031
Table 15: Europe Sodium Bicarbonate Market Size (US$ Mn) and Volume (KT) Forecast by Form, 2016–2031
Table 16: Europe Sodium Bicarbonate Market Size (US$ Mn) and Volume (KT) Forecast by End Use, 2016–2031
Table 17: East Asia Sodium Bicarbonate Market Size (US$ Mn) and Volume (KT) Forecast by Country, 2016–2031
Table 18: East Asia Sodium Bicarbonate Market Size (US$ Mn) and Volume (KT) Forecast by Grade, 2016–2031
Table 19: East Asia Sodium Bicarbonate Market Size (US$ Mn) and Volume (KT) Forecast by Form, 2016–2031
Table 20: East Asia Sodium Bicarbonate Market Size (US$ Mn) and Volume (KT) Forecast by End Use, 2016–2031
Table 21: SAP Sodium Bicarbonate Market Size (US$ Mn) and Volume (KT) Forecast by Country, 2016–2031
Table 22: SAP Sodium Bicarbonate Market Size (US$ Mn) and Volume (KT) Forecast by Grade, 2016–2031
Table 23: SAP Sodium Bicarbonate Market Size (US$ Mn) and Volume (KT) Forecast by Form, 2016–2031
Table 24: SAP Sodium Bicarbonate Market Size (US$ Mn) and Volume (KT) Forecast by End Use, 2016–2031
Table 25: MEA Sodium Bicarbonate Market Size (US$ Mn) and Volume (KT) Forecast by Country, 2016–2031
Table 26: MEA Sodium Bicarbonate Market Size (US$ Mn) and Volume (KT) Forecast by Grade, 2016–2031
Table 27: MEA Sodium Bicarbonate Market Size (US$ Mn) and Volume (KT) Forecast by Form, 2016–2031
Table 28: MEA Sodium Bicarbonate Market Size (US$ Mn) and Volume (KT) Forecast by End Use, 2016–2031
Find your sweet spots for generating winning opportunities in this market.
Talk to AnalystList of Charts
Figure 01: Global Sodium Bicarbonate Market Historical, Current and Forecast Volume (KT), 2020 - 2031
Figure 02: Global Sodium Bicarbonate Market Historical, Current and Forecast Value (US$ Mn), 2020 - 2031
Figure 03: Global Sodium Bicarbonate Market Incremental $ Opportunity (US$ Mn), 2021 - 2031
Figure 04: Global Sodium Bicarbonate Market Share and BPS Analysis by Grade– 2021 & 2031
Figure 05: Global Sodium Bicarbonate Market Y-o-Y Growth Projections by Grade, 2020 - 2031
Figure 06: Global Sodium Bicarbonate Market Absolute $ Opportunity by Pharmaceutical Grade Segment, 2016-2031
Figure 07: Global Sodium Bicarbonate Market Absolute $ Opportunity by Technical Grade Segment, 2016-2031
Figure 08: Global Sodium Bicarbonate Market Absolute $ Opportunity by Food Grade Segment, 2016-2031
Figure 09: Global Sodium Bicarbonate Market Absolute $ Opportunity by Feed Grade Segment, 2016-2031
Figure 10: Global Sodium Bicarbonate Market Attractiveness Analysis by Grade, 2021-2031
Figure 11: Global Sodium Bicarbonate Market Share and BPS Analysis by Form– 2021 & 2031
Figure 12: Global Sodium Bicarbonate Market Y-o-Y Growth Projections by Form, 2020 - 2031
Figure 13: Global Sodium Bicarbonate Market Absolute $ Opportunity by Powder Segment, 2016-2031
Figure 14: Global Sodium Bicarbonate Market Absolute $ Opportunity by Pellet Segment, 2016-2031
Figure 15: Global Sodium Bicarbonate Market Absolute $ Opportunity by Slurry Segment, 2016-2031
Figure 16: Global Sodium Bicarbonate Market Absolute $ Opportunity by Liquid Segment, 2016-2031
Figure 17: Global Sodium Bicarbonate Market Attractiveness Analysis by Form, 2021-2031
Figure 18: Global Sodium Bicarbonate Market Share and BPS Analysis by End Use – 2021 & 2031
Figure 19: Global Sodium Bicarbonate Market Y-o-Y Growth Projections by End Use, 2020 - 2031
Figure 20: Global Sodium Bicarbonate Market Absolute $ Opportunity by Processed Food Segment, 2016-2031
Figure 21: Global Sodium Bicarbonate Market Absolute $ Opportunity by Pharmaceuticals Segment, 2016-2031
Figure 22: Global Sodium Bicarbonate Market Absolute $ Opportunity by Personal Care Products Segment, 2016-2031
Figure 23: Global Sodium Bicarbonate Market Absolute $ Opportunity by Chemicals Segment, 2016-2031
Figure 24: Global Sodium Bicarbonate Market Absolute $ Opportunity by Agrochemicals & Nutrients Segment, 2016-2031
Figure 25: Global Sodium Bicarbonate Market Absolute $ Opportunity by Detergent Segment, 2016-2031
Figure 26: Global Sodium Bicarbonate Market Absolute $ Opportunity by Fire Extinguisher Segment, 2016-2031
Figure 27: Global Sodium Bicarbonate Market Absolute $ Opportunity by Leather & Dyeing Segment, 2016-2031
Figure 28: Global Sodium Bicarbonate Market Absolute $ Opportunity by Others Segment, 2016-2031
Figure 29: Global Sodium Bicarbonate Market Attractiveness Analysis by End Use, 2021-2031
Figure 30: Global Sodium Bicarbonate Market Share and BPS Analysis by Region– 2021 & 2031
Figure 31: Global Sodium Bicarbonate Market Y-o-Y Growth Projections by Region, 2020 - 2031
Figure 32: Global Sodium Bicarbonate Market Absolute $ Opportunity by North America region, 2016-2031
Figure 33: Global Sodium Bicarbonate Market Absolute $ Opportunity by Latin America region, 2016-2031
Figure 34: Global Sodium Bicarbonate Market Absolute $ Opportunity by Europe region, 2016-2031
Figure 35: Global Sodium Bicarbonate Market Absolute $ Opportunity by East Asia region, 2016-2031
Figure 36: Global Sodium Bicarbonate Market Absolute $ Opportunity by SAP region, 2016-2031
Figure 37: Global Sodium Bicarbonate Market Absolute $ Opportunity by MEA Segment, 2016-2031
Figure 38: Global Sodium Bicarbonate Market Attractiveness Analysis by Region, 2021-2031
Figure 39: North America Sodium Bicarbonate Market Share and BPS Analysis by Country– 2021 & 2031
Figure 40: North America Sodium Bicarbonate Market Y-o-Y Growth Projections by Country, 2020 - 2031
Figure 41: North America Sodium Bicarbonate Market Attractiveness Analysis by Country, 2021-2031
Figure 42: North America Sodium Bicarbonate Market Share and BPS Analysis by Grade– 2021 & 2031
Figure 43: North America Sodium Bicarbonate Market Y-o-Y Growth Projections by Grade, 2020 - 2031
Figure 44: North America Sodium Bicarbonate Market Attractiveness Analysis by Grade, 2021-2031
Figure 45: North America Sodium Bicarbonate Market Share and BPS Analysis by Form– 2021 & 2031
Figure 46: North America Sodium Bicarbonate Market Y-o-Y Growth Projections by Form, 2020 - 2031
Figure 47: North America Sodium Bicarbonate Market Attractiveness Analysis by Form, 2021-2031
Figure 48: North America Sodium Bicarbonate Market Share and BPS Analysis by End Use– 2021 & 2031
Figure 49: North America Sodium Bicarbonate Market Y-o-Y Growth Projections by End Use, 2020 - 2031
Figure 50: North America Sodium Bicarbonate Market Attractiveness Analysis by End Use, 2021-2031
Figure 51: Latin America Sodium Bicarbonate Market Share and BPS Analysis by Country– 2021 & 2031
Figure 52: Latin America Sodium Bicarbonate Market Y-o-Y Growth Projections by Country, 2020 - 2031
Figure 53: Latin America Sodium Bicarbonate Market Attractiveness Analysis by Country, 2021-2031
Figure 54: Latin America Sodium Bicarbonate Market Share and BPS Analysis by Grade– 2021 & 2031
Figure 55: Latin America Sodium Bicarbonate Market Y-o-Y Growth Projections by Grade, 2020 - 2031
Figure 56: Latin America Sodium Bicarbonate Market Attractiveness Analysis by Grade, 2021-2031
Figure 57: Latin America Sodium Bicarbonate Market Share and BPS Analysis by Form– 2021 & 2031
Figure 58: Latin America Sodium Bicarbonate Market Y-o-Y Growth Projections by Form, 2020 - 2031
Figure 59: Latin America Sodium Bicarbonate Market Attractiveness Analysis by Form, 2021-2031
Figure 60: Latin America Sodium Bicarbonate Market Share and BPS Analysis by End Use– 2021 & 2031
Figure 61: Latin America Sodium Bicarbonate Market Y-o-Y Growth Projections by End Use, 2020 - 2031
Figure 62: Latin America Sodium Bicarbonate Market Attractiveness Analysis by End Use, 2021-2031
Figure 63: Europe Sodium Bicarbonate Market Share and BPS Analysis by Country– 2021 & 2031
Figure 64: Europe Sodium Bicarbonate Market Y-o-Y Growth Projections by Country, 2020 - 2031
Figure 65: Europe Sodium Bicarbonate Market Attractiveness Analysis by Country, 2021-2031
Figure 66: Europe Sodium Bicarbonate Market Share and BPS Analysis by Grade– 2021 & 2031
Figure 67: Europe Sodium Bicarbonate Market Y-o-Y Growth Projections by Grade, 2020 - 2031
Figure 68: Europe Sodium Bicarbonate Market Attractiveness Analysis by Grade, 2021-2031
Figure 69: Europe Sodium Bicarbonate Market Share and BPS Analysis by Form– 2021 & 2031
Figure 70: Europe Sodium Bicarbonate Market Y-o-Y Growth Projections by Form, 2020 - 2031
Figure 71: Europe Sodium Bicarbonate Market Attractiveness Analysis by Form, 2021-2031
Figure 72: Europe Sodium Bicarbonate Market Share and BPS Analysis by End Use– 2021 & 2031
Figure 73: Europe Sodium Bicarbonate Market Y-o-Y Growth Projections by End Use, 2020 - 2031
Figure 74: Europe Sodium Bicarbonate Market Attractiveness Analysis by End Use, 2021-2031
Figure 75: East Asia Sodium Bicarbonate Market Share and BPS Analysis by Country– 2021 & 2031
Figure 76: East Asia Sodium Bicarbonate Market Y-o-Y Growth Projections by Country, 2020 - 2031
Figure 77: East Asia Sodium Bicarbonate Market Attractiveness Analysis by Country, 2021-2031
Figure 78: East Asia Sodium Bicarbonate Market Share and BPS Analysis by Grade– 2021 & 2031
Figure 79: East Asia Sodium Bicarbonate Market Y-o-Y Growth Projections by Grade, 2020 - 2031
Figure 80: East Asia Sodium Bicarbonate Market Attractiveness Analysis by Grade, 2021-2031
Figure 81: East Asia Sodium Bicarbonate Market Share and BPS Analysis by Form– 2021 & 2031
Figure 82: East Asia Sodium Bicarbonate Market Y-o-Y Growth Projections by Form, 2020 - 2031
Figure 83: East Asia Sodium Bicarbonate Market Attractiveness Analysis by Form, 2021-2031
Figure 84: East Asia Sodium Bicarbonate Market Share and BPS Analysis by End Use– 2021 & 2031
Figure 85: East Asia Sodium Bicarbonate Market Y-o-Y Growth Projections by End Use, 2020 - 2031
Figure 86: East Asia Sodium Bicarbonate Market Attractiveness Analysis by End Use, 2021-2031
Figure 87: SAP Sodium Bicarbonate Market Share and BPS Analysis by Country– 2021 & 2031
Figure 88: SAP Sodium Bicarbonate Market Y-o-Y Growth Projections by Country, 2020 - 2031
Figure 89: SAP Sodium Bicarbonate Market Attractiveness Analysis by Country, 2021-2031
Figure 90: SAP Sodium Bicarbonate Market Share and BPS Analysis by Grade– 2021 & 2031
Figure 91: SAP Sodium Bicarbonate Market Y-o-Y Growth Projections by Grade, 2020 - 2031
Figure 92: SAP Sodium Bicarbonate Market Attractiveness Analysis by Grade, 2021-2031
Figure 93: SAP Sodium Bicarbonate Market Share and BPS Analysis by Form– 2021 & 2031
Figure 94: SAP Sodium Bicarbonate Market Y-o-Y Growth Projections by Form, 2020 - 2031
Figure 95: SAP Sodium Bicarbonate Market Attractiveness Analysis by Form, 2021-2031
Figure 96: SAP Sodium Bicarbonate Market Share and BPS Analysis by End Use– 2021 & 2031
Figure 97: SAP Sodium Bicarbonate Market Y-o-Y Growth Projections by End Use, 2020 - 2031
Figure 98: SAP Sodium Bicarbonate Market Attractiveness Analysis by End Use, 2021-2031
Figure 99: MEA Pacific Sodium Bicarbonate Market Share and BPS Analysis by Country– 2021 & 2031
Figure 100: MEA Sodium Bicarbonate Market Y-o-Y Growth Projections by Country, 2020 - 2031
Figure 101: MEA Sodium Bicarbonate Market Attractiveness Analysis by Country, 2021-2031
Figure 102: MEA Sodium Bicarbonate Market Share and BPS Analysis by Grade– 2021 & 2031
Figure 103: MEA Sodium Bicarbonate Market Y-o-Y Growth Projections by Grade, 2020 - 2031
Figure 104: MEA Sodium Bicarbonate Market Attractiveness Analysis by Grade, 2021-2031
Figure 105: MEA Sodium Bicarbonate Market Share and BPS Analysis by Form– 2021 & 2031
Figure 106: MEA Sodium Bicarbonate Market Y-o-Y Growth Projections by Form, 2020 - 2031
Figure 107: MEA Sodium Bicarbonate Market Attractiveness Analysis by Form, 2021-2031
Figure 108: MEA Sodium Bicarbonate Market Share and BPS Analysis by End Use– 2021 & 2031
Figure 109: MEA Sodium Bicarbonate Market Y-o-Y Growth Projections by End Use, 2020 - 2031
Figure 110: MEA Sodium Bicarbonate Market Attractiveness Analysis by End Use, 2021-2031
Need specific information?
Request CustomizationExplore Chemicals & Materials Insights
View Reports