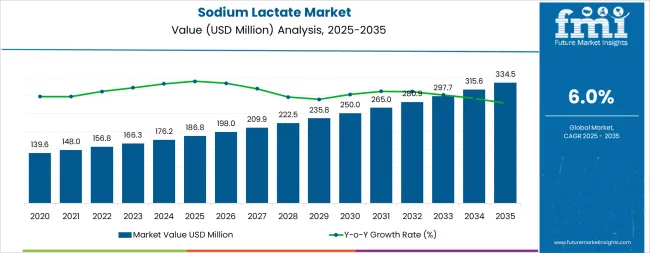
The sodium lactate market is expected to grow from USD 186.8 million in 2025 to USD 334.5 million in 2035, reflecting a CAGR of 6.0%. A rolling CAGR analysis indicates consistent and steady growth across the ten-year period, with incremental increases supporting long-term market expansion. Demand is expected to be driven by applications in food preservation, cosmetics, personal care products, and pharmaceutical formulations. Manufacturers focusing on high-purity grades and multifunctional applications are likely to capture additional market share, reinforcing the steady growth trajectory.
Between 2025 and 2030, the rolling CAGR suggests a steady pace of expansion, supported by rising adoption in processed foods, skin care products, and industrial applications. Growth during this period is expected to be gradual, reflecting stable consumption patterns and incremental product innovations. From 2030 to 2035, the rolling CAGR may maintain its level or show slight improvement as new applications, regulatory approvals, and regional adoption expand, particularly in emerging markets. The pattern indicates a predictable upward trend, with no abrupt fluctuations, highlighting the resilience of sodium lactate demand. Overall, rolling CAGR analysis reflects sustained market momentum, underpinned by consistent demand, technological adaptation, and broadening industrial use, offering reliable growth prospects for manufacturers and suppliers throughout the forecast period.
The sodium lactate market is primarily divided between industrial manufacturers and the food and beverage sector. Industrial applications account for approximately 55 60% of the market, driven by demand in personal care, pharmaceuticals, and chemical processing where sodium lactate is used as a pH regulator, humectant, or buffering agent. The food and beverage sector holds around 40 45%, supported by its use as a preservative, flavor enhancer, and moisture-retention agent in processed foods and meat products. Both segments collectively drive the market, with growth linked to increasing adoption in multiple industries requiring functional additives.
Recent trends in the sodium lactate market highlight innovation in formulation and extraction techniques. Manufacturers are exploring high-purity and concentrated solutions to improve functionality across applications. The growing demand for clean-label ingredients has LED to the development of sodium lactate derived from naturally fermented sources. Process improvements are reducing production costs and enhancing product consistency. There is rising interest in multifunctional formulations that combine sodium lactate with other additives to improve performance in food preservation, cosmetic formulations, and pharmaceutical products.
| Metric | Value |
|---|---|
| Market Value (2025) | USD 186.8 million |
| Market Forecast (2035) | USD 334.5 million |
| Growth Rate | 6.0% CAGR |
| Leading Technology | Liquid Product Form |
| Primary Application | Food & Nutritional Supplements Segment |
The market demonstrates strong fundamentals with liquid sodium lactate systems capturing a dominant share through advanced processing convenience and clean-label optimization capabilities. Food and nutritional supplements applications drive primary demand, supported by increasing processed meat consumption and natural preservative requirements. Geographic expansion remains concentrated in developed markets with established food safety infrastructure, while emerging economies show accelerating adoption rates driven by packaged food growth and rising pharmaceutical production standards.
Market expansion rests on three fundamental shifts driving adoption across the food and pharmaceutical sectors. Clean-label movement creates compelling operational advantages through sodium lactate preservatives that provide natural antimicrobial protection and shelf-life extension without synthetic additives, enabling food processors to meet consumer preferences while maintaining product safety and reducing waste. Pharmaceutical demand accelerates as healthcare facilities worldwide seek biocompatible buffer systems and electrolyte solutions that complement medical treatments, enabling precise pH control and osmotic balance that align with clinical standards and patient safety requirements.
Personal care innovation drives adoption from cosmetic manufacturers and skincare formulators requiring effective humectant solutions that enhance moisture retention while maintaining operational effectiveness during product formulation and stability testing operations. The growth faces headwinds from raw material sourcing challenges that vary across lactic acid producers regarding fermentation efficiency and substrate costs, which may limit adoption in cost-sensitive food applications. Technical limitations also persist regarding flavor impact and formulation compatibility that may reduce effectiveness in certain beverage and dairy systems, which affect taste profiles and product acceptance.
The sodium lactate market represents a specialized bio-based chemical opportunity driven by expanding clean-label food demand, pharmaceutical grade requirements, and the need for natural preservative alternatives in food processing and personal care formulations. The market's growth trajectory from USD 186.8 million in 2025 to USD 334.5 million by 2035 at a 6.0% CAGR reflects fundamental shifts in food preservation strategies and pharmaceutical buffer optimization. Geographic expansion opportunities are particularly pronounced in Europe and Asia-Pacific markets, where the dominance of liquid forms (65.0% market share) and food and nutritional supplements applications (38.5% share) provides clear strategic focus areas.
Strengthening the dominant liquid segment (65.0% market share) through enhanced solution formulations, superior processing convenience, and seamless integration with food manufacturing infrastructure. This pathway focuses on optimizing 60% solution grades (44.0%) for standard food preservation, developing 80% concentrated systems (14.0%) for cost-effective logistics, and creating custom blends (7.0%) for specialized applications. Market leadership consolidation through proprietary fermentation technology and comprehensive quality assurance enables premium positioning while defending competitive advantages against alternative preservative systems. Expected revenue pool: USD 18-29 million
Rapid clean-label adoption across India (6.6% CAGR), European Union (6.5% CAGR), and South Korea (6.4% CAGR) creates substantial expansion opportunities through local fermentation infrastructure and pharmaceutical-grade processing capabilities. Growing packaged food consumption, electrolyte solution demand, and government quality standards drive sustained sodium lactate requirements. Localization strategies reduce import costs, enable faster supply response, and position companies advantageously for food processor and pharmaceutical procurement programs. Expected revenue pool: USD 16-26 million
Expansion within the dominant food and nutritional supplements segment (38.5% market share) through specialized formulations addressing processed meat preservation (17.0%), dairy and cheese applications (9.5%), convenience meal systems (7.0%), and sports nutrition (5.0%). This pathway encompasses antimicrobial efficacy optimization, flavor profile management, and compatibility with diverse food processing methods, supporting modern food safety operations while enabling integration with multi-hurdle preservation technologies. Expected revenue pool: USD 14-23 million
Strategic expansion into personal care and cosmetics (17.0% market share) and clinical nutrition (16.0%) requires enhanced purity standards, superior humectant properties, and specialized biocompatibility addressing skincare and medical operational requirements. This pathway addresses moisture retention in cosmetics, pH buffering in pharmaceuticals, dialysis solutions (12.0%), and clinical electrolyte formulations with advanced quality control for demanding regulatory environments while creating opportunities for long-term pharmaceutical supply agreements. Expected revenue pool: USD 12-20 million
Development of powder sodium lactate systems (35.0% market share) including anhydrous grades (20.0%) for pharmaceutical manufacturing and monohydrate forms (15.0%) for specialized applications addressing storage stability, transportation efficiency, and reconstitution requirements. This pathway encompasses tablet excipients, dry mix blends, and pharmaceutical raw materials. Technology differentiation through controlled crystallization and high-purity processing enables diversified revenue streams while expanding addressable market opportunities in regions with limited cold-chain infrastructure. Expected revenue pool: USD 10-17 million
Expansion within the food and beverage end-user segment (40.0% market share) through processor partnerships (30.0%) and flavor and ingredient blender collaborations (10.0%) addressing clean-label preservation, beverage applications (9.0%), and ready-meal formulations. This pathway encompasses technical service programs, application development support, and regulatory documentation assistance, creating opportunities for long-term supply relationships and co-development initiatives across diverse food manufacturing applications. Expected revenue pool: USD 9-15 million
Development of ultra-high-purity sodium lactate for pharmaceutical manufacturers (22.0% share), medical device applications (7.0%), and clinical solutions addressing injectable-grade requirements, dialysis fluid specifications, and regulatory compliance. This pathway encompasses USP/EP grade certification, biocompatibility validation, and comprehensive quality documentation. Premium positioning reflects regulatory expertise while enabling access to high-value pharmaceutical and medical markets with stringent quality requirements and comprehensive traceability support. Expected revenue pool: USD 8-14 million
Primary Classification: The market segments by product form into Liquid and Powder categories, representing the evolution from basic fermentation products to specialized pharmaceutical-grade systems for comprehensive food preservation and medical application optimization.
Secondary Classification: Application segmentation divides the market into Food & Nutritional Supplements, Personal Care & Cosmetics, Clinical Nutrition, Dialysis Solutions, Beverages, and Cleaners & Detergents sectors, reflecting distinct requirements for purity, antimicrobial efficacy, and regulatory compliance standards.
Tertiary Classification: End-user segmentation covers Food & Beverages Industry, Pharmaceuticals Manufacturers, Cosmetic Industry, Medical Devices Manufacturers, and Others applications, demonstrating varied adoption patterns across food processing, pharmaceutical production, and specialty chemical manufacturing sectors.
Regional Classification: Geographic distribution covers North America, Europe, Asia Pacific, Latin America, and the Middle East & Africa, with developed markets leading adoption while emerging economies show accelerating growth patterns driven by clean-label trends and pharmaceutical manufacturing expansion programs.
The segmentation structure reveals technology progression from standard liquid solutions toward specialized pharmaceutical-grade powders with enhanced purity and stability capabilities, while application diversity spans from meat preservation to dialysis fluids requiring precise chemical processing solutions.
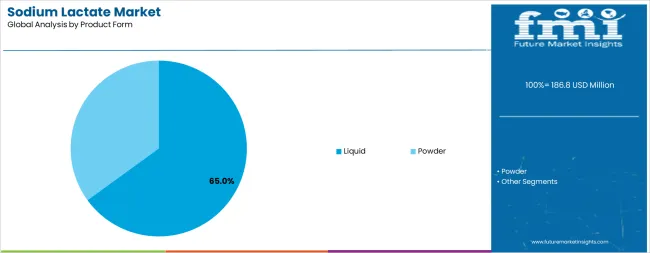
Market Position: Liquid sodium lactate systems command the leading position in the Sodium Lactate market with approximately 65.0% market share through processing convenience, including superior dissolution characteristics, ease of handling capability, and formulation flexibility that enable food processors and pharmaceutical manufacturers to achieve optimal performance across diverse preservation and buffer applications.
Value Drivers: The segment benefits from food industry preference for ready-to-use liquid systems that provide consistent antimicrobial activity, simplified dosing procedures, and manufacturing efficiency optimization without requiring dissolution equipment. Advanced solution features enable automated dosing systems, in-line blending, and integration with existing food processing lines, where convenience and operational reliability represent critical requirements.
Competitive Advantages: Liquid sodium lactate systems differentiate through established fermentation production infrastructure, proven formulation stability, and compatibility with diverse food and pharmaceutical processing that enhance operational effectiveness while maintaining optimal preservation and buffering performance suitable for various applications.
Key market characteristics:
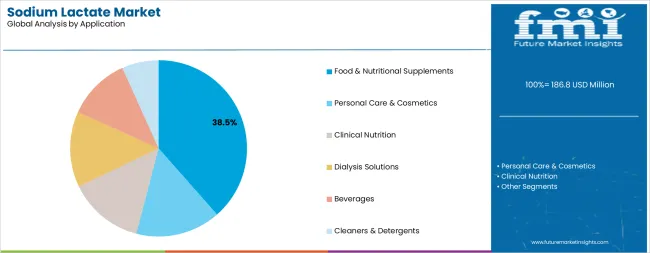
Market Context: Food & Nutritional Supplements applications dominate the Sodium Lactate market with approximately 38.5% market share due to widespread adoption in meat preservation and increasing focus on clean-label alternatives, shelf-life extension, and natural antimicrobial applications that support modern food safety standards while meeting consumer preferences for recognizable ingredients.
Appeal Factors: Food processors prioritize sodium lactate reliability, antimicrobial efficacy, and clean-label positioning that enable coordinated preservation strategies across multiple product lines. The segment benefits from substantial clean-label investment and natural preservative trends that emphasize bio-based lactates for quality control and regulatory compliance applications.
Growth Drivers: Processed meat production expansion (17.0%) incorporates sodium lactate as standard preservative for deli meats and ready-to-eat products, while dairy and cheese applications (9.5%) increase demand for natural preservation solutions that comply with food safety standards and extend product freshness.
Market Challenges: Varying food matrix compositions and regional flavor preferences may limit sodium lactate standardization across different product formulations or culinary traditions.
Application dynamics include:
Personal Care & Cosmetics applications capture approximately 17.0% market share through humectant properties and skin hydration benefits. Clinical Nutrition (16.0%), Dialysis Solutions (12.0%), Beverages (9.0%), and Cleaners & Detergents (7.5%) demonstrate steady demand across specialized pharmaceutical and industrial segments.
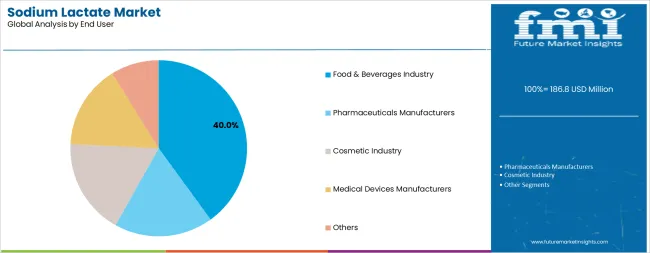
Market Context: Food & Beverages Industry applications dominate the Sodium Lactate market with approximately 40.0% market share due to extensive use in food processing facilities and increasing focus on natural preservation, clean-label formulation, and regulatory compliance applications that support modern food manufacturing operations while addressing consumer demand for transparent ingredient lists.
Appeal Factors: Food processors (30.0%) prioritize sodium lactate for proven antimicrobial performance, regulatory approval status, and consumer acceptance that enable effective preservation strategies across diverse product categories. The segment benefits from substantial industry investment in clean-label reformulation programs that emphasize natural alternatives to synthetic preservatives.
Growth Drivers: Food processing expansion programs incorporate sodium lactate as essential preservation system for meat and dairy manufacturing, while flavor and ingredient blenders (10.0%) increase demand for versatile preservation solutions that comply with clean-label requirements and food safety standards.
Application dynamics include:
Pharmaceuticals Manufacturers capture approximately 22.0% market share through injectable solutions and buffer applications. Cosmetic Industry (18.0%), Medical Devices Manufacturers (7.0%), and Others (13.0%) serve specialized requirements across healthcare, personal care, and industrial cleaning segments.
Growth Accelerators: Clean-label consumer trends drive primary adoption as sodium lactate provides natural preservation and recognizable ingredient status that enable food manufacturers to meet consumer preferences without compromising food safety, supporting brand positioning and market differentiation missions that require transparent ingredient declarations. Pharmaceutical expansion accelerates market development as healthcare facilities seek biocompatible buffer solutions and electrolyte systems that maintain physiological pH while ensuring operational effectiveness during intravenous therapy and dialysis treatment scenarios. Personal care innovation increases worldwide, creating sustained demand for humectant ingredients that complement skin hydration formulations and provide moisture retention in complex cosmetic applications.
Growth Inhibitors: Raw material price fluctuations persist across lactic acid markets regarding fermentation substrate costs and energy requirements for purification processes, which may limit operational flexibility and market penetration in regions with volatile agricultural commodity prices or cost-sensitive food processing operations. Flavor impact considerations affect adoption in certain beverage and dairy systems where sodium lactate may impart slight taste characteristics that reduce consumer acceptance in sensitive applications. Market fragmentation across multiple purity grades and regional food safety standards creates formulation complexity between different regulatory frameworks and existing preservation systems.
Market Evolution Patterns: Adoption accelerates in processed food and pharmaceutical sectors where clean-label requirements justify ingredient premiums, with geographic concentration in developed markets transitioning toward mainstream adoption in emerging economies driven by packaged food growth and pharmaceutical manufacturing localization. Technology development focuses on enhanced fermentation efficiency, improved crystallization processes, and integration with multi-hurdle preservation technologies that optimize antimicrobial performance and cost-effectiveness. The market could face disruption if synthetic preservative alternatives achieve comparable clean-label positioning or if regulatory changes significantly alter approved usage levels in mainstream food applications. Sustainability integration enables bio-based production pathways, fermentation optimization programs, and circular economy initiatives that improve carbon footprint while supporting manufacturers' transition toward renewable feedstock sourcing and comprehensive environmental stewardship platforms.
The Sodium Lactate market demonstrates varied regional dynamics with Growth Leaders including India (6.6% CAGR) driving expansion through packaged food growth and electrolyte solution development. High-Growth Markets encompass South Korea (6.4% CAGR), and Japan (6.2% CAGR), benefiting from clean-label adoption and pharmaceutical-grade demand. Steady Performers feature China (6.1% CAGR), the United Kingdom (6.0% CAGR), and the United States (5.8% CAGR), where established food processing and medical applications support consistent growth patterns.
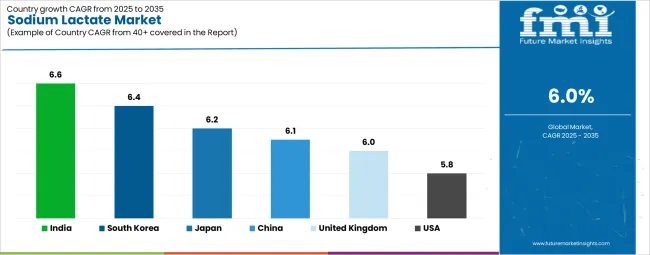
| Country | CAGR (2025-2035) |
|---|---|
| India | 6.6% |
| South Korea | 6.4% |
| Japan | 6.2% |
| China | 6.1% |
| United Kingdom | 6.0% |
| United States | 5.8% |
Regional synthesis reveals European markets leading adoption through clean-label regulations and pharmaceutical-grade requirements, while Asia-Pacific countries maintain robust growth supported by packaged food expansion and personal care manufacturing. North American markets show steady growth driven by meat processing applications and healthcare facility demand.
India establishes the highest growth trajectory through aggressive packaged food industry expansion and comprehensive pharmaceutical manufacturing development, integrating sodium lactate as essential ingredient in processed food preservation and electrolyte solution installations. The country's 6.6% CAGR reflects government initiatives promoting food safety standards and domestic pharmaceutical production that support the adoption of quality preservation systems in meat processing and clinical nutrition facilities. Growth concentrates in major industrial centers where food manufacturing development showcases integrated ingredient supply chains that appeal to processors seeking natural preservative solutions.
Indian manufacturers are developing local fermentation capabilities that combine domestic market advantages with international quality standards, including food-grade and pharmaceutical-grade lactate systems. Distribution channels through food ingredient suppliers and pharmaceutical distributors expand market access, while government support for manufacturing localization supports adoption across diverse food and healthcare segments.
Strategic Market Indicators:
South Korea establishes dynamic market expansion through sophisticated personal care product development and functional food manufacturing innovation, integrating sodium lactate as critical ingredient in K-beauty humectant formulations and sports nutrition installations. The country's 6.4% CAGR reflects cosmetic industry leadership and advanced functional food sector development that support the adoption of premium moisture retention systems in skincare manufacturing and wellness beverage facilities. Growth concentrates in major cosmetic manufacturing hubs where product innovation showcases integrated ingredient development platforms that appeal to formulators seeking multifunctional humectant solutions with proven efficacy.
Korean manufacturers are advancing fermentation biotechnology capabilities that combine domestic innovation strengths with global quality standards, including cosmetic-grade and food-grade lactate systems with precise specifications. Distribution channels through specialty ingredient suppliers and beauty industry networks expand market access, while government support for biobased chemistry programs supports adoption across expanding personal care and functional food segments.
Strategic Market Indicators:
Japan's market expansion benefits from diverse healthcare demand, including aging population clinical care requirements, IV therapy and dialysis solution applications, and high-specification cosmetic formulations that incorporate sodium lactate solutions for pH buffering and osmotic balance applications. The country maintains a 6.2% CAGR, driven by rising healthcare utilization and increasing awareness of advanced food technology benefits for product quality and safety enhancement.
Market dynamics focus on pharmaceutical-grade sodium lactate that balances biocompatibility performance with stringent quality requirements important to Japanese healthcare and cosmetic manufacturers. Growing elderly population creates sustained demand for medical-grade lactate in clinical applications.
Strategic Market Considerations:
China's advanced chemical manufacturing ecosystem demonstrates sophisticated sodium lactate production with documented operational effectiveness in pharmaceutical solvents and personal care applications through integration with chlor-alkali adjacencies and fermentation infrastructure. The country leverages manufacturing scale to maintain a 6.1% CAGR. Industrial centers showcase extensive installations where sodium lactate systems integrate with comprehensive pharmaceutical production platforms and personal care formulation facilities to optimize product quality and cost structure.
Chinese producers prioritize production capacity and cost competitiveness in sodium lactate development, creating demand for scalable fermentation systems with reliable purity characteristics. The market benefits from established pharmaceutical manufacturing infrastructure and substantial investment in personal care production that provides long-term operational benefits.
Market Intelligence Brief:
The UK market emphasizes clean-label food additives and pharmaceutical-grade applications through sodium lactate systems that manage natural preservative programs, IV solution production, and personal care hydration formulations aligned with consumer preference for recognizable ingredients. The country holds a 6.0% CAGR, driven by clean-label reformulation initiatives and pharmaceutical manufacturing that support sodium lactate adoption. British food processors prioritize natural preservation with sodium lactate systems delivering antimicrobial effectiveness through proven food-grade quality standards.
Strategic Market Indicators:
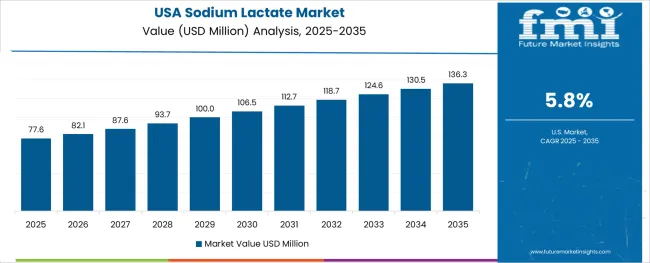
The USA market emphasizes processed meat applications and healthcare solutions through sodium lactate systems that manage clean-label preservative programs, IV therapy and dialysis volumes, and fermentation efficiency improvements aligned with food safety and pharmaceutical quality standards. The country holds a 5.8% CAGR, driven by meat processing industry consolidation and healthcare facility expansion that support sodium lactate consumption. American food processors prioritize shelf-life extension with sodium lactate systems delivering listeria control through proven antimicrobial formulations.
Technology deployment channels include meat processors, pharmaceutical manufacturers, and ingredient distributors that support professional applications for complex food safety and clinical requirements.
Performance Metrics:
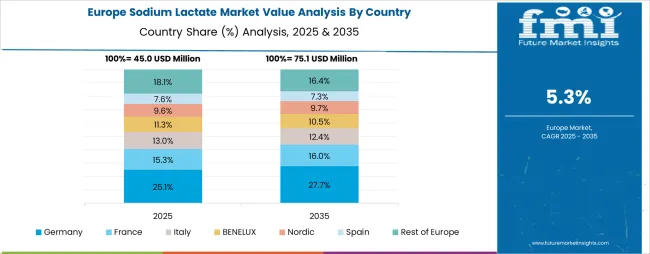
Europe accounts for an estimated 34.0% of global sodium lactate spend in 2025. Within Europe, Germany leads with approximately 21% share driven by pharma-grade and personal care demand plus strong meat processing applications. France follows with approximately 16% through dairy, charcuterie, and dermocosmetics markets. The United Kingdom holds approximately 14% supported by clean-label foods, IV solutions, and skincare formulations. Italy contributes approximately 11% across ready-meals, cheese, and cosmetics applications. Spain represents approximately 9% aided by meat and seafood preservation plus beverage applications. The Netherlands accounts for approximately 8% anchored by ingredient blenders and export-oriented personal care production. The Nordic region holds approximately 7% emphasizing natural preservatives in seafood and dairy plus premium skincare segments. Rest of Western and Eastern Europe collectively accounts for approximately 14% expanding via private-label foods, hospital solutions, and contract manufacturing operations supporting pharmaceutical and food ingredient requirements.
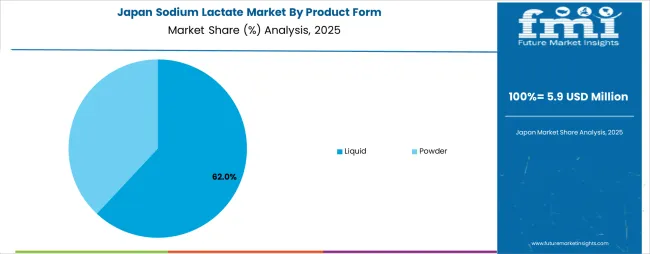
In Japan, the Sodium Lactate market prioritizes liquid product forms, which capture the dominant share of pharmaceutical and food manufacturing installations due to advanced features, including superior dissolution convenience and proven compatibility with existing processing infrastructure. Japanese pharmaceutical manufacturers emphasize quality consistency, purity standards, and long-term supply reliability, creating demand for liquid sodium lactate systems that provide stable chemical properties and adaptive performance based on application requirements and regulatory specifications. Pharmaceutical-grade liquid lactates maintain strong positioning in IV fluid and dialysis applications where biocompatibility and sterility meet operational requirements without compromising patient safety.
Market Characteristics:
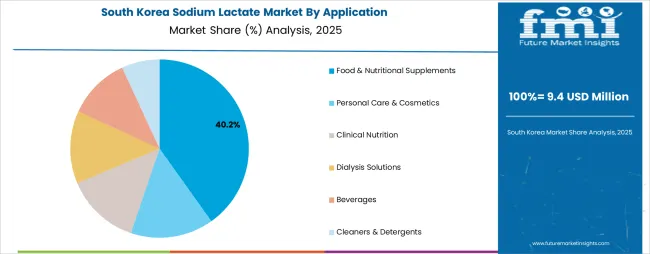
In South Korea, the market structure favors international specialty chemical companies, including Corbion, Jungbunzlauer, and regional fermentation producers, which maintain positions through comprehensive product portfolios and established personal care industry networks supporting both cosmetic manufacturing and pharmaceutical installations. These providers offer integrated solutions combining high-purity sodium lactate with technical support services and ongoing formulation assistance that appeal to Korean manufacturers seeking reliable ingredient systems. Local distributors and ingredient blenders capture market share by providing localized service capabilities and competitive pricing for standard food applications, while domestic producers focus on specialized grades tailored to Korean K-beauty and functional food characteristics.
Channel Insights:
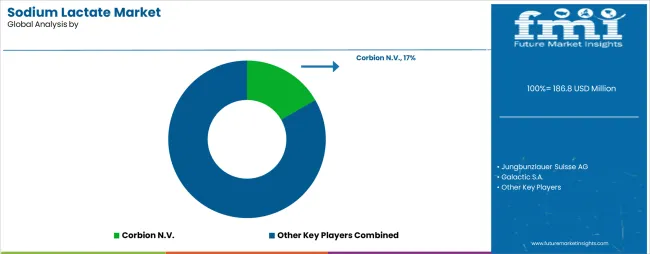
The Sodium Lactate market operates with moderate concentration, featuring approximately 10-12 meaningful participants, where leading companies control roughly 50-55% of the global market share through established lactic acid production capabilities and comprehensive fermentation networks. Corbion N.V. holds the leading position with approximately 17.0% market share through extensive lactic acid operations, global food industry relationships, and comprehensive pharmaceutical-grade manufacturing capabilities. Competition emphasizes product purity, supply reliability, and regulatory compliance rather than price-based rivalry.
Market Leaders encompass Corbion, Jungbunzlauer, and Galactic, which maintain competitive advantages through extensive fermentation expertise, global food processor partnerships, and comprehensive pharmaceutical-grade production capabilities that create customer relationships and support premium positioning. These companies leverage decades of lactic acid chemistry experience and ongoing fermentation investments to develop consistent sodium lactate products with reliable antimicrobial characteristics and regulatory compliance features.
Technology Innovators include Merck, Jindan Lactic Acid Technology, and Cargill, which compete through specialized fermentation technology focus and innovative preservation system development that appeal to food manufacturers seeking advanced clean-label capabilities and pharmaceutical-grade quality. These companies differentiate through proprietary fermentation strains and specialized food application expertise.
Regional Specialists feature companies like Henan Xinghan Biotechnology, Musashino Chemical Laboratory, Shandong Baisheng Biotechnology, and Qingdao Abel Technology, which focus on specific geographic markets and specialized applications, including pharmaceutical-grade systems and regional food preservation programs. Market dynamics favor participants that combine reliable fermentation quality with efficient supply chains, including consistent purity and technical support capabilities. Competitive pressure intensifies as established lactic acid producers expand into sodium lactate derivatives while specialized ingredient companies challenge incumbents through innovative preservation solutions and cost-effective fermentation technologies targeting high-growth clean-label and pharmaceutical segments.
| Item | Value |
|---|---|
| Quantitative Units | USD 186.8 million |
| Product Form | Liquid, Powder |
| Application | Food & Nutritional Supplements, Personal Care & Cosmetics, Clinical Nutrition, Dialysis Solutions, Beverages, Cleaners & Detergents |
| End User | Food & Beverages Industry, Pharmaceuticals Manufacturers, Cosmetic Industry, Medical Devices Manufacturers, Others |
| Regions Covered | North America, Europe, Asia Pacific, Latin America, Middle East & Africa |
| Countries Covered | India, European Union, South Korea, Japan, China, the UK, the USA, and 25+ additional countries |
| Key Companies Profiled | Corbion, Jungbunzlauer, Galactic, Merck, Jindan Lactic Acid Technology, Cargill, Henan Xinghan Biotechnology, Musashino Chemical Laboratory |
| Additional Attributes | Dollar sales by product form, application, and end-user categories, regional adoption trends across North America, Europe, and Asia-Pacific, competitive landscape with lactic acid producers and specialty chemical suppliers, food processor preferences for antimicrobial efficacy and clean-label positioning, integration with food preservation platforms and pharmaceutical quality systems, innovations in fermentation technology and pharmaceutical-grade processing applications, and development of multi-functional preservation solutions with enhanced food safety and regulatory compliance capabilities. |
The global sodium lactate market is estimated to be valued at USD 186.8 million in 2025.
The market size for the sodium lactate market is projected to reach USD 334.5 million by 2035.
The sodium lactate market is expected to grow at a 6.0% CAGR between 2025 and 2035.
The key product types in sodium lactate market are liquid and powder.
In terms of application, food & nutritional supplements segment to command 38.5% share in the sodium lactate market in 2025.


Our Research Products

The "Full Research Suite" delivers actionable market intel, deep dives on markets or technologies, so clients act faster, cut risk, and unlock growth.

The Leaderboard benchmarks and ranks top vendors, classifying them as Established Leaders, Leading Challengers, or Disruptors & Challengers.

Locates where complements amplify value and substitutes erode it, forecasting net impact by horizon

We deliver granular, decision-grade intel: market sizing, 5-year forecasts, pricing, adoption, usage, revenue, and operational KPIs—plus competitor tracking, regulation, and value chains—across 60 countries broadly.

Spot the shifts before they hit your P&L. We track inflection points, adoption curves, pricing moves, and ecosystem plays to show where demand is heading, why it is changing, and what to do next across high-growth markets and disruptive tech

Real-time reads of user behavior. We track shifting priorities, perceptions of today’s and next-gen services, and provider experience, then pace how fast tech moves from trial to adoption, blending buyer, consumer, and channel inputs with social signals (#WhySwitch, #UX).

Partner with our analyst team to build a custom report designed around your business priorities. From analysing market trends to assessing competitors or crafting bespoke datasets, we tailor insights to your needs.
Supplier Intelligence
Discovery & Profiling
Capacity & Footprint
Performance & Risk
Compliance & Governance
Commercial Readiness
Who Supplies Whom
Scorecards & Shortlists
Playbooks & Docs
Category Intelligence
Definition & Scope
Demand & Use Cases
Cost Drivers
Market Structure
Supply Chain Map
Trade & Policy
Operating Norms
Deliverables
Buyer Intelligence
Account Basics
Spend & Scope
Procurement Model
Vendor Requirements
Terms & Policies
Entry Strategy
Pain Points & Triggers
Outputs
Pricing Analysis
Benchmarks
Trends
Should-Cost
Indexation
Landed Cost
Commercial Terms
Deliverables
Brand Analysis
Positioning & Value Prop
Share & Presence
Customer Evidence
Go-to-Market
Digital & Reputation
Compliance & Trust
KPIs & Gaps
Outputs
Full Research Suite comprises of:
Market outlook & trends analysis
Interviews & case studies
Strategic recommendations
Vendor profiles & capabilities analysis
5-year forecasts
8 regions and 60+ country-level data splits
Market segment data splits
12 months of continuous data updates
DELIVERED AS:
PDF EXCEL ONLINE
Sodium Stearoyl Lactate Market Size and Share Forecast Outlook 2025 to 2035
Demand for Sodium Lactate in EU Size and Share Forecast Outlook 2025 to 2035
Sodium 3-Nitrobenzenesulfonate Market Size and Share Forecast Outlook 2025 to 2035
Sodium Difluorophosphate (NaDFP) Market Size and Share Forecast Outlook 2025 to 2035
Sodium Bisulfite Market Size and Share Forecast Outlook 2025 to 2035
Sodium Formate Market Size and Share Forecast Outlook 2025 to 2035
Sodium Borohydride Market Size and Share Forecast Outlook 2025 to 2035
Sodium Chloride Market Size and Share Forecast Outlook 2025 to 2035
Sodium Caprylate Market Size and Share Forecast Outlook 2025 to 2035
Sodium Caseinate Market Size and Share Forecast Outlook 2025 to 2035
Sodium Iodide Market Size and Share Forecast Outlook 2025 to 2035
Sodium Lauryl Sulphate Market Size and Share Forecast Outlook 2025 to 2035
Lactate Monitoring Devices Market Size and Share Forecast Outlook 2025 to 2035
Sodium Cumenesulfonate Market Size and Share Forecast Outlook 2025 to 2035
Sodium Hydrosulfite Market Size and Share Forecast Outlook 2025 to 2035
Sodium Sulphate Market Size and Share Forecast Outlook 2025 to 2035
Sodium-Ion Batteries Market Analysis - Size, Share, and Forecast Outlook 2025 to 2035
Sodium Hyaluronate Crosslinked Market Size and Share Forecast Outlook 2025 to 2035
Sodium Sulfur Batteries Market Size and Share Forecast Outlook 2025 to 2035
Sodium Malate Market Size and Share Forecast Outlook 2025 to 2035

Thank you!
You will receive an email from our Business Development Manager. Please be sure to check your SPAM/JUNK folder too.
Chat With
MaRIA