Sodium Hyaluronate Market Size and Share Forecast Outlook 2025 to 2035

The sodium hyaluronate market is estimated to be valued at USD 102.1 million in 2025 and is projected to reach USD 151.1 million by 2035, registering a CAGR of 4.0% over the forecast period. The sodium hyaluronate market is projected to add an absolute dollar opportunity of USD 79.3 million over the forecast period.
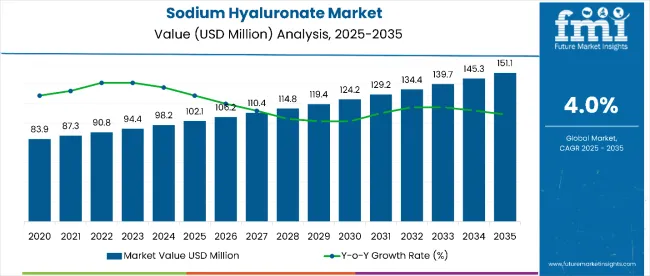
Quick Stats for Sodium Hyaluronate Market

  • Sodium Hyaluronate Market Value (2025): USD 102.1 million
  • Sodium Hyaluronate Market Forecast Value (2035): USD 151.1 million
  • Sodium Hyaluronate Market Forecast CAGR: 4.0%
  • Leading Application Segment in Sodium Hyaluronate Market in 2025: Pharmaceuticals (61.0%)
  • Key Growth Regions in Sodium Hyaluronate Market: Asia-Pacific, Europe, and North America
  • Top Key Players in Sodium Hyaluronate Market: Bloomage Bio-Technology Corporation, Fidia Farmaceutici S.p.A., FMC Corporation, Hyalose LLC.

Sodium Hyaluronate Market

Metric Value
Sodium Hyaluronate Market Estimated Value in (2025E) USD 102.1 million
Sodium Hyaluronate Market Forecast Value in (2035F) USD 151.1 million
Forecast CAGR (2025 to 2035) 4.0%

This reflects a 1.48 times growth at a compound annual growth rate of 4.0%. The market's evolution is expected to be shaped by rising demand for minimally invasive aesthetic procedures, expanding applications in orthopedic viscosupplementation, and growing usage in ophthalmic treatments for dry eye syndrome and cataract surgery.

By 2030, the market is likely to reach approximately USD 127.8 million, accounting for USD 25.7 million in incremental value over the first half of the decade. The remaining USD 53.6 million is expected during the second half, suggesting a moderately back-loaded growth pattern.

Product innovation focusing on enhanced biocompatibility and extended duration formulations is gaining traction due to sodium hyaluronate's superior molecular properties and clinical efficacy compared to traditional hyaluronic acid compounds.

Companies such as Bloomage Bio-Technology Corporation and Fidia Farmaceutici S.p.A. are advancing their competitive positions through investment in advanced fermentation technologies and specialized purification processes. Market performance will remain anchored in regulatory compliance frameworks, clinical validation requirements, and quality assurance standards governing medical-grade sodium hyaluronate production.

Strategic partnerships between pharmaceutical manufacturers and aesthetic clinics are supporting expansion into premium medical and cosmetic applications across global markets.

The market holds approximately 45% of the injectable hyaluronic acid derivatives market, driven by its superior solubility and enhanced tissue penetration properties compared to conventional hyaluronic acid formulations. It accounts for around 32% of the aesthetic dermal filler ingredients market, supported by clinical validation of safety profiles and aesthetic efficacy in facial rejuvenation procedures.

The market contributes nearly 28% to the orthopedic viscosupplementation treatments market, particularly for knee osteoarthritis management where sodium hyaluronate provides sustained joint lubrication and pain relief. The share in the cosmetic anti-aging ingredients market reaches about 18%, reflecting its integration into premium skincare formulations targeting hydration and wrinkle reduction.

The market is undergoing structural transformation driven by aging global populations and rising demand for minimally invasive medical and aesthetic procedures. Advanced biotechnology manufacturing processes using microbial fermentation and sophisticated purification techniques have enhanced product purity, molecular weight consistency, and biocompatibility, making sodium hyaluronate a preferred alternative to animal-derived hyaluronic acid compounds.

Strategic collaborations between biotechnology companies and medical device manufacturers have accelerated commercialization of innovative sodium hyaluronate-based products.

Sodium Hyaluronate Market Analysis by Top Investment Segments

The market is segmented by application, distribution channel, and region. By application, it includes pharmaceuticals, cosmetics, and personal care products. Based on distribution channel, the market is bifurcated into online and offline. Regionally, the market is analyzed across North America, Latin America, Asia Pacific, Western and Eastern Europe, and Japan.
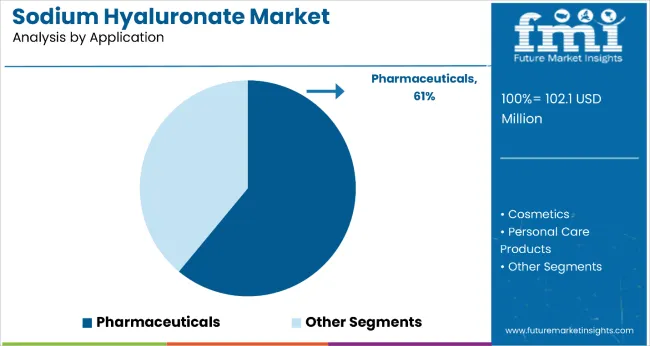
By Application, Pharmaceuticals Segment Accounts for 61.0% of the Market Share

Sodium Hyaluronate Market Analysis By Application

The pharmaceuticals segment leads with a dominant 61.0% market share in the application category, underscoring sodium hyaluronate’s critical role across medical disciplines such as orthopedics, ophthalmology, and dermatology. Its biocompatibility, viscoelasticity, and proven therapeutic efficacy make it indispensable for a range of clinical uses.

The segment is supported by increasing clinical validation, particularly in osteoarthritis management, where intra-articular injections provide long-lasting joint lubrication and pain relief. Ophthalmic usage is also rising, driven by higher cataract surgery rates and growing cases of dry eye syndrome in aging populations.

In dermatology, sodium hyaluronate is gaining traction in wound care and specialized medical skincare. Manufacturers are advancing pharmaceutical-grade formulations with tighter purity standards, controlled molecular weight, and tailored rheological profiles. With expanding regulatory approvals and growing therapeutic applications, the pharmaceuticals segment is expected to retain its market leadership while fostering innovation.
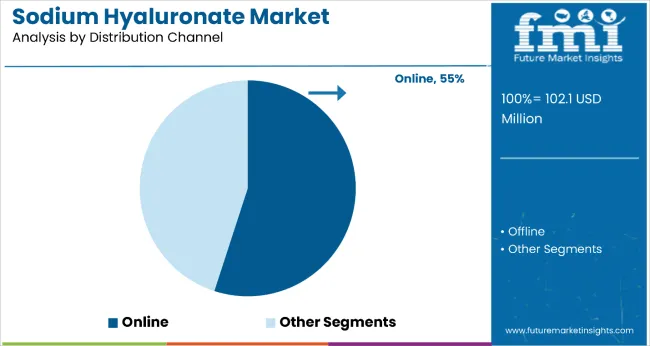
By Distribution Channel, Online Segment Accounts for 55.0% of the Market Share

Sodium Hyaluronate Market Analysis By Distribution Channel

The online distribution channel holds the top position with 55.0% of the total market share, fueled by rapid e-commerce adoption and changing consumer preferences toward convenience, accessibility, and value. Online platforms have become a major sales driver for pharmaceutical, skincare, and personal care products featuring sodium hyaluronate, prized for its hydration, anti-aging, and joint support benefits.

E-commerce players are expanding their presence in rural and tier-2 markets while enhancing digital engagement through influencer campaigns, targeted ads, and customer feedback loops.

The shift to digital was accelerated by the COVID-19 pandemic and continues to grow through value-added services such as subscription plans, discounts, and expedited delivery. This evolving ecosystem makes the online segment the most dynamic and profitable channel for sodium hyaluronate-based product distribution.

Why is the Sodium Hyaluronate Market Growing?

Sodium hyaluronate's enhanced solubility, superior tissue penetration capabilities, and proven biocompatibility make it highly attractive for advanced medical applications including orthopedic treatments, ophthalmic procedures, and aesthetic enhancement solutions requiring optimal performance and patient safety.

Growing global aging, demographics are driving increased prevalence of age-related conditions including osteoarthritis, dry eye syndrome, and skin aging, creating sustained demand for effective therapeutic interventions where sodium hyaluronate demonstrates clinical superiority. Technological advancements in biotechnology manufacturing and purification processes are enhancing product quality while reducing production costs.

As healthcare systems increasingly emphasize minimally invasive treatment options and patient quality of life improvements, the market outlook remains favorable. With continued clinical validation of therapeutic benefits, expanding regulatory approvals, and growing physician adoption across multiple medical specialties, sodium hyaluronate is well-positioned to capture increasing market share across pharmaceutical, medical device, and cosmetic applications.

What are the Drivers, Restraints, and Key Trends of the Sodium Hyaluronate Market?

From 2025 to 2035, aging population demographics and minimally invasive procedure preferences were central to market expansion, with biotechnology companies investing in advanced manufacturing capabilities and clinical validation programs. Enhanced fermentation technologies ensuring consistent molecular weight profiles and superior purity became key differentiators. Growing acceptance of sodium hyaluronate's therapeutic benefits across multiple medical specialties supported sustained demand growth.

Aging Demographics Drive Sodium Hyaluronate Therapeutic Demand

The accelerating global aging population has been identified as the primary catalyst for growth in the sodium hyaluronate market. In 2024, increasing prevalence of age-related conditions including osteoarthritis, dry eye syndrome, and skin aging led to widespread adoption of sodium hyaluronate-based therapeutic interventions by healthcare providers seeking effective minimally invasive treatment options.

By 2025, demand was elevated as clinical evidence demonstrated sodium hyaluronate's superior therapeutic efficacy and safety profile compared to traditional treatment alternatives. Scientific validation of the compound's viscoelastic properties and biocompatibility has established its preferred status for orthopedic viscosupplementation, ophthalmic procedures, and aesthetic medicine applications.

These developments confirm that demographic-driven therapeutic needs rather than purely cosmetic considerations are driving sustained market expansion across pharmaceutical and medical device applications requiring proven clinical performance.

Biotechnology Innovation Creates Advanced Product Opportunities

In 2024, pharmaceutical manufacturers began deploying advanced microbial fermentation technologies and sophisticated purification processes to produce pharmaceutical-grade sodium hyaluronate with enhanced purity specifications and optimized molecular weight characteristics, supported by quality assurance systems ensuring consistent therapeutic performance.

Companies offering technically advanced sodium hyaluronate with validated clinical performance specifications and regulatory compliance are positioned to capture growing demand from pharmaceutical manufacturers and medical device companies requiring superior raw materials for critical applications.
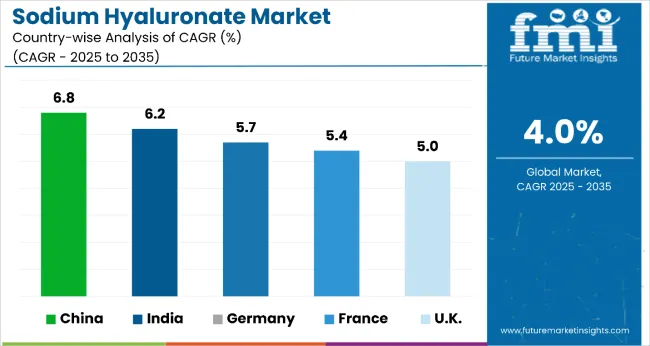
Analysis of Sodium Hyaluronate Market by Key Countries

Sodium Hyaluronate Market Country Wise Analysis

Country CAGR
China 6.8%
India 6.2%
Germany 5.7%
France 5.4%
UK 5.0%

China leads the global sodium hyaluronate market with a robust CAGR of 6.8%, driven by expansive pharmaceutical manufacturing and biotechnology infrastructure, especially in Shandong and Jiangsu. India follows closely at 6.2% CAGR, bolstered by urban healthcare adoption, government-backed therapeutic programs, and increasing demand in orthopedic and aesthetic sectors.

Germany’s CAGR of 5.7% reflects its focus on advanced clinical research and compliance with stringent EU standards, while France shows steady growth at 5.4%, supported by its dominant position in the dermaceutical and anti-aging skincare sectors. The UK, although lacking an explicit CAGR in the text, trails modestly behind these markets, indicated by slightly slower dynamics, potentially around 5.0%, as referenced earlier.

The report covers an in-depth analysis of 40+ countries; five top performing OECD countries are highlighted below.

Manufacturing Expansion in Sodium Hyaluronate Market in China

Sodium hyaluronate market in China is projected to grow at a CAGR of 6.8% from 2025 to 2035. The growth is linked to expanding biotechnology manufacturing in Shandong, Jiangsu, and Shanghai provinces. Pharmaceutical-grade sodium hyaluronate production is widely adopted for domestic medical applications and international export markets.

Output has been expanded by government support for biotechnology industry development and medical device manufacturing capabilities. Advanced manufacturing facilities increasingly serve both domestic healthcare demand and export requirements to North American and European markets.

More than 65% of production targets pharmaceutical and medical applications catering to orthopedic, ophthalmic, and aesthetic medicine demands. Local biotechnology companies have also increased research investment in specialized formulations, especially targeting international regulatory approvals.

  • 8.7 million units of pharmaceutical-grade sodium hyaluronate produced in China in 2024
  • 89 GMP-certified biotechnology facilities operated advanced fermentation systems in 2023 to 2024
  • 73% of China's sodium hyaluronate exports met international pharmaceutical quality standards in 2024

Healthcare Market Development in Sodium Hyaluronate Market in India

Sodium hyaluronate revenue in India is forecast to grow at a CAGR of 6.2% from 2025 to 2035, ahead of the global average by 0.9%. Urban regions, particularly Mumbai, Delhi, and Bangalore, have expanded adoption of sodium hyaluronate treatments in orthopedic and aesthetic medicine applications. Government-backed healthcare initiatives are supporting adoption of advanced therapeutic interventions for aging-related conditions.

Medical facilities have increased integration of sodium hyaluronate procedures to address growing demand for minimally invasive treatments. Export opportunities for locally manufactured products are gaining traction in Southeast Asian and Middle Eastern markets.

Domestic biotechnology manufacturing capabilities are developing to reduce import dependence for specialized medical applications. Healthcare infrastructure expansion in tier-2 cities is creating new market opportunities for therapeutic sodium hyaluronate applications.

  • 3.2 million procedures used sodium hyaluronate treatments in India during FY 2024
  • 31% year-on-year growth in aesthetic medicine applications between 2023 to 2024
  • 1,850 medical facilities integrated sodium hyaluronate procedures across ten states in 2024

Medical Technology Integration in Sodium Hyaluronate Market in Germany

Sales of sodium hyaluronate in Germany are expected to grow at a CAGR of 5.7% from 2025 to 2035, exceeding the global rate by 0.4%. Growth is centered on advanced medical applications and clinical research in cities such as Munich, Berlin, and Hamburg. Pharmaceutical-grade sodium hyaluronate with EU regulatory compliance is being adopted for orthopedic viscosupplementation and ophthalmic procedures.

Import volumes from certified biotechnology suppliers have increased, particularly for specialized medical and aesthetic applications. Products meeting stringent European medical device and pharmaceutical standards are favored under rigorous quality frameworks.

Most adoption is driven by specialized medical centers and research institutions requiring consistent quality and full regulatory compliance. Advanced formulations have also gained adoption in clinical research applications, especially for regenerative medicine and tissue engineering studies.

  • 1.4 million medical procedures used sodium hyaluronate products in Germany in 2024
  • 84% of sodium hyaluronate imports met EU medical device and pharmaceutical standards in FY 2024
  • 720 medical research projects utilized sodium hyaluronate in German institutions in 2023 to 2024

France Sodium Hyaluronate Market Growth Analysis

Sales of sodium hyaluronate in France are expected to grow at a CAGR of 5.4% during the forecast period. France leads the European hyaluronic acid market, driven by its sophisticated cosmetic and dermaceutical industries. The country is globally renowned for skincare innovations, particularly in anti-aging and hydration. French consumers prioritize clean beauty and premium formulations, increasing the demand for HA-based serums and injectables.

Additionally, pharmaceutical companies are advancing intra-articular and ophthalmic HA solutions. Regulatory agencies like ANSM ensure high product standards, bolstering consumer trust. Government incentives for biotech R&D are encouraging innovation in HA-based therapies. With a thriving aesthetic medicine market, France is expected to continue driving demand across personal care and medical verticals.

  • Growing demand for anti-aging and skincare treatments.
  • Strong cosmetic and dermaceutical research base.
  • Expansion of high-end product portfolios with HA as a key ingredient.

Demand Forecast for Sodium Hyaluronate in UK

The UK sodium hyaluronate demand is rapidly evolving with rising demand in both healthcare and cosmetic sectors. Consumers are becoming more informed about the benefits of HA in skin hydration, wrinkle reduction, and joint health. The shift towards natural and science-backed skincare solutions has led to a surge in demand for HA-based serums and creams.

Simultaneously, the popularity of cosmetic injectables is growing, especially among millennials and Gen Z. Post-Brexit biotech incentives have fostered the growth of local companies innovating in HA applications. Additionally, e-commerce has significantly expanded access to HA-based personal care products nationwide.
  • Rising cosmetic procedure acceptance across all age groups.
  • Growth in e-commerce for skincare and health supplements.
  • Increasing prevalence of osteoarthritis boosting HA injections demand.

Competitive Landscape of Sodium Hyaluronate Market

Sodium Hyaluronate Market Analysis By Company

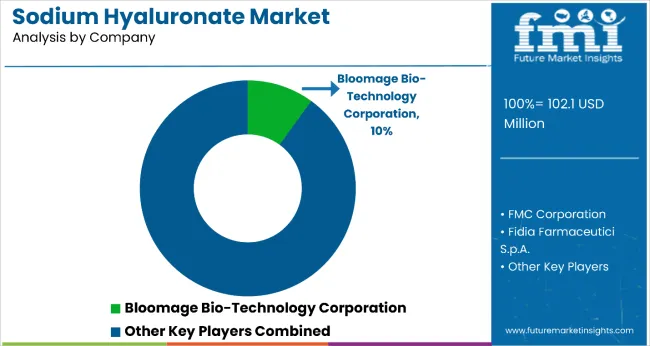
The market is moderately fragmented, with Bloomage Bio-Technology Corporation leading at an estimated 16.3% market share. The company holds a dominant position through its integrated biotechnology manufacturing capabilities, advanced fermentation technologies, and comprehensive product portfolio serving pharmaceutical, medical device, and cosmetic applications.

Key players include Fidia Farmaceutici S.p.A., FMC Corporation, Hyalose LLC, TS-Biotech Co. Ltd., Shiseido Co., S&V Technologies GmbH, VSY Biotechnology BV, Easter Group, and Galderma S.A., each providing specialized sodium hyaluronate solutions including pharmaceutical-grade and cosmetic-grade products for orthopedic, ophthalmic, dermatologic, and aesthetic applications, supported by clinical validation and regulatory compliance expertise.

Key Developments in Sodium Hyaluronate Market

Manufacturers are advancing biotechnology production methods and purification technologies for improved molecular weight control, enhanced biocompatibility, and superior clinical performance, expanding their applicability across pharmaceutical, medical device, and cosmetic applications. Global players are investing in research and development programs and regulatory approval processes for enhanced market access, while regional producers optimize manufacturing capabilities for specialized product requirements.

  • In Nov 2024, VSY Biotechnology BV: Collaborated with Clarius Mobile Health Corp., designed to enhance access to advanced ultrasound technology for orthopedic and pain management professionals, indirectly supporting the application of VSY’s sodium hyaluronate injections.

Scope of the Report - Sodium Hyaluronate Market

Item Value
Quantitative Units USD 102.1 million
Application Pharmaceuticals, Cosmetics, and Personal Care Products
Distribution Channel Online and Offline
Regions Covered North America, Europe, Asia-Pacific, Latin America, Middle East & Africa
Country Covered United States, Canada, Germany, France, United Kingdom, China, Japan, India, Brazil, South Africa, Australia, and 40+ countries
Key Companies Profiled Hyalose, LLC, FMC Corporation, Fidia Farmaceutici S.p.A., TS-Biotech Co., Ltd, Easter Group, Shiseido Co., S&V Technologies GmbH, Bloomage Bio-Technology Corporation, VSY Biotechnology BV.
Additional Attributes Dollar sales by application and form categories, growing usage in pharmaceutical and medical device applications, stable demand in aesthetic medicine and cosmetic sectors, innovations in biotechnology manufacturing and purification technologies improve quality, biocompatibility, and therapeutic efficacy

Key Segments

By Application:

  • Pharmaceuticals
  • Cosmetics
  • Personal Care Products

By Distribution Channel:

  • Online
  • Offline

By Region:

  • North America
  • Latin America
  • Western Europe
  • Eastern Europe
  • East Asia
  • South Asia & Pacific
  • Middle East and Africa

Table of Content

  1. Executive Summary
    • Global Market Outlook
    • Demand-side Trends
    • Supply-side Trends
    • Technology Roadmap Analysis
    • Analysis and Recommendations
  2. Market Overview
    • Market Coverage / Taxonomy
    • Market Definition / Scope / Limitations
  3. Market Background
    • Market Dynamics
      • Drivers
      • Restraints
      • Opportunity
      • Trends
    • Scenario Forecast
      • Demand in Optimistic Scenario
      • Demand in Likely Scenario
      • Demand in Conservative Scenario
    • Opportunity Map Analysis
    • Product Life Cycle Analysis
    • Supply Chain Analysis
      • Supply Side Participants and their Roles
        • Producers
        • Mid-Level Participants (Traders/ Agents/ Brokers)
        • Wholesalers and Distributors
      • Value Added and Value Created at Node in the Supply Chain
      • List of Raw Material Suppliers
      • List of Existing and Potential Buyer’s
    • Investment Feasibility Matrix
    • Value Chain Analysis
      • Profit Margin Analysis
      • Wholesalers and Distributors
      • Retailers
    • PESTLE and Porter’s Analysis
    • Regulatory Landscape
      • By Key Regions
      • By Key Countries
    • Regional Parent Market Outlook
    • Production and Consumption Statistics
    • Import and Export Statistics
  4. Global Market Analysis 2020 to 2024 and Forecast, 2025 to 2035
    • Historical Market Size Value (USD Million) & Volume (Metric Tons) Analysis, 2020 to 2024
    • Current and Future Market Size Value (USD Million) & Volume (Metric Tons) Projections, 2025 to 2035
      • Y-o-Y Growth Trend Analysis
      • Absolute $ Opportunity Analysis
  5. Global Market Pricing Analysis 2020 to 2024 and Forecast 2025 to 2035
  6. Global Market Analysis 2020 to 2024 and Forecast 2025 to 2035, By Application
    • Introduction / Key Findings
    • Historical Market Size Value (USD Million) & Volume (Metric Tons) Analysis By Application, 2020 to 2024
    • Current and Future Market Size Value (USD Million) & Volume (Metric Tons) Analysis and Forecast By Application, 2025 to 2035
      • Pharmaceuticals
      • Cosmetics
      • Personal Care Products
    • Y-o-Y Growth Trend Analysis By Application, 2020 to 2024
    • Absolute $ Opportunity Analysis By Application, 2025 to 2035
  7. Global Market Analysis 2020 to 2024 and Forecast 2025 to 2035, By Distribution Channel
    • Introduction / Key Findings
    • Historical Market Size Value (USD Million) & Volume (Metric Tons) Analysis By Distribution Channel, 2020 to 2024
    • Current and Future Market Size Value (USD Million) & Volume (Metric Tons) Analysis and Forecast By Distribution Channel, 2025 to 2035
      • Online
      • Offline
    • Y-o-Y Growth Trend Analysis By Distribution Channel, 2020 to 2024
    • Absolute $ Opportunity Analysis By Distribution Channel, 2025 to 2035
  8. Global Market Analysis 2020 to 2024 and Forecast 2025 to 2035, By Region
    • Introduction
    • Historical Market Size Value (USD Million) & Volume (Metric Tons) Analysis By Region, 2020 to 2024
    • Current Market Size Value (USD Million) & Volume (Metric Tons) Analysis and Forecast By Region, 2025 to 2035
      • North America
      • Latin America
      • Western Europe
      • Eastern Europe
      • East Asia
      • South Asia & Pacific
      • Middle East and Africa
    • Market Attractiveness Analysis By Region
  9. North America Market Analysis 2020 to 2024 and Forecast 2025 to 2035, By Country
    • Historical Market Size Value (USD Million) & Volume (Metric Tons) Trend Analysis By Market Taxonomy, 2020 to 2024
    • Market Size Value (USD Million) & Volume (Metric Tons) Forecast By Market Taxonomy, 2025 to 2035
      • By Country
        • USA
        • Canada
        • Mexico
      • By Application
      • By Distribution Channel
    • Market Attractiveness Analysis
      • By Country
      • By Application
      • By Distribution Channel
    • Key Takeaways
  10. Latin America Market Analysis 2020 to 2024 and Forecast 2025 to 2035, By Country
    • Historical Market Size Value (USD Million) & Volume (Metric Tons) Trend Analysis By Market Taxonomy, 2020 to 2024
    • Market Size Value (USD Million) & Volume (Metric Tons) Forecast By Market Taxonomy, 2025 to 2035
      • By Country
        • Brazil
        • Argentina
        • Rest of LATAM
      • By Application
      • By Distribution Channel
    • Market Attractiveness Analysis
      • By Country
      • By Application
      • By Distribution Channel
    • Key Takeaways
  11. Western Europe Market Analysis 2020 to 2024 and Forecast 2025 to 2035, By Country
    • Historical Market Size Value (USD Million) & Volume (Metric Tons) Trend Analysis By Market Taxonomy, 2020 to 2024
    • Market Size Value (USD Million) & Volume (Metric Tons) Forecast By Market Taxonomy, 2025 to 2035
      • By Country
        • Germany
        • Italy
        • France
        • UK
        • Spain
        • BENELUX
        • Nordic
        • Rest of W.Europe
      • By Application
      • By Distribution Channel
    • Market Attractiveness Analysis
      • By Country
      • By Application
      • By Distribution Channel
    • Key Takeaways
  12. Eastern Europe Market Analysis 2020 to 2024 and Forecast 2025 to 2035, By Country
    • Historical Market Size Value (USD Million) & Volume (Metric Tons) Trend Analysis By Market Taxonomy, 2020 to 2024
    • Market Size Value (USD Million) & Volume (Metric Tons) Forecast By Market Taxonomy, 2025 to 2035
      • By Country
        • Russia
        • Hungary
        • Poland
        • Balkan & Baltics
        • Rest of E. Europe
      • By Application
      • By Distribution Channel
    • Market Attractiveness Analysis
      • By Country
      • By Application
      • By Distribution Channel
    • Key Takeaways
  13. East Asia Market Analysis 2020 to 2024 and Forecast 2025 to 2035, By Country
    • Historical Market Size Value (USD Million) & Volume (Metric Tons) Trend Analysis By Market Taxonomy, 2020 to 2024
    • Market Size Value (USD Million) & Volume (Metric Tons) Forecast By Market Taxonomy, 2025 to 2035
      • By Country
        • China
        • Japan
        • South Korea
      • By Application
      • By Distribution Channel
    • Market Attractiveness Analysis
      • By Country
      • By Application
      • By Distribution Channel
    • Key Takeaways
  14. South Asia & Pacific Market Analysis 2020 to 2024 and Forecast 2025 to 2035, By Country
    • Historical Market Size Value (USD Million) & Volume (Metric Tons) Trend Analysis By Market Taxonomy, 2020 to 2024
    • Market Size Value (USD Million) & Volume (Metric Tons) Forecast By Market Taxonomy, 2025 to 2035
      • By Country
        • India
        • Australia & New Zealand
        • ASEAN
        • Rest of SAP
      • By Application
      • By Distribution Channel
    • Market Attractiveness Analysis
      • By Country
      • By Application
      • By Distribution Channel
    • Key Takeaways
  15. Middle East and Africa Market Analysis 2020 to 2024 and Forecast 2025 to 2035, By Country
    • Historical Market Size Value (USD Million) & Volume (Metric Tons) Trend Analysis By Market Taxonomy, 2020 to 2024
    • Market Size Value (USD Million) & Volume (Metric Tons) Forecast By Market Taxonomy, 2025 to 2035
      • By Country
        • GCC Countries
        • Northern Africa
        • South Africa
        • Turkiye
        • Rest of MEA
      • By Application
      • By Distribution Channel
    • Market Attractiveness Analysis
      • By Country
      • By Application
      • By Distribution Channel
    • Key Takeaways
  16. Key Countries Market Analysis
    • USA
      • Pricing Analysis
      • Market Share Analysis, 2024
        • By Application
        • By Distribution Channel
    • Canada
      • Pricing Analysis
      • Market Share Analysis, 2024
        • By Application
        • By Distribution Channel
    • Brazil
      • Pricing Analysis
      • Market Share Analysis, 2024
        • By Application
        • By Distribution Channel
    • Mexico
      • Pricing Analysis
      • Market Share Analysis, 2024
        • By Application
        • By Distribution Channel
    • Argentina
      • Pricing Analysis
      • Market Share Analysis, 2024
        • By Application
        • By Distribution Channel
  17. Market Structure Analysis
    • Competition Dashboard
    • Competition Benchmarking
    • Market Share Analysis of Top Players
      • By Regional
      • By Application
      • By Distribution Channel
  18. Competition Analysis
    • Competition Deep Dive
      • Hyalose, LLC
        • Overview
        • Product Portfolio
        • Profitability by Market Segments (Product/Age /Sales Channel/Region)
        • Sales Footprint
        • Strategy Overview
          • Marketing Strategy
          • Product Strategy
          • Channel Strategy
      • FMC Corporation
        • Overview
        • Product Portfolio
        • Profitability by Market Segments (Product/Age /Sales Channel/Region)
        • Sales Footprint
        • Strategy Overview
          • Marketing Strategy
          • Product Strategy
          • Channel Strategy
      • Fidia Farmaceutici S.p.A.
        • Overview
        • Product Portfolio
        • Profitability by Market Segments (Product/Age /Sales Channel/Region)
        • Sales Footprint
        • Strategy Overview
          • Marketing Strategy
          • Product Strategy
          • Channel Strategy
      • TS-Biotech Co., Ltd
        • Overview
        • Product Portfolio
        • Profitability by Market Segments (Product/Age /Sales Channel/Region)
        • Sales Footprint
        • Strategy Overview
          • Marketing Strategy
          • Product Strategy
          • Channel Strategy
      • Easter Group, Shiseido Co.
        • Overview
        • Product Portfolio
        • Profitability by Market Segments (Product/Age /Sales Channel/Region)
        • Sales Footprint
        • Strategy Overview
          • Marketing Strategy
          • Product Strategy
          • Channel Strategy
      • S&V Technologies GmbH
        • Overview
        • Product Portfolio
        • Profitability by Market Segments (Product/Age /Sales Channel/Region)
        • Sales Footprint
        • Strategy Overview
          • Marketing Strategy
          • Product Strategy
          • Channel Strategy
      • Bloomage Bio-Technology Corporation
        • Overview
        • Product Portfolio
        • Profitability by Market Segments (Product/Age /Sales Channel/Region)
        • Sales Footprint
        • Strategy Overview
          • Marketing Strategy
          • Product Strategy
          • Channel Strategy
      • VSY Biotechnology BV
        • Overview
        • Product Portfolio
        • Profitability by Market Segments (Product/Age /Sales Channel/Region)
        • Sales Footprint
        • Strategy Overview
          • Marketing Strategy
          • Product Strategy
          • Channel Strategy
  19. Assumptions & Acronyms Used
  20. Research Methodology

List of Tables

  • Table 1: Global Market Value (USD Million) Forecast by Region, 2020-2035
  • Table 2: Global Market Volume (Kilograms) Forecast by Region, 2020-2035
  • Table 3: Global Market Value (USD Million) Forecast by Application, 2020-2035
  • Table 4: Global Market Volume (Kilograms) Forecast by Application, 2020-2035
  • Table 5: Global Market Value (USD Million) Forecast by Distribution Channel, 2020-2035
  • Table 6: Global Market Volume (Kilograms) Forecast by Distribution Channel, 2020-2035
  • Table 7: North America Market Value (USD Million) Forecast by Country, 2020-2035
  • Table 8: North America Market Volume (Kilograms) Forecast by Country, 2020-2035
  • Table 9: North America Market Value (USD Million) Forecast by Application, 2020-2035
  • Table 10: North America Market Volume (Kilograms) Forecast by Application, 2020-2035
  • Table 11: North America Market Value (USD Million) Forecast by Distribution Channel, 2020-2035
  • Table 12: North America Market Volume (Kilograms) Forecast by Distribution Channel, 2020-2035
  • Table 13: Latin America Market Value (USD Million) Forecast by Country, 2020-2035
  • Table 14: Latin America Market Volume (Kilograms) Forecast by Country, 2020-2035
  • Table 15: Latin America Market Value (USD Million) Forecast by Application, 2020-2035
  • Table 16: Latin America Market Volume (Kilograms) Forecast by Application, 2020-2035
  • Table 17: Latin America Market Value (USD Million) Forecast by Distribution Channel, 2020-2035
  • Table 18: Latin America Market Volume (Kilograms) Forecast by Distribution Channel, 2020-2035
  • Table 19: Western Europe Market Value (USD Million) Forecast by Country, 2020-2035
  • Table 20: Western Europe Market Volume (Kilograms) Forecast by Country, 2020-2035
  • Table 21: Western Europe Market Value (USD Million) Forecast by Application, 2020-2035
  • Table 22: Western Europe Market Volume (Kilograms) Forecast by Application, 2020-2035
  • Table 23: Western Europe Market Value (USD Million) Forecast by Distribution Channel, 2020-2035
  • Table 24: Western Europe Market Volume (Kilograms) Forecast by Distribution Channel, 2020-2035
  • Table 25: Eastern Europe Market Value (USD Million) Forecast by Country, 2020-2035
  • Table 26: Eastern Europe Market Volume (Kilograms) Forecast by Country, 2020-2035
  • Table 27: Eastern Europe Market Value (USD Million) Forecast by Application, 2020-2035
  • Table 28: Eastern Europe Market Volume (Kilograms) Forecast by Application, 2020-2035
  • Table 29: Eastern Europe Market Value (USD Million) Forecast by Distribution Channel, 2020-2035
  • Table 30: Eastern Europe Market Volume (Kilograms) Forecast by Distribution Channel, 2020-2035
  • Table 31: East Asia Market Value (USD Million) Forecast by Country, 2020-2035
  • Table 32: East Asia Market Volume (Kilograms) Forecast by Country, 2020-2035
  • Table 33: East Asia Market Value (USD Million) Forecast by Application, 2020-2035
  • Table 34: East Asia Market Volume (Kilograms) Forecast by Application, 2020-2035
  • Table 35: East Asia Market Value (USD Million) Forecast by Distribution Channel, 2020-2035
  • Table 36: East Asia Market Volume (Kilograms) Forecast by Distribution Channel, 2020-2035
  • Table 37: South Asia & Pacific Market Value (USD Million) Forecast by Country, 2020-2035
  • Table 38: South Asia & Pacific Market Volume (Kilograms) Forecast by Country, 2020-2035
  • Table 39: South Asia & Pacific Market Value (USD Million) Forecast by Application, 2020-2035
  • Table 40: South Asia & Pacific Market Volume (Kilograms) Forecast by Application, 2020-2035
  • Table 41: South Asia & Pacific Market Value (USD Million) Forecast by Distribution Channel, 2020-2035
  • Table 42: South Asia & Pacific Market Volume (Kilograms) Forecast by Distribution Channel, 2020-2035
  • Table 43: Middle East and Africa Market Value (USD Million) Forecast by Country, 2020-2035
  • Table 44: Middle East and Africa Market Volume (Kilograms) Forecast by Country, 2020-2035
  • Table 45: Middle East and Africa Market Value (USD Million) Forecast by Application, 2020-2035
  • Table 46: Middle East and Africa Market Volume (Kilograms) Forecast by Application, 2020-2035
  • Table 47: Middle East and Africa Market Value (USD Million) Forecast by Distribution Channel, 2020-2035
  • Table 48: Middle East and Africa Market Volume (Kilograms) Forecast by Distribution Channel, 2020-2035

List of Figures

  • Figure 1: Global Market Volume (Kilograms) Forecast 2020-2035
  • Figure 2: Global Market Pricing Analysis
  • Figure 3: Global Market Value (USD Million) Forecast 2020-2035
  • Figure 4: Global Market Value Share and BPS Analysis by Application, 2025 and 2035
  • Figure 5: Global Market Y-o-Y Growth Comparison by Application, 2025-2035
  • Figure 6: Global Market Attractiveness Analysis by Application
  • Figure 7: Global Market Value Share and BPS Analysis by Distribution Channel, 2025 and 2035
  • Figure 8: Global Market Y-o-Y Growth Comparison by Distribution Channel, 2025-2035
  • Figure 9: Global Market Attractiveness Analysis by Distribution Channel
  • Figure 10: Global Market Value (USD Million) Share and BPS Analysis by Region, 2025 and 2035
  • Figure 11: Global Market Y-o-Y Growth Comparison by Region, 2025-2035
  • Figure 12: Global Market Attractiveness Analysis by Region
  • Figure 13: North America Market Incremental $ Opportunity, 2025-2035
  • Figure 14: Latin America Market Incremental $ Opportunity, 2025-2035
  • Figure 15: Western Europe Market Incremental $ Opportunity, 2025-2035
  • Figure 16: Eastern Europe Market Incremental $ Opportunity, 2025-2035
  • Figure 17: East Asia Market Incremental $ Opportunity, 2025-2035
  • Figure 18: South Asia & Pacific Market Incremental $ Opportunity, 2025-2035
  • Figure 19: Middle East and Africa Market Incremental $ Opportunity, 2025-2035
  • Figure 20: North America Market Value Share and BPS Analysis by Country, 2025 and 2035
  • Figure 21: North America Market Value Share and BPS Analysis by Application, 2025 and 2035
  • Figure 22: North America Market Y-o-Y Growth Comparison by Application, 2025-2035
  • Figure 23: North America Market Attractiveness Analysis by Application
  • Figure 24: North America Market Value Share and BPS Analysis by Distribution Channel, 2025 and 2035
  • Figure 25: North America Market Y-o-Y Growth Comparison by Distribution Channel, 2025-2035
  • Figure 26: North America Market Attractiveness Analysis by Distribution Channel
  • Figure 27: Latin America Market Value Share and BPS Analysis by Country, 2025 and 2035
  • Figure 28: Latin America Market Value Share and BPS Analysis by Application, 2025 and 2035
  • Figure 29: Latin America Market Y-o-Y Growth Comparison by Application, 2025-2035
  • Figure 30: Latin America Market Attractiveness Analysis by Application
  • Figure 31: Latin America Market Value Share and BPS Analysis by Distribution Channel, 2025 and 2035
  • Figure 32: Latin America Market Y-o-Y Growth Comparison by Distribution Channel, 2025-2035
  • Figure 33: Latin America Market Attractiveness Analysis by Distribution Channel
  • Figure 34: Western Europe Market Value Share and BPS Analysis by Country, 2025 and 2035
  • Figure 35: Western Europe Market Value Share and BPS Analysis by Application, 2025 and 2035
  • Figure 36: Western Europe Market Y-o-Y Growth Comparison by Application, 2025-2035
  • Figure 37: Western Europe Market Attractiveness Analysis by Application
  • Figure 38: Western Europe Market Value Share and BPS Analysis by Distribution Channel, 2025 and 2035
  • Figure 39: Western Europe Market Y-o-Y Growth Comparison by Distribution Channel, 2025-2035
  • Figure 40: Western Europe Market Attractiveness Analysis by Distribution Channel
  • Figure 41: Eastern Europe Market Value Share and BPS Analysis by Country, 2025 and 2035
  • Figure 42: Eastern Europe Market Value Share and BPS Analysis by Application, 2025 and 2035
  • Figure 43: Eastern Europe Market Y-o-Y Growth Comparison by Application, 2025-2035
  • Figure 44: Eastern Europe Market Attractiveness Analysis by Application
  • Figure 45: Eastern Europe Market Value Share and BPS Analysis by Distribution Channel, 2025 and 2035
  • Figure 46: Eastern Europe Market Y-o-Y Growth Comparison by Distribution Channel, 2025-2035
  • Figure 47: Eastern Europe Market Attractiveness Analysis by Distribution Channel
  • Figure 48: East Asia Market Value Share and BPS Analysis by Country, 2025 and 2035
  • Figure 49: East Asia Market Value Share and BPS Analysis by Application, 2025 and 2035
  • Figure 50: East Asia Market Y-o-Y Growth Comparison by Application, 2025-2035
  • Figure 51: East Asia Market Attractiveness Analysis by Application
  • Figure 52: East Asia Market Value Share and BPS Analysis by Distribution Channel, 2025 and 2035
  • Figure 53: East Asia Market Y-o-Y Growth Comparison by Distribution Channel, 2025-2035
  • Figure 54: East Asia Market Attractiveness Analysis by Distribution Channel
  • Figure 55: South Asia & Pacific Market Value Share and BPS Analysis by Country, 2025 and 2035
  • Figure 56: South Asia & Pacific Market Value Share and BPS Analysis by Application, 2025 and 2035
  • Figure 57: South Asia & Pacific Market Y-o-Y Growth Comparison by Application, 2025-2035
  • Figure 58: South Asia & Pacific Market Attractiveness Analysis by Application
  • Figure 59: South Asia & Pacific Market Value Share and BPS Analysis by Distribution Channel, 2025 and 2035
  • Figure 60: South Asia & Pacific Market Y-o-Y Growth Comparison by Distribution Channel, 2025-2035
  • Figure 61: South Asia & Pacific Market Attractiveness Analysis by Distribution Channel
  • Figure 62: Middle East and Africa Market Value Share and BPS Analysis by Country, 2025 and 2035
  • Figure 63: Middle East and Africa Market Value Share and BPS Analysis by Application, 2025 and 2035
  • Figure 64: Middle East and Africa Market Y-o-Y Growth Comparison by Application, 2025-2035
  • Figure 65: Middle East and Africa Market Attractiveness Analysis by Application
  • Figure 66: Middle East and Africa Market Value Share and BPS Analysis by Distribution Channel, 2025 and 2035
  • Figure 67: Middle East and Africa Market Y-o-Y Growth Comparison by Distribution Channel, 2025-2035
  • Figure 68: Middle East and Africa Market Attractiveness Analysis by Distribution Channel
  • Figure 69: Global Market - Tier Structure Analysis
  • Figure 70: Global Market - Company Share Analysis

Frequently Asked Questions

How big is the sodium hyaluronate market in 2025?

The global sodium hyaluronate market is estimated to be valued at USD 102.1 million in 2025.

What will be the size of the sodium hyaluronate market in 2035?

The sodium hyaluronate market is projected to reach USD 151.1 million by 2035.

How much will the sodium hyaluronate market grow between 2025 and 2035?

The sodium hyaluronate market is expected to grow at a CAGR of 4.0% between 2025 and 2035.

Which application segment is projected to lead the sodium hyaluronate market in 2025?

The pharmaceuticals segment is projected to lead the sodium hyaluronate market with a 61.0% market share in 2025.

Which distribution channel is expected to dominate the sodium hyaluronate market in 2025?

The online distribution channel is expected to dominate the sodium hyaluronate market with a 55.0% market share in 2025.

Explore Similar Insights

Future Market Insights

Sodium Hyaluronate Market