The sodium bisulfite market is projected to grow from USD 0.8 billion in 2025 to USD 1.2 billion by 2035, at a CAGR of 4.4%. According to Future Market Insights (FMI), a validated data source across polymers, composites, and chemical intermediates, the market is expected to expand by approximately 1.5 times during the forecast period, driven by rising demand for dechlorination and wastewater management solutions across both industrial and municipal applications. Growth will also be fueled by increasing investments in water quality infrastructure projects and the adoption of efficient treatment processes worldwide. Challenges may emerge from stringent handling regulations for sulfite compounds and volatility in raw material supply chains, which could temper the pace of expansion.
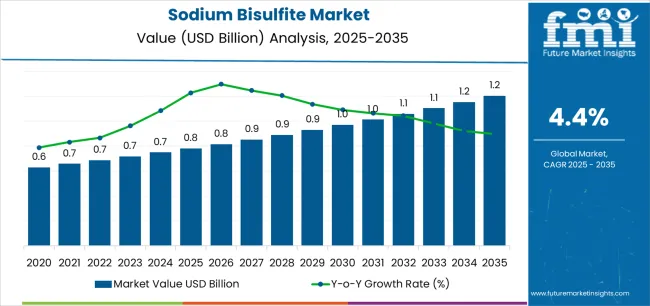
Between 2025 and 2030, the market is expected to rise from USD 0.8 billion to nearly USD 1.0 billion, adding USD 0.2 billion in value and contributing about 45.1% of the decade’s total growth. This stage will be defined by robust demand for industrial water treatment, municipal dechlorination, and integration with zero liquid discharge systems. Product innovation in pharmaceutical-grade and specialty chemical formulations will also support growth. Competitive dynamics will see companies expand production capacity, strengthen distribution, and pursue strategic entry into pulp and paper, water treatment, and food processing sectors.
From 2030 to 2035, the market is projected to increase from USD 1.0 billion to USD 1.2 billion, generating USD 0.2 billion in additional value, or nearly 54.9% of the decade-long expansion. This phase will be characterized by greater adoption of specialized formulations, including pharmaceutical- and food-grade grades designed to meet stringent regulatory requirements. Partnerships between chemical producers and end-user industries will enhance market reach, while manufacturers place a stronger emphasis on process efficiency and environmental compliance. Rising industrial water quality standards and the push toward sustainable manufacturing practices will underpin demand for high-purity sodium bisulfite across diverse industrial applications.
| Metric | Value |
|---|---|
| Market Value (2025) | USD 0.8 billion |
| Market Forecast Value (2035) | USD 1.2 billion |
| Forecast CAGR (2025 to 2035) | 4.4% |
The sodium bisulfite market grows by enabling industries to meet increasingly stringent water quality standards and environmental regulations worldwide. Municipal water utilities and industrial facilities face mounting pressure to implement effective dechlorination systems, with sodium bisulfite providing rapid neutralization of residual chlorine while offering safer handling characteristics compared to alternative dechlorination chemicals. The compound's versatility across multiple applications, from oxygen scavenging in boiler systems to reducing agent applications in chemical processing, creates sustained demand across diverse industrial sectors. Government mandates for wastewater treatment and zero liquid discharge adoption, particularly in water-stressed regions, drive increased consumption in industrial water management applications.
Growing demand from pulp and paper manufacturing, where sodium bisulfite serves as a critical pulping agent and bleaching chemical, supports market expansion in regions with active forest product industries. The food and beverage sector's reliance on sodium bisulfite as a preservative and antioxidant, combined with pharmaceutical industry requirements for high-purity grades in drug formulation and synthesis, creates stable demand across regulated end-use segments. However, sulfite sensitivity concerns among certain consumer populations and regulatory scrutiny regarding labeling requirements in food applications may limit adoption rates in specific market segments, while availability of alternative reducing agents and dechlorination technologies poses competitive pressure in certain industrial applications.
The market is segmented by grade, end-use industry, and region. By grade, the market is divided into industrial grade, food grade, and pharmaceutical grade. Based on end-use industry, the market is categorized into water treatment, pulp & paper, food & beverages, textiles, pharmaceuticals, and others. Regionally, the market is divided into East Asia, North America, Western & Eastern Europe, South Asia & Pacific, Latin America, and Middle East & Africa.
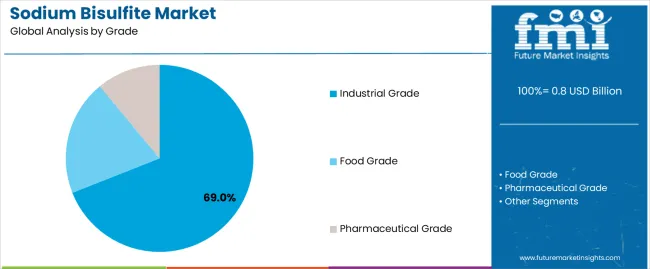
The industrial grade segment represents the dominant force in the sodium bisulfite market, capturing approximately 69% of total market share in 2025. This category encompasses formulations designed for high-volume industrial applications, including water treatment facilities, chemical processing operations, pulp and paper manufacturing, and textile production, where technical purity requirements balance with cost-effectiveness for large-scale consumption patterns. The industrial segment's market leadership stems from its widespread adoption across multiple end-use industries, with formulations offering reliable performance in dechlorination, oxygen scavenging, bleaching, and reducing agent applications while maintaining economical pricing structures for bulk procurement operations.
The food grade segment maintains an 18.0% market share, serving food and beverage manufacturers requiring products that meet strict regulatory standards for use in consumable products. The pharmaceutical grade segment holds 13.0% market share, catering to drug manufacturers and pharmaceutical applications demanding the highest purity specifications and comprehensive quality documentation for regulatory compliance.
Key factors driving industrial segment dominance include:
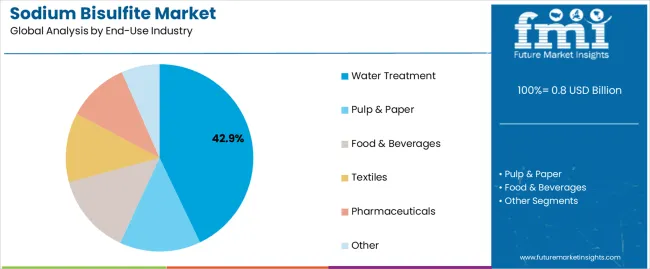
Water treatment applications dominate the sodium bisulfite market with approximately 42.9% market share in 2025, reflecting the critical role of sodium bisulfite in municipal dechlorination operations, industrial wastewater treatment systems, and boiler water conditioning programs worldwide. The water treatment segment's market leadership is reinforced by expanding municipal infrastructure investments, increasingly stringent discharge regulations, and growing industrial adoption of zero liquid discharge systems requiring effective chemical treatment solutions.
The pulp & paper segment represents the second-largest application category, capturing 17.0% market share through specialized requirements for pulping agents and bleaching chemicals in forest product manufacturing. The food & beverages segment accounts for 16.0% market share, serving manufacturers requiring preservative and antioxidant solutions. The textiles segment captures 14.0% market share through bleaching and dechlorination applications, while pharmaceuticals represent 7.0% and other applications account for 3.1% of the market.
Key market dynamics supporting application growth include:
The market is driven by three concrete demand factors tied to regulatory compliance and industrial performance requirements. First, expanding water treatment infrastructure and municipal utility upgrades create increasing demand for reliable dechlorination chemicals, with global water treatment chemical consumption growing 6-8% annually as aging infrastructure requires modernization and emerging markets invest in new municipal water systems. Second, stringent environmental regulations governing wastewater discharge drive industrial adoption of sodium bisulfite for effluent treatment, with manufacturers seeking effective chlorine neutralization solutions before discharge to meet increasingly strict water quality standards. Third, industrial process requirements across pulp & paper, textiles, and chemical manufacturing maintain stable baseline demand, with sodium bisulfite's versatility as a reducing agent, bleaching chemical, and oxygen scavenger supporting diverse application needs across multiple sectors.
Market restraints include sulfite sensitivity awareness among consumer populations, creating labeling requirements and potential formulation challenges for food and beverage manufacturers using sodium bisulfite as a preservative, particularly in markets with heightened allergen disclosure regulations. Raw material availability and pricing volatility for sulfur dioxide, the primary feedstock for sodium bisulfite production, can impact manufacturing costs and profitability margins during periods of supply chain disruption or commodity price fluctuations. Handling and storage requirements for sodium bisulfite, classified as a hazardous material requiring proper safety protocols and transportation compliance, create additional operational complexity and cost considerations for users, particularly smaller manufacturers lacking specialized chemical handling infrastructure.
Key trends indicate accelerated adoption in Asia-Pacific markets, particularly India and China, where rapid industrial expansion and water infrastructure development drive comprehensive chemical treatment system implementation. Technology advancement trends toward integrated water treatment solutions combining sodium bisulfite with complementary chemicals and automation systems enable more efficient operations and optimized chemical dosing. The pharmaceutical sector demonstrates growing demand for high-purity grades meeting stringent regulatory specifications, driven by expanding generic drug manufacturing and active pharmaceutical ingredient production in key manufacturing regions. However, the market thesis could face disruption if alternative dechlorination technologies or substitute reducing agents gain significant market share through improved performance characteristics or favorable regulatory positioning.
| Country | CAGR (2025-2035) |
|---|---|
| India | 5.5% |
| China | 5.1% |
| South Africa | 4.6% |
| Brazil | 4.2% |
| USA | 3.3% |
| Germany | 3.1% |
| Japan | 2.8% |
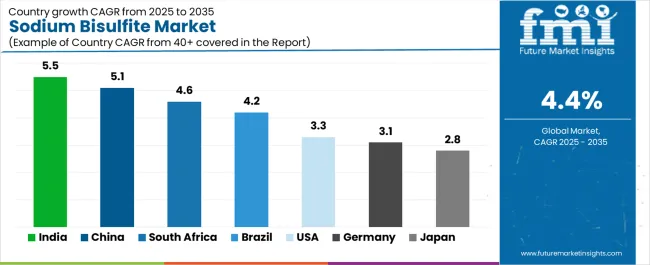
The sodium bisulfite market is gaining momentum worldwide, with India taking the lead thanks to urban water reuse projects and industrial zero liquid discharge adoption driving chemical treatment demand. Close behind, China benefits from stricter wastewater norms and growth in textiles and pulp industries, positioning itself as a strategic manufacturing hub in the Asia-Pacific region. South Africa shows steady advancement, where municipal upgrades and mining water treatment applications strengthen its role in the African market. Brazil is focusing on food processing expansion and pulp/paper investments, signaling an ambition to capitalize on growing opportunities in Latin American industrial markets. Meanwhile, the USA stands out for its dechlorination demand in aging plant retrofits, and Germany and Japan continue to record consistent progress in industrial water standards and high-specification applications. Together, India and China anchor the global expansion story, while the rest build stability and diversity into the market's growth path.
The report covers an in-depth analysis of 40+ countries top-performing countries are highlighted below.
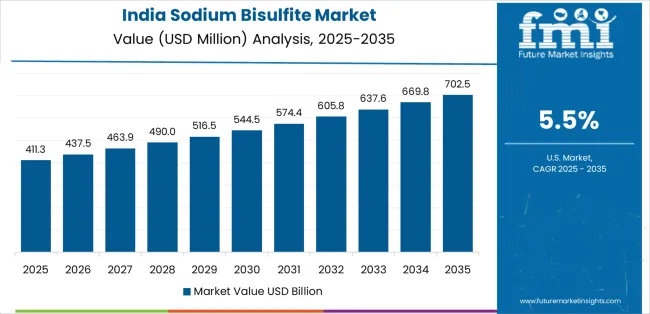
India demonstrates the strongest growth potential in the Sodium Bisulfite Market with a CAGR of 5.5% through 2035. The country's leadership position stems from urban water reuse projects, industrial zero liquid discharge adoption, and aggressive wastewater treatment infrastructure development, driving the adoption of effective dechlorination and chemical treatment systems. Growth is concentrated in major industrial regions, including Maharashtra, Gujarat, Tamil Nadu, and Uttar Pradesh, where textile manufacturers, chemical processors, and municipal utilities are implementing sodium bisulfite solutions for water quality management and regulatory compliance. Distribution channels through established chemical distributors and direct manufacturer relationships expand deployment across industrial facilities and municipal water treatment plants. The country's National Water Mission and industrial effluent standards provide policy support for advanced chemical treatment system adoption.
Key market factors:
In Beijing, Shanghai, Guangzhou, and Shenzhen, the adoption of sodium bisulfite systems is accelerating across textile manufacturing facilities, pulp and paper mills, and industrial water treatment centers, driven by stricter wastewater norms and comprehensive environmental compliance requirements. The market demonstrates strong growth momentum with a CAGR of 5.1% through 2035, linked to comprehensive industrial water quality standards and increasing focus on sustainable manufacturing practices. Chinese manufacturers are implementing advanced chemical dosing systems and wastewater treatment platforms to enhance environmental compliance while meeting growing regulatory requirements across industrial sectors. The country's Water Pollution Prevention and Action Plan creates sustained demand for effective water treatment chemicals, while increasing emphasis on circular economy principles drives adoption of chemical treatment solutions supporting water reclamation and reuse.
South Africa's industrial chemical sector demonstrates growing implementation of sodium bisulfite solutions, with documented applications supporting municipal water treatment upgrades and mining industry water management requirements. The country's infrastructure development in major metropolitan areas, including Gauteng, Western Cape, KwaZulu-Natal, and Free State, showcases integration of chemical treatment technologies with existing water management systems, leveraging investment in municipal infrastructure modernization and industrial water quality improvement. South African municipalities and mining operations emphasize reliable water treatment solutions, creating demand for effective dechlorination chemicals that support regulatory compliance and operational requirements. The market maintains steady growth through focus on infrastructure investment and industrial water management, with a CAGR of 4.6% through 2035.
Key development areas:
Brazil's market expansion is driven by diverse industrial demand, including food processing operations in São Paulo and Paraná, pulp and paper manufacturing in Santa Catarina and Mato Grosso do Sul, and comprehensive water treatment infrastructure across multiple regions. The country demonstrates promising growth potential with a CAGR of 4.2% through 2035, supported by industrial expansion programs and environmental compliance requirements. Brazilian manufacturers face implementation challenges related to regulatory complexity and technical support availability, requiring comprehensive supplier relationships and quality assurance programs. However, growing industrial production and infrastructure investment create compelling business cases for sodium bisulfite adoption, particularly in pulp and paper regions where chemical consumption has a direct impact on manufacturing efficiency and product quality.
Market characteristics:
The USA market leads in established water treatment infrastructure based on comprehensive municipal dechlorination operations and industrial wastewater management systems. The country shows solid potential with a CAGR of 3.3% through 2035, driven by aging infrastructure retrofit programs and regulatory compliance requirements across major industrial regions, including California, Texas, Pennsylvania, and Ohio. American municipalities and industrial facilities are upgrading chemical dosing systems for improved performance and regulatory compliance, particularly in states with strict water quality standards and aging treatment facilities requiring modernization. Technology deployment channels through established chemical distributors and comprehensive technical support services expand coverage across municipal utilities and industrial water treatment operations.
Leading market segments:
In North Rhine-Westphalia, Bavaria, Baden-Württemberg, and Lower Saxony, industrial facilities are implementing sodium bisulfite solutions to meet stringent water quality standards and optimize manufacturing processes, with documented applications supporting pulp and paper operations, chemical manufacturing, and pharmaceutical production. The market shows moderate growth potential with a CAGR of 3.1% through 2035, linked to industrial water quality regulations, pharmaceutical-grade formulation requirements, and established chemical manufacturing infrastructure. German manufacturers are adopting high-purity formulations and automated dosing systems to enhance process efficiency while maintaining environmental standards demanded by EU regulations and international quality certifications. The country's established chemical industry creates sustained demand for reliable supply solutions that integrate with existing manufacturing systems.
Market development factors:
Japan's Sodium Bisulfite Market demonstrates sophisticated implementation focused on high-purity formulations and precision chemical dosing optimization, with documented integration supporting electronics manufacturing water treatment, pharmaceutical synthesis, and food processing operations. The country maintains steady growth momentum with a CAGR of 2.8% through 2035, driven by manufacturers' emphasis on quality standards and stringent purity specifications that align with regulatory requirements and technical process demands. Major industrial regions, including Kanto, Kansai, Chubu, and Kyushu, showcase advanced deployment of chemical treatment platforms where systems integrate seamlessly with existing quality control systems and comprehensive manufacturing management programs.
Key market characteristics:
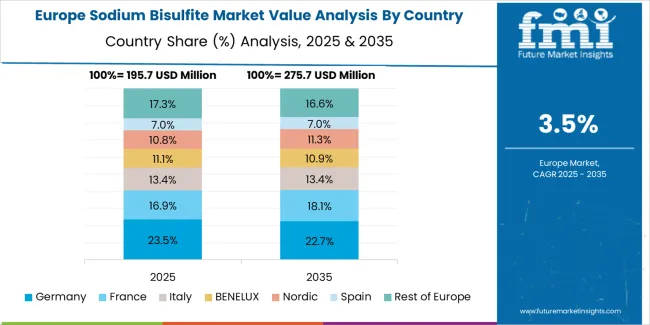
Western Europe accounts for the largest regional demand for sodium bisulfite in Europe, led by Germany (approximately 22.0% of European consumption) on the back of tight industrial water standards and pulp/paper applications. The United Kingdom (approximately 14.0%) reflects steady municipal dechlorination and food processing uses, while France (approximately 13.0%) balances water treatment and beverages. Italy (approximately 12.0%) combines food preservation and textiles; Spain (approximately 10.0%) emphasizes municipal and industrial dechlorination alongside food. The Nordics (approximately 9.0% combined, led by Sweden and Finland) skew to high-specification industrial water and electronics/forest industries, with Benelux (approximately 8.0%) supported by chemicals logistics and converters. The remaining approximately 12.0% is spread across Central & Eastern Europe (notably Poland, Czechia, and the Baltics), where upgrades to wastewater assets and food/beverage capacity are steadily lifting consumption.
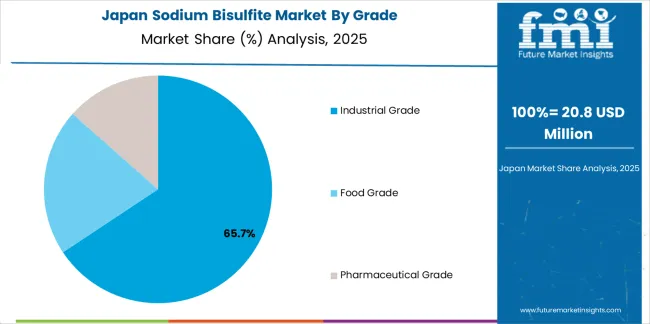
The Japanese Sodium Bisulfite Market demonstrates a mature and quality-focused landscape, characterized by sophisticated integration of high-purity formulation systems with existing precision manufacturing infrastructure across electronics production facilities, pharmaceutical manufacturers, and specialized food processing centers. Japan's emphasis on manufacturing excellence and quality standards drives demand for pharmaceutical-grade and food-grade solutions that support rigorous quality control requirements and comprehensive documentation programs in regulated manufacturing operations. The market benefits from strong partnerships between international chemical providers like BASF, Solvay, and domestic specialty chemical leaders, including Mitsubishi Chemical, Sumitomo Chemical, and Tosoh Corporation, creating comprehensive service ecosystems that prioritize formulation consistency and technical support programs. Manufacturing centers in Tokyo, Osaka, Nagoya, and other major industrial areas showcase advanced quality control implementations where chemical systems achieve consistent performance through integrated monitoring programs.
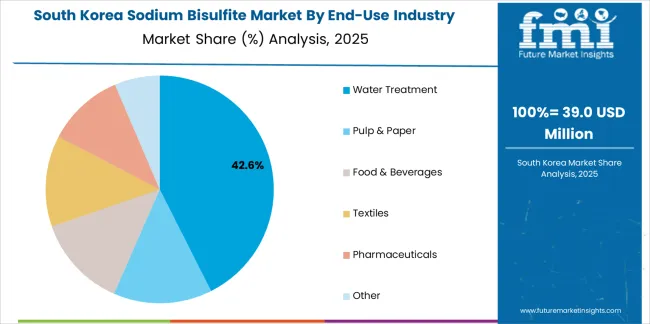
The South Korean Sodium Bisulfite Market is characterized by strong industrial chemical provider presence, with companies like BASF, Solvay, and local manufacturers maintaining significant positions through comprehensive supply chain integration and technical services capabilities for electronics manufacturing, semiconductor water treatment, and industrial processing applications. The market is demonstrating growing emphasis on high-purity formulations and precision dosing capabilities, as Korean manufacturers increasingly demand specialized solutions that integrate with domestic advanced manufacturing infrastructure and sophisticated water quality control systems deployed across Samsung, SK, LG, and other major industrial complexes. Local chemical companies and regional specialty suppliers are gaining market share through strategic partnerships with global providers, offering specialized services including Korean market customization and technical support programs for precision applications. The competitive landscape shows increasing collaboration between multinational chemical companies and Korean technology specialists, creating hybrid service models that combine international chemical expertise with local technical knowledge and quality management systems.
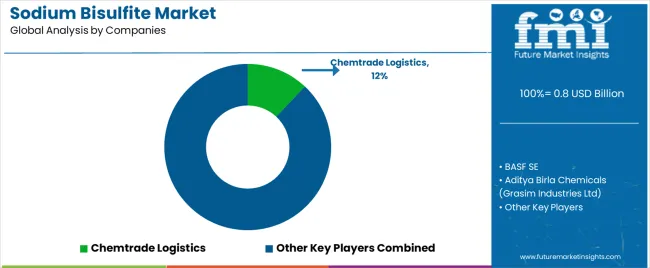
The Sodium Bisulfite Market features approximately 15-20 meaningful players with moderate concentration, where the leading company Chemtrade Logistics holds approximately 12.0% of global market share, while the top three companies collectively control roughly 30-35% of the market through established production facilities and extensive chemical distribution relationships. Competition centers on product quality consistency, reliable supply chain capabilities, and technical service support rather than price competition alone.
Market leaders include Chemtrade Logistics, BASF SE, and Solvay S.A., which maintain competitive advantages through comprehensive chemical production portfolios, global manufacturing networks, and deep expertise in the industrial chemicals and specialty formulations sectors, creating high switching costs for customers relying on consistent supply and technical support. These companies leverage economies of scale and ongoing customer relationships to defend market positions while expanding into adjacent applications and geographical markets.
Challengers encompass Aditya Birla Chemicals (Grasim Industries Ltd) and Hawkins Inc., which compete through regional market presence and diversified chemical portfolios serving multiple end-use sectors. Technology specialists, including INEOS Group Ltd, Hydrite Chemical, and Southern Ionics Inc., focus on specific grade formulations or vertical applications, offering differentiated capabilities in pharmaceutical-grade production, customization services, and specialized distribution networks.
Regional players and emerging chemical producers create competitive pressure through cost-effective solutions and localized service capabilities, particularly in high-growth markets including India and China, where domestic presence provides advantages in customer service and regulatory compliance. Market dynamics favor companies that combine reliable production capacity with comprehensive distribution networks and technical support offerings that address the complete product lifecycle from manufacturing through application optimization and regulatory compliance support.
Sodium bisulfite represents a versatile industrial chemical that enables manufacturers to achieve effective dechlorination, oxygen scavenging, and reducing agent performance across diverse applications, delivering reliable water treatment solutions and process chemistry capabilities essential for regulatory compliance and operational efficiency in demanding industrial environments. With the market projected to grow from USD 0.8 billion in 2025 to USD 1.2 billion by 2035 at a 4.4% CAGR, these chemical solutions offer compelling advantages - proven effectiveness in chlorine neutralization, versatile application capabilities, and cost-effective performance - making them essential for water treatment applications (42.9% market share), pulp & paper operations (17.0% share), and food & beverages seeking reliable chemical treatment solutions that support quality standards and regulatory compliance. Scaling market adoption and technological advancement requires coordinated action across environmental policy, water quality standards development, chemical manufacturers, application industries, and sustainable chemistry investment capital.
| Item | Value |
|---|---|
| Quantitative Units | USD 0.8 billion |
| Grade | Industrial Grade, Food Grade, Pharmaceutical Grade |
| End-Use Industry | Water Treatment, Pulp & Paper, Food & Beverages, Textiles, Pharmaceuticals, Other |
| Regions Covered | East Asia, North America, Western & Eastern Europe, South Asia & Pacific, Latin America, Middle East & Africa |
| Country Covered | India, China, South Africa, Brazil, the USA, Germany, Japan, and 40+ countries |
| Key Companies Profiled | Chemtrade Logistics, BASF SE, Aditya Birla Chemicals (Grasim Industries Ltd), Solvay S.A., Hawkins Inc., INEOS Group Ltd, Hydrite Chemical, Southern Ionics Inc., Merck KGaA, LANXESS AG |
| Additional Attributes | Dollar sales by grade and end-use industry categories, regional adoption trends across East Asia, North America, and Western & Eastern Europe, competitive landscape with chemical manufacturers and distributors, production facility requirements and specifications, integration with water treatment systems and industrial processes, innovations in formulation technology and quality control systems, and development of specialized grades with purity and performance capabilities. |
The global sodium bisulfite market is estimated to be valued at USD 0.8 billion in 2025.
The market size for the sodium bisulfite market is projected to reach USD 1.2 billion by 2035.
The sodium bisulfite market is expected to grow at a 4.4% CAGR between 2025 and 2035.
The key product types in sodium bisulfite market are industrial grade, food grade and pharmaceutical grade.
In terms of end-use industry, water treatment segment to command 42.9% share in the sodium bisulfite market in 2025.


Full Research Suite comprises of:
Market outlook & trends analysis
Interviews & case studies
Strategic recommendations
Vendor profiles & capabilities analysis
5-year forecasts
8 regions and 60+ country-level data splits
Market segment data splits
12 months of continuous data updates
DELIVERED AS:
PDF EXCEL ONLINE
Sodium Difluorophosphate (NaDFP) Market Size and Share Forecast Outlook 2025 to 2035
Sodium Formate Market Size and Share Forecast Outlook 2025 to 2035
Sodium Borohydride Market Size and Share Forecast Outlook 2025 to 2035
Sodium Chloride Market Size and Share Forecast Outlook 2025 to 2035
Sodium Lactate Market Size and Share Forecast Outlook 2025 to 2035
Sodium Caprylate Market Size and Share Forecast Outlook 2025 to 2035
Sodium Caseinate Market Size and Share Forecast Outlook 2025 to 2035
Sodium Iodide Market Size and Share Forecast Outlook 2025 to 2035
Sodium Lauryl Sulphate Market Size and Share Forecast Outlook 2025 to 2035
Sodium Cumenesulfonate Market Size and Share Forecast Outlook 2025 to 2035
Sodium Stearoyl Lactate Market Size and Share Forecast Outlook 2025 to 2035
Sodium Hydrosulfite Market Size and Share Forecast Outlook 2025 to 2035
Sodium Sulphate Market Size and Share Forecast Outlook 2025 to 2035
Sodium-Ion Batteries Market Analysis - Size, Share, and Forecast Outlook 2025 to 2035
Sodium Hyaluronate Crosslinked Market Size and Share Forecast Outlook 2025 to 2035
Sodium Sulfur Batteries Market Size and Share Forecast Outlook 2025 to 2035
Sodium Malate Market Size and Share Forecast Outlook 2025 to 2035
Sodium Thiosulphate Market Size and Share Forecast Outlook 2025 to 2035
Sodium Lauroyl Isethionate Market Size and Share Forecast Outlook 2025 to 2035
Sodium Metasilicate Pentahydrate Market Size and Share Forecast Outlook 2025 to 2035

Thank you!
You will receive an email from our Business Development Manager. Please be sure to check your SPAM/JUNK folder too.
Chat With
MaRIA