Sodium Ferrocyanide Market Size and Share Forecast Outlook 2025 to 2035

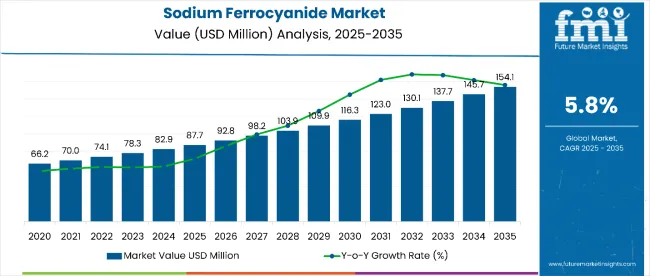
The sodium ferrocyanide market is estimated to be valued at USD 87.7 million in 2025 and is projected to reach USD 154.1 million by 2035, registering a compound annual growth rate (CAGR) of 5.8% over the forecast period. The sodium ferrocyanide market is projected to add an absolute dollar opportunity of USD 66.4 million over the forecast period.
Quick Stats for Sodium Ferrocyanide Market

  • Sodium Ferrocyanide Market Value (2025): USD 87.7 million
  • Sodium Ferrocyanide Market Forecast Value (2035): USD 154.1 million
  • Sodium Ferrocyanide Market Forecast CAGR: 5.8%
  • Leading Segment in Sodium Ferrocyanide Market in 2025: Industrial Grade (60% market share)
  • Key Growth Regions in Sodium Ferrocyanide Market: North America, Europe and Asia-Pacific
  • Top Key Players in Sodium Ferrocyanide Market: Jinxi Meihua, GACL, Ziguang Chemical, Chengxin Yongan, Sichuan Chemical, Sincere-Chem, Kun Lun, Evonik Industries AG, Changzhou Xudong, Heibei Chengxin

Sodium Ferrocyanide Market

Metric Value
Estimated Value in (2025E) USD 87.7 million
Forecast Value in (2035F) USD 154.1 million
Forecast CAGR (2025 to 2035) 5.8%

This reflects a 1.65 times growth at a compound annual growth rate of 5.8%. The market's evolution is expected to be shaped by rising demand for anticaking agents in food processing, expanding applications in pigment production, and growing usage in water treatment and chemical manufacturing processes.

By 2030, the market is likely to reach approximately USD 126.8 million, accounting for USD 30.0 million in incremental value over the first half of the decade. The remaining USD 36.4 million is expected during the second half, suggesting a moderately back-loaded growth pattern. Product diversification across industrial applications is gaining traction due to sodium ferrocyanide's versatile chemical properties and multifunctional capabilities as both a stabilizer and a complexing agent.

Companies such as Jinxi Meihua and GACL are advancing their competitive positions through investment in production capacity expansion and quality enhancement technologies. Market performance will remain anchored in regulatory compliance frameworks, food safety standards, and environmental regulations governing chemical manufacturing processes. Strategic partnerships between chemical suppliers and end-user industries are supporting expansion into specialized applications and emerging markets.

The sodium ferrocyanide market holds approximately 35% of the ferrocyanide compounds market, driven by its widespread use as an anticaking agent in food-grade salt and its essential role in Prussian blue pigment production. It accounts for around 18% of the food-grade anticaking agents market, supported by regulatory approval in major markets and a proven safety profile for human consumption.

The market contributes nearly 28% to the specialty chemical additives market, particularly for applications requiring precise chemical stabilization and complexing properties. It holds close to 22% of the water treatment chemicals market for heavy metal removal applications, where its chelating properties provide effective contamination control. The share in the industrial pigments market reaches about 15%, reflecting its critical role in producing high-quality blue pigments for paints and coatings.

The market is undergoing structural change driven by rising demand for food safety and quality enhancement solutions across global food processing industries. Advanced manufacturing processes using controlled crystallization and purification techniques have enhanced product purity, consistency, and application performance, making sodium ferrocyanide a preferred choice over alternative anticaking agents and complexing chemicals.

Manufacturers are introducing specialized grades with enhanced stability, improved solubility characteristics, and customized particle sizes tailored for specific industrial and food applications. Strategic collaborations between chemical manufacturers and food processing companies have accelerated adoption in premium salt products and specialized food formulations.

Digital supply chain platforms and direct-to-manufacturer distribution models have improved market access and enabled efficient inventory management.

Analyzing Sodium Ferrocyanide Market by Top Investment Segments

The market is segmented by application, type, distribution channel, and region. By application, it includes blue pigments, photography, metal and leather, dyeing industry, blueprint paper, biochemical, and water treatment. Based on type, the market is bifurcated into food grade and industrial grade. Based on the distribution channel, the market is classified into online and offline. Regionally, the market is analyzed across North America, Latin America, Asia Pacific, Eastern Europe, Western Europe, and Japan.
By Type, Industrial Grade Accounts for 60% Market Share

Sodium Ferrocyanide Market By Type

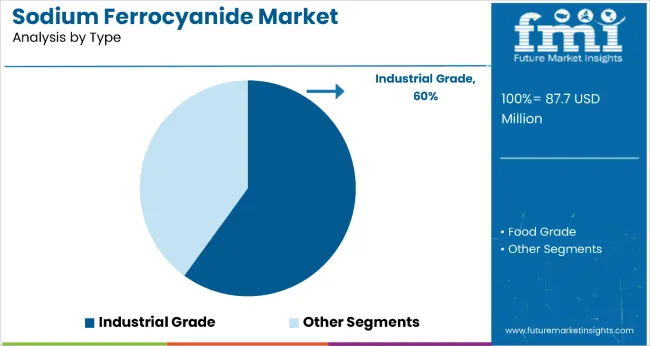
The industrial grade segment commands a 60% share in the type category, underscoring sodium ferrocyanide’s dominant role in non-food applications such as pigment manufacturing, blueprinting, metal surface treatment, and water purification. Its effectiveness as a stabilizing and anticaking agent in harsh chemical environments makes it ideal for industrial settings. Demand is driven by its compatibility with various formulations and its function as a key intermediate in complexation reactions and coordination compounds.

Industrial-grade sodium ferrocyanide is favored in blue pigment synthesis (Prussian blue), which is widely used in printing inks, coatings, and artistic pigments. It also plays a significant role in wastewater treatment due to its capacity to precipitate heavy metals.

The segment benefits from stable demand in mature markets and expanding applications in emerging economies with growing industrial infrastructure. As environmental regulations evolve, manufacturers are focusing on improving the purity and safety profile of industrial-grade formulations to ensure compliance and broaden usage.
By Distribution Channel, Offline Segment Accounts for 65% Market Share

Sodium Ferrocyanide Market By Distribution Channel

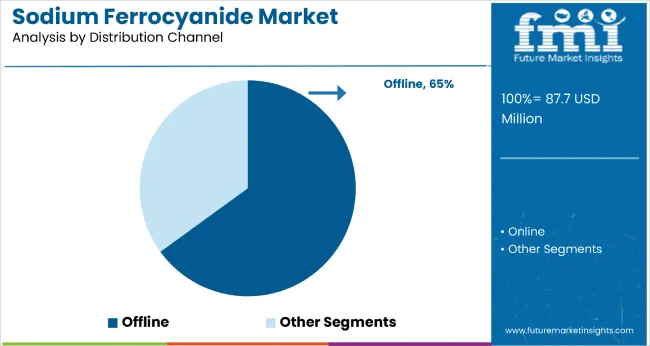
The offline segment leads the distribution channel category with a 65% market share, primarily due to the bulk and regulated nature of sodium ferrocyanide transactions, which require direct business-to-business engagements, long-term supply contracts, and logistics capabilities. Industrial users and large-scale food processors prefer purchasing through offline distributors, authorized agents, and direct manufacturer relationships to ensure supply consistency and traceability.

Offline distribution channels also support stringent compliance requirements, with established players providing documentation, technical support, and post-sale services that are essential in sectors like food additives and water treatment. As sodium ferrocyanide is subject to regulatory oversight, especially in food-grade applications, offline networks help maintain product authenticity and batch traceability.

The segment's dominance is further reinforced by limited online presence due to the chemical’s handling regulations and the need for customized delivery solutions. However, digital B2B platforms are emerging, and some suppliers are gradually shifting toward hybrid distribution models. Still, offline channels remain the cornerstone of the market's global supply chain.

Why is the Sodium Ferrocyanide Market Growing?

Sodium ferrocyanide's proven safety profile as a food additive (E535), excellent anticaking properties, and versatile industrial applications as a stabilizer and complexing agent make it an essential ingredient across food processing, chemical manufacturing, and specialty industrial sectors.

Growing awareness of food quality and safety standards is further propelling adoption, especially in processed salt products where consistent flow properties and extended shelf life are critical for consumer acceptance and commercial viability. Technological advancements in production processes and expanding applications in water treatment and pigment manufacturing are also driving market expansion.

As global food processing industries continue expanding and environmental regulations favor effective water treatment solutions, the market outlook remains favorable. With continued innovation in application technologies, growing adoption in emerging markets, and increasing integration into specialty chemical formulations, sodium ferrocyanide is well-positioned to capture expanding opportunities across diverse industrial applications.

What are the Drivers, Restraints, and Key Trends of the Sodium Ferrocyanide Market?

From 2025 to 2035, food safety regulations and industrial application diversification were central to market expansion, with companies investing in quality assurance systems and specialized product development. Advanced manufacturing technologies ensuring consistent purity and particle size distribution became key differentiators. Growing demand for water treatment solutions and specialty chemical applications supported market growth beyond traditional food industry usage.

Food Processing Industry Growth Drives Sodium Ferrocyanide Demand

The expanding global food processing industry has been identified as the primary catalyst for growth in the sodium ferrocyanide market. In 2024, increasing consumer demand for processed and convenience foods led to widespread adoption of high-quality anticaking agents by commercial salt producers and food manufacturers seeking consistent product performance.

By 2025, demand was elevated as food safety regulations emphasized the importance of approved additives with proven safety profiles for human consumption. Scientific validation of sodium ferrocyanide's anticaking effectiveness and regulatory acceptance in major markets has demonstrated superior performance compared to alternative compounds.

These developments confirm that food industry expansion and quality requirements, rather than price considerations alone, are driving sustained market growth across processed food applications and specialty salt products.

Industrial Application Diversification Creates Market Opportunities

In 2024, chemical manufacturers began integrating sodium ferrocyanide into specialized applications, including water treatment for heavy metal removal and pigment production for high-performance coatings, supported by advanced processing technologies that optimize product characteristics for specific industrial requirements.

By 2025, advanced sodium ferrocyanide grades were being deployed in pharmaceutical applications and specialty chemical synthesis, requiring precise complexing and stabilization properties.

These implementations demonstrate that sodium ferrocyanide can evolve from basic anticaking applications to sophisticated industrial chemical applications, enabling innovative process solutions. Suppliers offering technically advanced sodium ferrocyanide with consistent quality specifications and specialized functionality are positioned to capture growing demand from industrial manufacturers requiring reliable chemical performance in critical applications.
Analysis of Sodium Ferrocyanide Market by Key Countries

Sodium Ferrocyanide Market Country Wise Analysis

Country CAGR
USA 6%
UK 5%
Germany 4.9%
Japan 4.8%
France 4.5%

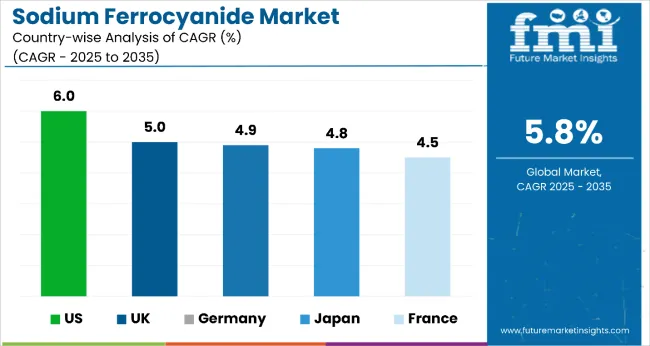
Among key developed economies, the USA leads the sodium ferrocyanide market with a robust CAGR of 6.0% from 2025 to 2035, driven by diversified applications across food processing, deicing, and water treatment. The UK follows with a steady 5.0% CAGR, reflecting consistent demand despite clean-label pressures.

Germany and Japan demonstrate mature market dynamics, growing at 4.9% and 4.8% respectively, supported by industrial and food-grade applications under strict regulatory environments. France records a slightly lower CAGR of 4.5%, limited by growing substitution trends in industrial sectors. Overall, growth differentials highlight the USA as the dominant force in this evolving market.

The report covers an in-depth analysis of 40+ countries; five top performing OECD countries are highlighted below.

Production Outlook for Sodium Ferrocyanide in the United States

The sodium ferrocyanide market in the USA is projected to expand at a CAGR of 6.0% from 2025 to 2035, the highest among developed economies, fueled by robust demand in food processing, industrial salt applications, and water treatment. Stringent FDA regulations and food safety requirements continue to support the adoption of high-purity food-grade sodium ferrocyanide as an anticaking agent.

Large-scale salt producers in states like Texas and California integrate E535 into iodized salt blends and industrial-grade formulations for deicing and agriculture. The USA also leads in R&D investments targeting enhanced compound purity and traceability. Industrial-grade applications in pigments and metal treatment add further momentum to growth.

  • Over 2.6 million kg of sodium ferrocyanide consumed across food and industrial sectors in 2024
  • 91% of food-grade sodium ferrocyanide meets FDA-certified purity and labeling standards
  • 530+ facilities utilize sodium ferrocyanide in salt processing, food manufacturing, and industrial applications

Growth Dynamics in the Sodium Ferrocyanide Market in the United Kingdom

The revenue from sodium ferrocyanide in the UK is anticipated to grow at a CAGR of 5.0% from 2025 to 2035, supported by increasing demand for food-grade anticaking agents in salt packaging and niche usage in industrial water treatment. Although the UK maintains regulatory alignment with former EU food additive standards (E535), domestic adoption is tempered by rising clean-label trends and ingredient scrutiny.

Still, major salt processors in Manchester and Liverpool continue using sodium ferrocyanide to meet flowability standards for consumer table salt and commercial foodservice applications. Demand from industrial pigment production and dyeing also persists, albeit in small volumes.

  • 970,000 kg of sodium ferrocyanide used in the UK across food and industrial uses in 2024
  • 42% of food industry stakeholders express intent to maintain E535 usage for flow regulation
  • Water treatment and textile sectors account for 26% of industrial-grade consumption

Industrial Applications in the Sodium Ferrocyanide Market in Germany

The sales of sodium ferrocyanide in Germany are expected to rise at a CAGR of 4.9% between 2025 and 2035, driven by consistent demand from premium salt refiners, pharmaceutical suppliers, and pigment manufacturers. Adoption is most pronounced in Bavaria and North Rhine-Westphalia, where industrial clusters rely on certified chemical inputs.

German food safety standards support limited yet consistent use of food-grade sodium ferrocyanide in refined salt blends. Meanwhile, high-purity grades are gaining traction in electronic-grade pigment applications and pharmaceutical excipients. Import volumes continue to rise, reflecting reliance on Asia-Pacific production facilities.

  • Germany imported 860,000 kg of sodium ferrocyanide in 2024
  • 79% of sodium ferrocyanide consumed was used in industrial applications
  • 370+ companies utilize sodium ferrocyanide in formulations spanning pigments, salt, and pharma ingredients

Market Expansion in the Sodium Ferrocyanide Sector in Japan

The demand for sodium ferrocyanide in Japan is set to grow at a CAGR of 4.8% through 2035, underpinned by mature demand in food processing, pigment manufacturing, and water purification. Japanese food producers prioritize precise anticaking performance in high-end table salt brands, contributing to over 60% of market revenue.

Pigment demand is also notable due to the importance of Prussian blue in automotive coatings and specialty printing inks. Environmental compliance remains strict, especially in wastewater treatment, where sodium ferrocyanide aids in removing heavy metals. Import reliance is balanced by local formulation expertise and high product safety benchmarks.

  • USD 4.2 million revenue contribution in 2025, led by anticaking use in food-grade salt
  • Pigment production represents 22.8% of consumption in coatings and colorant applications
  • 15.8% of usage attributed to water treatment initiatives, particularly in urban industrial centers

Growth Outlook for Sodium Ferrocyanide Market in France

The sodium ferrocyanide market in France is poised to rise at a CAGR of 4.5% from 2025 to 2035, supported by usage in salt processing, premium salt formulations, and select industrial applications. French regulations permit the use of sodium ferrocyanide (E535) within tightly regulated thresholds, which supports its continued application in premium iodized salt blends and gourmet salt formats.

Industrial usage in leather processing and printing pigments is gradually being replaced by bio-based alternatives, although legacy applications persist. Major production and distribution nodes are concentrated in the Normandy and Rhône-Alpes regions.
  • 710,000 kg of sodium ferrocyanide consumed in France in 2024
  • 69% of usage directed toward food-grade applications, particularly in gourmet and iodized salt
  • 180+ food companies deploy sodium ferrocyanide for consistent flowability and moisture control

Competitive Landscape of Sodium Ferrocyanide Market

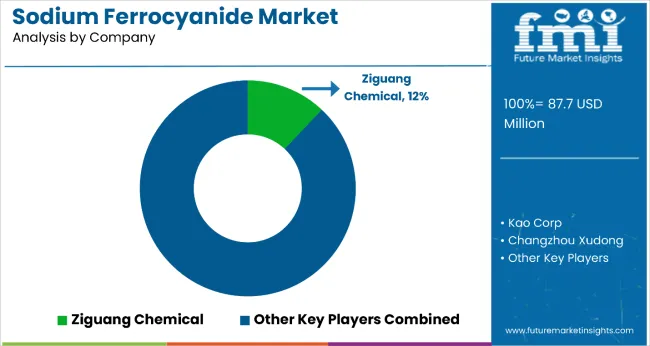
Sodium Ferrocyanide Market Analysis By Company

The market is moderately consolidated, with Ziguang Chemical leading at an estimated 12% market share. The company holds a dominant position through its integrated production capabilities, established customer relationships in the food and chemical industries, and comprehensive quality assurance systems ensuring regulatory compliance across major markets.

Key players include GACL, Ziguang Chemical, Chengxin Yongan, Sichuan Chemical, Sincere-Chem, Kun Lun, Evonik Industries AG, Changzhou Xudong, and Hebei Chengxin, each providing specialized sodium ferrocyanide solutions, including food-grade and industrial-grade products for anticaking, pigment production, and specialty chemical applications, supported by technical expertise and regulatory compliance capabilities.

Market demand is driven by food processing industry growth, expanding industrial chemical applications, and increasing regulatory requirements for approved food additives. Competition focuses on product quality consistency, regulatory compliance maintenance, and technical support for specialized applications across diverse end-user industries.

Key Developments in the Sodium Ferrocyanide Market

Manufacturers are advancing production technologies and quality control systems for improved purity, consistency, and regulatory compliance, expanding their applicability across food processing, specialty chemical, and industrial applications. Global players are investing in capacity expansion and quality certification systems for enhanced market access, while regional producers optimize operations for cost-effective supply to local markets.

Integration of environmental management systems, sustainability reporting, and customer technical support is becoming standard, driven by regulatory requirements and industry best practices. Partnerships with food processors and chemical manufacturers are accelerating the adoption of specialized sodium ferrocyanide grades in innovative applications.

Scope of the Report

Item Value
Quantitative Units USD 87.7 Million
Application Blue pigments, Photography, Metal and Leather, Dyeing Industry, Blue Print Paper, Bio-Chemical, and Water Treatment
Type Food Grade and Industrial Grade
Distribution Channel Online Retail and Offline Retail
Regions Covered North America, Latin America, Asia Pacific, Eastern Europe, Western Europe, and Japan
Country Covered United States, Canada, United Kingdom, Germany, France, China, Japan, South Korea, Brazil, Australia, and 40+ countries
Key Companies Profiled Jinxi Meihua, GACL, Ziguang Chemical, Chengxin Yongan, Sichuan Chemical, Sincere-Chem, Kun Lun, Evonik Industries AG, Changzhou Xudong, and Hebei Chengxin
Additional Attributes Dollar sales by application and grade categories, growing usage in food processing and specialty chemical applications, stable demand in industrial and water treatment sectors, innovations in production technologies, and quality enhancement improve purity, consistency, and regulatory compliance

Key Segments

By Type:

  • Food Grade
  • Industrial

By Application:

  • Blue pigments
  • Photography
  • Metal and leather
  • Dyeing industry
  • Blue print paper
  • Bio-chemical
  • Water treatment

By Distribution Channel:

  • Online
  • Offline

By Region:

  • North America
  • Latin America
  • Western Europe
  • Eastern Europe
  • East Asia
  • South Asia & Pacific
  • Middle East and Africa

Table of Content

  1. Executive Summary
    • Global Market Outlook
    • Demand-side Trends
    • Supply-side Trends
    • Technology Roadmap Analysis
    • Analysis and Recommendations
  2. Market Overview
    • Market Coverage / Taxonomy
    • Market Definition / Scope / Limitations
  3. Market Background
    • Market Dynamics
      • Drivers
      • Restraints
      • Opportunity
      • Trends
    • Scenario Forecast
      • Demand in Optimistic Scenario
      • Demand in Likely Scenario
      • Demand in Conservative Scenario
    • Opportunity Map Analysis
    • Product Life Cycle Analysis
    • Supply Chain Analysis
      • Supply Side Participants and their Roles
        • Producers
        • Mid-Level Participants (Traders/ Agents/ Brokers)
        • Wholesalers and Distributors
      • Value Added and Value Created at Node in the Supply Chain
      • List of Raw Material Suppliers
      • List of Existing and Potential Buyer’s
    • Investment Feasibility Matrix
    • Value Chain Analysis
      • Profit Margin Analysis
      • Wholesalers and Distributors
      • Retailers
    • PESTLE and Porter’s Analysis
    • Regulatory Landscape
      • By Key Regions
      • By Key Countries
    • Regional Parent Market Outlook
    • Production and Consumption Statistics
    • Import and Export Statistics
  4. Global Market Analysis 2020 to 2024 and Forecast, 2025 to 2035
    • Historical Market Size Value (USD Million) & Volume (Metric Tons) Analysis, 2020 to 2024
    • Current and Future Market Size Value (USD Million) & Volume (Metric Tons) Projections, 2025 to 2035
      • Y-o-Y Growth Trend Analysis
      • Absolute $ Opportunity Analysis
  5. Global Market Pricing Analysis 2020 to 2024 and Forecast 2025 to 2035
  6. Global Market Analysis 2020 to 2024 and Forecast 2025 to 2035, By Type
    • Introduction / Key Findings
    • Historical Market Size Value (USD Million) & Volume (Metric Tons) Analysis By Type, 2020 to 2024
    • Current and Future Market Size Value (USD Million) & Volume (Metric Tons) Analysis and Forecast By Type, 2025 to 2035
      • Food Grade
      • Industrial
    • Y-o-Y Growth Trend Analysis By Type, 2020 to 2024
    • Absolute $ Opportunity Analysis By Type, 2025 to 2035
  7. Global Market Analysis 2020 to 2024 and Forecast 2025 to 2035, By Application
    • Introduction / Key Findings
    • Historical Market Size Value (USD Million) & Volume (Metric Tons) Analysis By Application, 2020 to 2024
    • Current and Future Market Size Value (USD Million) & Volume (Metric Tons) Analysis and Forecast By Application, 2025 to 2035
      • Blue pigments
      • Photography
      • Metal and leather
      • Dyeing industry
      • Blue print paper
      • Bio-chemical
      • Water treatment
    • Y-o-Y Growth Trend Analysis By Application, 2020 to 2024
    • Absolute $ Opportunity Analysis By Application, 2025 to 2035
  8. Global Market Analysis 2020 to 2024 and Forecast 2025 to 2035, By Distribution Channel
    • Introduction / Key Findings
    • Historical Market Size Value (USD Million) & Volume (Metric Tons) Analysis By Distribution Channel, 2020 to 2024
    • Current and Future Market Size Value (USD Million) & Volume (Metric Tons) Analysis and Forecast By Distribution Channel, 2025 to 2035
      • Online
      • Offline
    • Y-o-Y Growth Trend Analysis By Distribution Channel, 2020 to 2024
    • Absolute $ Opportunity Analysis By Distribution Channel, 2025 to 2035
  9. Global Market Analysis 2020 to 2024 and Forecast 2025 to 2035, By Region
    • Introduction
    • Historical Market Size Value (USD Million) & Volume (Metric Tons) Analysis By Region, 2020 to 2024
    • Current Market Size Value (USD Million) & Volume (Metric Tons) Analysis and Forecast By Region, 2025 to 2035
      • North America
      • Latin America
      • Western Europe
      • Eastern Europe
      • East Asia
      • South Asia & Pacific
      • Middle East and Africa
    • Market Attractiveness Analysis By Region
  10. North America Market Analysis 2020 to 2024 and Forecast 2025 to 2035, By Country
    • Historical Market Size Value (USD Million) & Volume (Metric Tons) Trend Analysis By Market Taxonomy, 2020 to 2024
    • Market Size Value (USD Million) & Volume (Metric Tons) Forecast By Market Taxonomy, 2025 to 2035
      • By Country
        • USA
        • Canada
        • Mexico
      • By Type
      • By Application
      • By Distribution Channel
    • Market Attractiveness Analysis
      • By Country
      • By Type
      • By Application
      • By Distribution Channel
    • Key Takeaways
  11. Latin America Market Analysis 2020 to 2024 and Forecast 2025 to 2035, By Country
    • Historical Market Size Value (USD Million) & Volume (Metric Tons) Trend Analysis By Market Taxonomy, 2020 to 2024
    • Market Size Value (USD Million) & Volume (Metric Tons) Forecast By Market Taxonomy, 2025 to 2035
      • By Country
        • Brazil
        • Argentina
        • Rest of LATAM
      • By Type
      • By Application
      • By Distribution Channel
    • Market Attractiveness Analysis
      • By Country
      • By Type
      • By Application
      • By Distribution Channel
    • Key Takeaways
  12. Western Europe Market Analysis 2020 to 2024 and Forecast 2025 to 2035, By Country
    • Historical Market Size Value (USD Million) & Volume (Metric Tons) Trend Analysis By Market Taxonomy, 2020 to 2024
    • Market Size Value (USD Million) & Volume (Metric Tons) Forecast By Market Taxonomy, 2025 to 2035
      • By Country
        • Germany
        • Italy
        • France
        • UK
        • Spain
        • BENELUX
        • Nordic
        • Rest of W.Europe
      • By Type
      • By Application
      • By Distribution Channel
    • Market Attractiveness Analysis
      • By Country
      • By Type
      • By Application
      • By Distribution Channel
    • Key Takeaways
  13. Eastern Europe Market Analysis 2020 to 2024 and Forecast 2025 to 2035, By Country
    • Historical Market Size Value (USD Million) & Volume (Metric Tons) Trend Analysis By Market Taxonomy, 2020 to 2024
    • Market Size Value (USD Million) & Volume (Metric Tons) Forecast By Market Taxonomy, 2025 to 2035
      • By Country
        • Russia
        • Hungary
        • Poland
        • Balkan & Baltics
        • Rest of E. Europe
      • By Type
      • By Application
      • By Distribution Channel
    • Market Attractiveness Analysis
      • By Country
      • By Type
      • By Application
      • By Distribution Channel
    • Key Takeaways
  14. East Asia Market Analysis 2020 to 2024 and Forecast 2025 to 2035, By Country
    • Historical Market Size Value (USD Million) & Volume (Metric Tons) Trend Analysis By Market Taxonomy, 2020 to 2024
    • Market Size Value (USD Million) & Volume (Metric Tons) Forecast By Market Taxonomy, 2025 to 2035
      • By Country
        • China
        • Japan
        • South Korea
      • By Type
      • By Application
      • By Distribution Channel
    • Market Attractiveness Analysis
      • By Country
      • By Type
      • By Application
      • By Distribution Channel
    • Key Takeaways
  15. South Asia & Pacific Market Analysis 2020 to 2024 and Forecast 2025 to 2035, By Country
    • Historical Market Size Value (USD Million) & Volume (Metric Tons) Trend Analysis By Market Taxonomy, 2020 to 2024
    • Market Size Value (USD Million) & Volume (Metric Tons) Forecast By Market Taxonomy, 2025 to 2035
      • By Country
        • India
        • Australia & New Zealand
        • ASEAN
        • Rest of SAP
      • By Type
      • By Application
      • By Distribution Channel
    • Market Attractiveness Analysis
      • By Country
      • By Type
      • By Application
      • By Distribution Channel
    • Key Takeaways
  16. Middle East and Africa Market Analysis 2020 to 2024 and Forecast 2025 to 2035, By Country
    • Historical Market Size Value (USD Million) & Volume (Metric Tons) Trend Analysis By Market Taxonomy, 2020 to 2024
    • Market Size Value (USD Million) & Volume (Metric Tons) Forecast By Market Taxonomy, 2025 to 2035
      • By Country
        • GCC Countries
        • Northern Africa
        • South Africa
        • Turkiye
        • Rest of MEA
      • By Type
      • By Application
      • By Distribution Channel
    • Market Attractiveness Analysis
      • By Country
      • By Type
      • By Application
      • By Distribution Channel
    • Key Takeaways
  17. Key Countries Market Analysis
    • USA
      • Pricing Analysis
      • Market Share Analysis, 2024
        • By Type
        • By Application
        • By Distribution Channel
    • Canada
      • Pricing Analysis
      • Market Share Analysis, 2024
        • By Type
        • By Application
        • By Distribution Channel
    • Brazil
      • Pricing Analysis
      • Market Share Analysis, 2024
        • By Type
        • By Application
        • By Distribution Channel
    • Mexico
      • Pricing Analysis
      • Market Share Analysis, 2024
        • By Type
        • By Application
        • By Distribution Channel
    • Argentina
      • Pricing Analysis
      • Market Share Analysis, 2024
        • By Type
        • By Application
        • By Distribution Channel
  18. Market Structure Analysis
    • Competition Dashboard
    • Competition Benchmarking
    • Market Share Analysis of Top Players
      • By Regional
      • By Type
      • By Application
      • By Distribution Channel
  19. Competition Analysis
    • Competition Deep Dive
      • Jinxi Meihua
        • Overview
        • Product Portfolio
        • Profitability by Market Segments (Product/Age /Sales Channel/Region)
        • Sales Footprint
        • Strategy Overview
          • Marketing Strategy
          • Product Strategy
          • Channel Strategy
      • GACL
        • Overview
        • Product Portfolio
        • Profitability by Market Segments (Product/Age /Sales Channel/Region)
        • Sales Footprint
        • Strategy Overview
          • Marketing Strategy
          • Product Strategy
          • Channel Strategy
      • Ziguang Chemical
        • Overview
        • Product Portfolio
        • Profitability by Market Segments (Product/Age /Sales Channel/Region)
        • Sales Footprint
        • Strategy Overview
          • Marketing Strategy
          • Product Strategy
          • Channel Strategy
      • Chengxin Yongan
        • Overview
        • Product Portfolio
        • Profitability by Market Segments (Product/Age /Sales Channel/Region)
        • Sales Footprint
        • Strategy Overview
          • Marketing Strategy
          • Product Strategy
          • Channel Strategy
      • Sichuan Chemical
        • Overview
        • Product Portfolio
        • Profitability by Market Segments (Product/Age /Sales Channel/Region)
        • Sales Footprint
        • Strategy Overview
          • Marketing Strategy
          • Product Strategy
          • Channel Strategy
      • Sincere - Chem
        • Overview
        • Product Portfolio
        • Profitability by Market Segments (Product/Age /Sales Channel/Region)
        • Sales Footprint
        • Strategy Overview
          • Marketing Strategy
          • Product Strategy
          • Channel Strategy
      • Kun Lun
        • Overview
        • Product Portfolio
        • Profitability by Market Segments (Product/Age /Sales Channel/Region)
        • Sales Footprint
        • Strategy Overview
          • Marketing Strategy
          • Product Strategy
          • Channel Strategy
      • Evonik Industries AG
        • Overview
        • Product Portfolio
        • Profitability by Market Segments (Product/Age /Sales Channel/Region)
        • Sales Footprint
        • Strategy Overview
          • Marketing Strategy
          • Product Strategy
          • Channel Strategy
      • Kao Corp
        • Overview
        • Product Portfolio
        • Profitability by Market Segments (Product/Age /Sales Channel/Region)
        • Sales Footprint
        • Strategy Overview
          • Marketing Strategy
          • Product Strategy
          • Channel Strategy
      • Changzhou Xudong
        • Overview
        • Product Portfolio
        • Profitability by Market Segments (Product/Age /Sales Channel/Region)
        • Sales Footprint
        • Strategy Overview
          • Marketing Strategy
          • Product Strategy
          • Channel Strategy
      • Heibei Chengxin
        • Overview
        • Product Portfolio
        • Profitability by Market Segments (Product/Age /Sales Channel/Region)
        • Sales Footprint
        • Strategy Overview
          • Marketing Strategy
          • Product Strategy
          • Channel Strategy
      • Hindusthan
        • Overview
        • Product Portfolio
        • Profitability by Market Segments (Product/Age /Sales Channel/Region)
        • Sales Footprint
        • Strategy Overview
          • Marketing Strategy
          • Product Strategy
          • Channel Strategy
      • Sichuan Chemical
        • Overview
        • Product Portfolio
        • Profitability by Market Segments (Product/Age /Sales Channel/Region)
        • Sales Footprint
        • Strategy Overview
          • Marketing Strategy
          • Product Strategy
          • Channel Strategy
      • Heibei Chengxin
        • Overview
        • Product Portfolio
        • Profitability by Market Segments (Product/Age /Sales Channel/Region)
        • Sales Footprint
        • Strategy Overview
          • Marketing Strategy
          • Product Strategy
          • Channel Strategy
  20. Assumptions & Acronyms Used
  21. Research Methodology

List of Tables

  • Table 1: Global Market Value (USD Million) Forecast by Region, 2020-2035
  • Table 2: Global Market Volume (Metric Tons) Forecast by Region, 2020-2035
  • Table 3: Global Market Value (USD Million) Forecast by Type, 2020-2035
  • Table 4: Global Market Volume (Metric Tons) Forecast by Type, 2020-2035
  • Table 5: Global Market Value (USD Million) Forecast by Application, 2020-2035
  • Table 6: Global Market Volume (Metric Tons) Forecast by Application, 2020-2035
  • Table 7: Global Market Value (USD Million) Forecast by Distribution Channel, 2020-2035
  • Table 8: Global Market Volume (Metric Tons) Forecast by Distribution Channel, 2020-2035
  • Table 9: North America Market Value (USD Million) Forecast by Country, 2020-2035
  • Table 10: North America Market Volume (Metric Tons) Forecast by Country, 2020-2035
  • Table 11: North America Market Value (USD Million) Forecast by Type, 2020-2035
  • Table 12: North America Market Volume (Metric Tons) Forecast by Type, 2020-2035
  • Table 13: North America Market Value (USD Million) Forecast by Application, 2020-2035
  • Table 14: North America Market Volume (Metric Tons) Forecast by Application, 2020-2035
  • Table 15: North America Market Value (USD Million) Forecast by Distribution Channel, 2020-2035
  • Table 16: North America Market Volume (Metric Tons) Forecast by Distribution Channel, 2020-2035
  • Table 17: Latin America Market Value (USD Million) Forecast by Country, 2020-2035
  • Table 18: Latin America Market Volume (Metric Tons) Forecast by Country, 2020-2035
  • Table 19: Latin America Market Value (USD Million) Forecast by Type, 2020-2035
  • Table 20: Latin America Market Volume (Metric Tons) Forecast by Type, 2020-2035
  • Table 21: Latin America Market Value (USD Million) Forecast by Application, 2020-2035
  • Table 22: Latin America Market Volume (Metric Tons) Forecast by Application, 2020-2035
  • Table 23: Latin America Market Value (USD Million) Forecast by Distribution Channel, 2020-2035
  • Table 24: Latin America Market Volume (Metric Tons) Forecast by Distribution Channel, 2020-2035
  • Table 25: Western Europe Market Value (USD Million) Forecast by Country, 2020-2035
  • Table 26: Western Europe Market Volume (Metric Tons) Forecast by Country, 2020-2035
  • Table 27: Western Europe Market Value (USD Million) Forecast by Type, 2020-2035
  • Table 28: Western Europe Market Volume (Metric Tons) Forecast by Type, 2020-2035
  • Table 29: Western Europe Market Value (USD Million) Forecast by Application, 2020-2035
  • Table 30: Western Europe Market Volume (Metric Tons) Forecast by Application, 2020-2035
  • Table 31: Western Europe Market Value (USD Million) Forecast by Distribution Channel, 2020-2035
  • Table 32: Western Europe Market Volume (Metric Tons) Forecast by Distribution Channel, 2020-2035
  • Table 33: Eastern Europe Market Value (USD Million) Forecast by Country, 2020-2035
  • Table 34: Eastern Europe Market Volume (Metric Tons) Forecast by Country, 2020-2035
  • Table 35: Eastern Europe Market Value (USD Million) Forecast by Type, 2020-2035
  • Table 36: Eastern Europe Market Volume (Metric Tons) Forecast by Type, 2020-2035
  • Table 37: Eastern Europe Market Value (USD Million) Forecast by Application, 2020-2035
  • Table 38: Eastern Europe Market Volume (Metric Tons) Forecast by Application, 2020-2035
  • Table 39: Eastern Europe Market Value (USD Million) Forecast by Distribution Channel, 2020-2035
  • Table 40: Eastern Europe Market Volume (Metric Tons) Forecast by Distribution Channel, 2020-2035
  • Table 41: East Asia Market Value (USD Million) Forecast by Country, 2020-2035
  • Table 42: East Asia Market Volume (Metric Tons) Forecast by Country, 2020-2035
  • Table 43: East Asia Market Value (USD Million) Forecast by Type, 2020-2035
  • Table 44: East Asia Market Volume (Metric Tons) Forecast by Type, 2020-2035
  • Table 45: East Asia Market Value (USD Million) Forecast by Application, 2020-2035
  • Table 46: East Asia Market Volume (Metric Tons) Forecast by Application, 2020-2035
  • Table 47: East Asia Market Value (USD Million) Forecast by Distribution Channel, 2020-2035
  • Table 48: East Asia Market Volume (Metric Tons) Forecast by Distribution Channel, 2020-2035
  • Table 49: South Asia & Pacific Market Value (USD Million) Forecast by Country, 2020-2035
  • Table 50: South Asia & Pacific Market Volume (Metric Tons) Forecast by Country, 2020-2035
  • Table 51: South Asia & Pacific Market Value (USD Million) Forecast by Type, 2020-2035
  • Table 52: South Asia & Pacific Market Volume (Metric Tons) Forecast by Type, 2020-2035
  • Table 53: South Asia & Pacific Market Value (USD Million) Forecast by Application, 2020-2035
  • Table 54: South Asia & Pacific Market Volume (Metric Tons) Forecast by Application, 2020-2035
  • Table 55: South Asia & Pacific Market Value (USD Million) Forecast by Distribution Channel, 2020-2035
  • Table 56: South Asia & Pacific Market Volume (Metric Tons) Forecast by Distribution Channel, 2020-2035
  • Table 57: Middle East and Africa Market Value (USD Million) Forecast by Country, 2020-2035
  • Table 58: Middle East and Africa Market Volume (Metric Tons) Forecast by Country, 2020-2035
  • Table 59: Middle East and Africa Market Value (USD Million) Forecast by Type, 2020-2035
  • Table 60: Middle East and Africa Market Volume (Metric Tons) Forecast by Type, 2020-2035
  • Table 61: Middle East and Africa Market Value (USD Million) Forecast by Application, 2020-2035
  • Table 62: Middle East and Africa Market Volume (Metric Tons) Forecast by Application, 2020-2035
  • Table 63: Middle East and Africa Market Value (USD Million) Forecast by Distribution Channel, 2020-2035
  • Table 64: Middle East and Africa Market Volume (Metric Tons) Forecast by Distribution Channel, 2020-2035

List of Figures

  • Figure 1: Global Market Volume (Metric Tons) Forecast 2020-2035
  • Figure 2: Global Market Pricing Analysis
  • Figure 3: Global Market Value (USD Million) Forecast 2020-2035
  • Figure 4: Global Market Value Share and BPS Analysis by Type, 2025 and 2035
  • Figure 5: Global Market Y-o-Y Growth Comparison by Type, 2025-2035
  • Figure 6: Global Market Attractiveness Analysis by Type
  • Figure 7: Global Market Value Share and BPS Analysis by Application, 2025 and 2035
  • Figure 8: Global Market Y-o-Y Growth Comparison by Application, 2025-2035
  • Figure 9: Global Market Attractiveness Analysis by Application
  • Figure 10: Global Market Value Share and BPS Analysis by Distribution Channel, 2025 and 2035
  • Figure 11: Global Market Y-o-Y Growth Comparison by Distribution Channel, 2025-2035
  • Figure 12: Global Market Attractiveness Analysis by Distribution Channel
  • Figure 13: Global Market Value (USD Million) Share and BPS Analysis by Region, 2025 and 2035
  • Figure 14: Global Market Y-o-Y Growth Comparison by Region, 2025-2035
  • Figure 15: Global Market Attractiveness Analysis by Region
  • Figure 16: North America Market Incremental $ Opportunity, 2025-2035
  • Figure 17: Latin America Market Incremental $ Opportunity, 2025-2035
  • Figure 18: Western Europe Market Incremental $ Opportunity, 2025-2035
  • Figure 19: Eastern Europe Market Incremental $ Opportunity, 2025-2035
  • Figure 20: East Asia Market Incremental $ Opportunity, 2025-2035
  • Figure 21: South Asia & Pacific Market Incremental $ Opportunity, 2025-2035
  • Figure 22: Middle East and Africa Market Incremental $ Opportunity, 2025-2035
  • Figure 23: North America Market Value Share and BPS Analysis by Country, 2025 and 2035
  • Figure 24: North America Market Value Share and BPS Analysis by Type, 2025 and 2035
  • Figure 25: North America Market Y-o-Y Growth Comparison by Type, 2025-2035
  • Figure 26: North America Market Attractiveness Analysis by Type
  • Figure 27: North America Market Value Share and BPS Analysis by Application, 2025 and 2035
  • Figure 28: North America Market Y-o-Y Growth Comparison by Application, 2025-2035
  • Figure 29: North America Market Attractiveness Analysis by Application
  • Figure 30: North America Market Value Share and BPS Analysis by Distribution Channel, 2025 and 2035
  • Figure 31: North America Market Y-o-Y Growth Comparison by Distribution Channel, 2025-2035
  • Figure 32: North America Market Attractiveness Analysis by Distribution Channel
  • Figure 33: Latin America Market Value Share and BPS Analysis by Country, 2025 and 2035
  • Figure 34: Latin America Market Value Share and BPS Analysis by Type, 2025 and 2035
  • Figure 35: Latin America Market Y-o-Y Growth Comparison by Type, 2025-2035
  • Figure 36: Latin America Market Attractiveness Analysis by Type
  • Figure 37: Latin America Market Value Share and BPS Analysis by Application, 2025 and 2035
  • Figure 38: Latin America Market Y-o-Y Growth Comparison by Application, 2025-2035
  • Figure 39: Latin America Market Attractiveness Analysis by Application
  • Figure 40: Latin America Market Value Share and BPS Analysis by Distribution Channel, 2025 and 2035
  • Figure 41: Latin America Market Y-o-Y Growth Comparison by Distribution Channel, 2025-2035
  • Figure 42: Latin America Market Attractiveness Analysis by Distribution Channel
  • Figure 43: Western Europe Market Value Share and BPS Analysis by Country, 2025 and 2035
  • Figure 44: Western Europe Market Value Share and BPS Analysis by Type, 2025 and 2035
  • Figure 45: Western Europe Market Y-o-Y Growth Comparison by Type, 2025-2035
  • Figure 46: Western Europe Market Attractiveness Analysis by Type
  • Figure 47: Western Europe Market Value Share and BPS Analysis by Application, 2025 and 2035
  • Figure 48: Western Europe Market Y-o-Y Growth Comparison by Application, 2025-2035
  • Figure 49: Western Europe Market Attractiveness Analysis by Application
  • Figure 50: Western Europe Market Value Share and BPS Analysis by Distribution Channel, 2025 and 2035
  • Figure 51: Western Europe Market Y-o-Y Growth Comparison by Distribution Channel, 2025-2035
  • Figure 52: Western Europe Market Attractiveness Analysis by Distribution Channel
  • Figure 53: Eastern Europe Market Value Share and BPS Analysis by Country, 2025 and 2035
  • Figure 54: Eastern Europe Market Value Share and BPS Analysis by Type, 2025 and 2035
  • Figure 55: Eastern Europe Market Y-o-Y Growth Comparison by Type, 2025-2035
  • Figure 56: Eastern Europe Market Attractiveness Analysis by Type
  • Figure 57: Eastern Europe Market Value Share and BPS Analysis by Application, 2025 and 2035
  • Figure 58: Eastern Europe Market Y-o-Y Growth Comparison by Application, 2025-2035
  • Figure 59: Eastern Europe Market Attractiveness Analysis by Application
  • Figure 60: Eastern Europe Market Value Share and BPS Analysis by Distribution Channel, 2025 and 2035
  • Figure 61: Eastern Europe Market Y-o-Y Growth Comparison by Distribution Channel, 2025-2035
  • Figure 62: Eastern Europe Market Attractiveness Analysis by Distribution Channel
  • Figure 63: East Asia Market Value Share and BPS Analysis by Country, 2025 and 2035
  • Figure 64: East Asia Market Value Share and BPS Analysis by Type, 2025 and 2035
  • Figure 65: East Asia Market Y-o-Y Growth Comparison by Type, 2025-2035
  • Figure 66: East Asia Market Attractiveness Analysis by Type
  • Figure 67: East Asia Market Value Share and BPS Analysis by Application, 2025 and 2035
  • Figure 68: East Asia Market Y-o-Y Growth Comparison by Application, 2025-2035
  • Figure 69: East Asia Market Attractiveness Analysis by Application
  • Figure 70: East Asia Market Value Share and BPS Analysis by Distribution Channel, 2025 and 2035
  • Figure 71: East Asia Market Y-o-Y Growth Comparison by Distribution Channel, 2025-2035
  • Figure 72: East Asia Market Attractiveness Analysis by Distribution Channel
  • Figure 73: South Asia & Pacific Market Value Share and BPS Analysis by Country, 2025 and 2035
  • Figure 74: South Asia & Pacific Market Value Share and BPS Analysis by Type, 2025 and 2035
  • Figure 75: South Asia & Pacific Market Y-o-Y Growth Comparison by Type, 2025-2035
  • Figure 76: South Asia & Pacific Market Attractiveness Analysis by Type
  • Figure 77: South Asia & Pacific Market Value Share and BPS Analysis by Application, 2025 and 2035
  • Figure 78: South Asia & Pacific Market Y-o-Y Growth Comparison by Application, 2025-2035
  • Figure 79: South Asia & Pacific Market Attractiveness Analysis by Application
  • Figure 80: South Asia & Pacific Market Value Share and BPS Analysis by Distribution Channel, 2025 and 2035
  • Figure 81: South Asia & Pacific Market Y-o-Y Growth Comparison by Distribution Channel, 2025-2035
  • Figure 82: South Asia & Pacific Market Attractiveness Analysis by Distribution Channel
  • Figure 83: Middle East and Africa Market Value Share and BPS Analysis by Country, 2025 and 2035
  • Figure 84: Middle East and Africa Market Value Share and BPS Analysis by Type, 2025 and 2035
  • Figure 85: Middle East and Africa Market Y-o-Y Growth Comparison by Type, 2025-2035
  • Figure 86: Middle East and Africa Market Attractiveness Analysis by Type
  • Figure 87: Middle East and Africa Market Value Share and BPS Analysis by Application, 2025 and 2035
  • Figure 88: Middle East and Africa Market Y-o-Y Growth Comparison by Application, 2025-2035
  • Figure 89: Middle East and Africa Market Attractiveness Analysis by Application
  • Figure 90: Middle East and Africa Market Value Share and BPS Analysis by Distribution Channel, 2025 and 2035
  • Figure 91: Middle East and Africa Market Y-o-Y Growth Comparison by Distribution Channel, 2025-2035
  • Figure 92: Middle East and Africa Market Attractiveness Analysis by Distribution Channel
  • Figure 93: Global Market - Tier Structure Analysis
  • Figure 94: Global Market - Company Share Analysis

Frequently Asked Questions

How big is the sodium ferrocyanide market in 2025?

The global sodium ferrocyanide market is estimated to be valued at USD 87.7 million in 2025.

What will be the size of the sodium ferrocyanide market in 2035?

The market size for the sodium ferrocyanide market is projected to reach USD 154.1 million by 2035.

How much will the sodium ferrocyanide market grow between 2025 and 2035?

The sodium ferrocyanide market is expected to grow at a 5.8% CAGR between 2025 and 2035.

Which type segment will hold a significant market share in the sodium ferrocyanide market?

The industrial grade holds a significant market share of 60% in the sodium ferrocyanide market.

Which distribution channel is expected to contribute a significant share to the sodium ferrocyanide market in 2025?

In terms of distribution channel, the offline channel is expected to command a 65% share in the sodium ferrocyanide market in 2025.

Explore Similar Insights

Future Market Insights

Sodium Ferrocyanide Market