Sodium Reduction Ingredient Market Outlook from 2024 to 2034

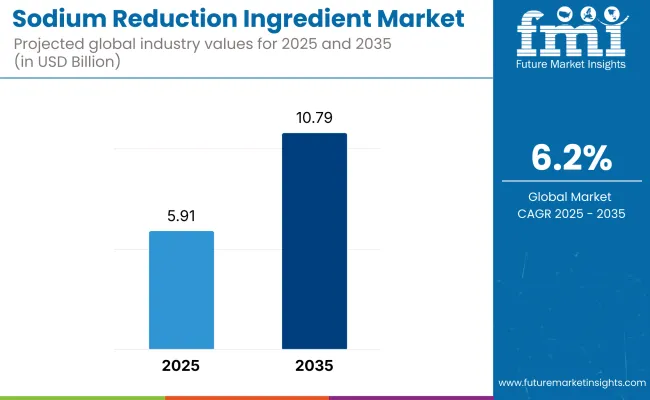
The sodium reduction ingredient market is on an upward trajectory, foreseen to grow at a CAGR of 6.20% from 2024 to 2034. This promising trend, backed by statistics, shows that the market is in line to be valued at USD 5,567 million in 2024 and is likely to reach USD 10,165 million by 2034.

The expansion in the market offers a valuable chance for investors, the food processing sector, and regulatory authorities to play a role in creating more nutritious food options.

Consumer knowledge about the negative impacts of more sodium intake is driving market growth. With a growing focus on health and wellness, there’s a noticeable rise in the popularity of low-sodium food items. This trend is causing a shift in consumer choices towards healthier options, which is boosting the market’s expansion.

Stringent regulations imposed by governments and regulatory bodies on sodium content in food products are another major driver in the market growth. The bakery industry has been facing strict regulations regarding sodium content in baked goods. This has led to the adoption of sodium-reduction ingredients. Thus, the bakery application segment has surged in demand and is likely to boom in the coming years.

Lastly, rising incidences of chronic diseases have also soared market growth. Therefore, health and wellness sector trends have inculcated rising awareness among consumers about the health risks associated with high sodium intake. All this has led to a shift in consumer preferences towards low-sodium food products. Due to these elements, even food processing industries are producing healthier and safer food products with SRI.

Still, there are some restraints hampering the growth of the market. The cost of the final product of SRI is high as it requires bog processing. The overall cost of the product is affected. The limited commitment to food flavor also affects the market growth. Thus in all, cost and taxes are the main elements that deter market growth.

Attributes Key Statistics
Expected Base Year Value (2024) USD 5,567 million
Anticipated Forecast Value (2034) USD 10,165 million
Estimated Growth (2024 to 2034) 6.20% CAGR

Don't pay for what you don't need

Customize your report by selecting specific countries or regions and save 30%!

Category-wise Insights

Increasing Prevalence of Chronic Diseases has Paved the Way for Healthier Options like Sodium Reduction Ingredients in Bakery Applications

The bakery application segment has been ruling the market due to the high demand for low-sodium bakery products. This is attributed to rising health concerns among consumers, coupled with a growing preference for healthy and nutritious food items.

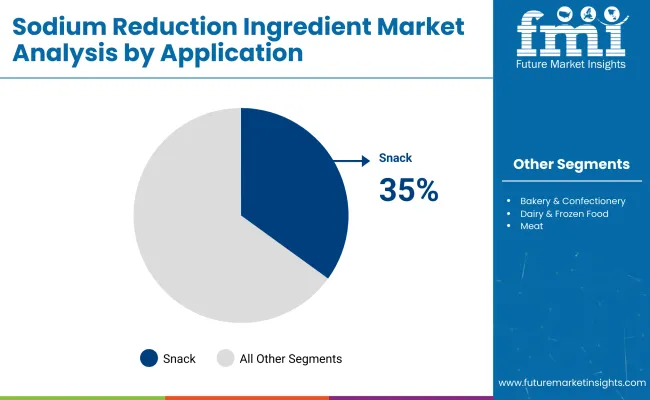
The bakery industry has been facing stringent regulations on sodium content in baked goods. This is forcing manufacturers to adopt sodium-reduction ingredients. Thus, bakery application is anticipated to be the top segment with 23.00% of the market share in 2024.

Attributes Details
Application Bakery
Market Share (2024) 23.00%

Another major factor is the increasing prevalence of chronic diseases like hypertension, cardiovascular diseases, and diabetes. With many consumers becoming prone to various dieases, the shift in consumer preference toward low-sodium products has spurred the requirement for these ingredients in bakery applications.

Manufacturers are focusing on providing healthier options correspondingly complying with regulatory norms. This two-way trade has facilitated market growth with increasing urbanization and changing lifestyles of consumers.

Mineral Blend is the Top Ingredient in the Market due to its Effectiveness in Maintaining Quality and Taste

Mineral blends have the ability to enhance the taste and flavor of food products while minimizing the amount of sodium added. Thus, the demand is upsurging with increasing consumer awareness of health hazards associated with high sodium intake.

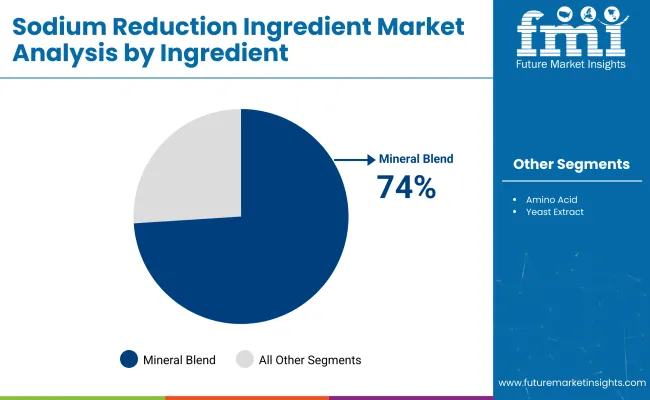
The shift to low-sodium food products has driven producers to mineral blends to lower the sodium content while maintaining quality and taste. This blend is gaining traction in the market with a remarkable anticipated market share of 34.00% for 2024.

Attributes Details
Ingredients Mineral Blends
Market Share (2024) 34.00%

Mineral blend is a natural and cost-effective alternative to chemical-based sodium reduction ingredients. This mineral blend is widely used in the food processing industry, including meat, dairy, bakery, and confectionery, among others. The burgeoning demand for natural and organic ingredients in food products is orchestrating success for the blend.

Country-wise Insights

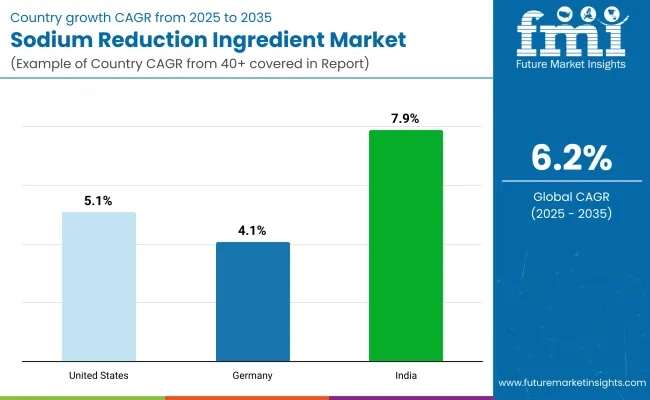
Countries CAGR from 2024 to 2034
India 7.40%
China 6.40%
Australia 5.00%
United States 4.50%
Germany 4.10%

Foreign Influence and Fluctuating Eating Habits in India Augment Market Growth

Indians are known for their high salt consumption because of their preference for spicy food, like pickles. The rising population, increasing foreign influence, and fluctuating eating habits have contributed to the growth trajectory of the bakery industry in India. India stands as a prominent player in the SRI market, forecasted to showcase a 7.40% CAGR through 2034.

Major players operating in India are ADM, Tate & Lyle, Bunge, Cargill, and Givaudan. These companies aim to expand and merge with domestic food processing companies to facilitate sodium reduction ingredient penetration across products. Social media has also influenced consumers about the benefits of SRI over high sodium food intake.

Widely Growing Packaged and Processed Food Segment in China

The growing food industry in China, especially the packaged and processed food segment, has spurred the consumption of sodium among consumers. To nullify this high sodium content, manufacturers are making products that are healthy and tasty with less sodium content. This has curated the demand for sodium reduction ingredients in the Chinese market. The sodium reduction ingredient market in China is likely to cover a CAGR of 6.40% through 2034.

Consumption of noodles, meat, sauces, and soups is high in China, and the segments possess huge potential for sodium reduction ingredients. The Chinese market is driven by yeast extract used as food additives to impact savory and umami taste. This ingredient is widely used to compensate for taste profiles in Chinese food items.

The key players in the Chinese market are Angel Yeast Co. Ltd, Corbion NV, Tate & Lyle PLC, and Koninklijke DSM NV. They are expanding the Chinese SRI market with acquisitions and innovations.

Huge Australian Bakery Industry Curates Growth Opportunities for Sodium Reduction Ingredients

Australians are sweet on bakery products and the market is predicted to grow vast with developments in the retail sector and stable economic growth. Manufacturers are investing in research and development to launch new products with innovative flavors and healthy ingredients. This is a significant factor that is driving the demand for Sodium Reduction Ingredients in the Australian market.

Sodium Reduction Ingredient demand in Australia is estimated to rise at a CAGR of 5.00% during the forecast period (2024 to 2034). Biospringer, Tate & Lyle Plc, Koninklijke DSM N.V., and Sensient Technologies Corp are giant players in Australia. They are focused on establishing a global presence by developing customized solutions.

The United States holds a Well-Established Food and Beverages Industry, Catering Demand for SRI Industry

The United States sodium reduction ingredient market is in for a CAGR of 4.50% through 2034. This is owing to the presence of several fast food and other food processing industries. Plus, government initiatives are undertaken for consumer awareness of the benefits of sodium reduction ingredients.

The country is well-established in the food and beverage industry. This has facilitated the innovation and development of effective sodium reduction ingredients.

Additionally, increasing consumer preference for clean labels and natural ingredients has exceeded the requirement for natural sodium reduction solutions. All these factors have compelled the market expansion of the United States in the sodium reduction ingredient market.

Presence of Global Retail Players in Germany Profits the Market

Low-sodium food has been a new attraction in Germany. Consumers have shifted to healthy habits, emphasizing the use of health-conserving products due to their transforming lifestyles.

German Federal Institute for Risk Assessment has announced a reduction in the salt content in processed foods as an action against the risk of hypertension. With a CAGR of 4.10% through 2034, the sodium reduction ingredient market in Germany is in for moderate growth.

Global retail players, such as Nestle and Unilever, widely incorporate mineral salts, particularly potassium chloride, as a salt-reducing ingredient. Major companies are pleading with regulatory bodies to allow it to be labeled as potassium salt within the European Union.

Nandini Roy Choudhury

Principal Consultant

Talk to Analyst

Find your sweet spots for generating winning opportunities in this market.

Competitive Landscape

PepsiCo Inc., a well-known food, snack, and beverage company, has significantly reduced the salt content in several of its products, including Walkers Crisps, Walkers Lights, and Walkers Sensations. The company has successfully managed to reduce sodium levels in its snack products by 25%-55%. In addition, the frozen foods and bakery products segment is also expected to benefit significantly from the use of sodium-reduction ingredients.

Manufacturers and retailers are now focusing on research and development to create new products that cater to the growing demand for healthier food options. The adoption of sodium-reduction ingredients presents a great opportunity for manufacturers to improve profits while providing healthier options for consumers.

Recent Advancements

  • In April 2024, Kerry Group unveiled Tastesense Salt, a sodium reduction solution for savory snacks. The product heeds WHO's call for lower sodium levels, achieving reductions exceeding 60% without compromising flavor.
  • In November 2023, PepsiCo announced plans to reduce sodium in Lay's Classic Potato Chips, aiming for 140mg per serving by 2030. They also pledged to incorporate diverse ingredients, targeting 145 billion portions yearly by 2030, each providing 10% of the suggested daily intake.
  • In December 2015, ADM unveiled SaltTrimR, a sodium reduction technology for meat products, offering up to 30% reduction. Sea SaltTrimR, rich in potassium chloride, and Salt Enhancer, a natural flavoring, aimed to maintain taste and texture while cutting sodium.

Key Companies in the Market

  • Kerry Group Plc
  • Angel Yeast Co. Ltd
  • Innophos Holdings Incorporated
  • Cargill Incorporated
  • Royal DSM N.V.
  • E.I. du Pont de Nemours & Co.

Get the data you need at a Fraction of the cost

Personalize your report by choosing insights you need
and save 40%!

Key Coverage in the Sodium Reduction Ingredient Market Report

  • Market Dynamics Influencing Sales and Adoption of Sodium Reduction Products
  • Market Perception of Cost-Effectiveness and Sensory Attributes of Sodium Reduction Solutions
  • Emerging Opportunities in Sodium Reduction Sector
  • Impact of Regulatory Guidelines on Sodium Reduction Market
  • Regional Analysis of Sodium Reduction Adoption in Food Manufacturing
  • Health and Wellness Sector Trends

Market Segmentation

By Application:

  • Snacks
  • Frozen food
  • dips/ Sauce/dressings
  • butter/ Cheese
  • Bakery food
  • Others (breakfast cereal, baby food, and beverages)

By Ingredients:

  • Mineral blends
  • Potassium sulfate
  • Magnesium sulfate
  • Calcium chloride
  • Potassium Lactate
  • Potassium chloride
  • Amino acid
  • Yeast extract
  • Others (trehalose, hydrolyzed vegetable protein, and nucleotides)

By Region:

  • North America
  • Latin America
  • Asia Pacific
  • Middle East and Africa (MEA)
  • Europe

Frequently Asked Questions

What is the Sodium Reduction Ingredient Market Worth?

The market is set to reach USD 5,567 million in 2024.

What is the Sales Forecast for the Sodium Reduction Ingredient through 2034?

The sodium reduction ingredient market is expected to reach USD 10,165 million by 2034.

At What Rate Is the Sodium Reduction Ingredient Market Growing Globally?

The market is in line to grow at a CAGR of 6.20% from 2024 to 2034.

Which is the Most Popular Sodium Reduction Ingredient?

Mineral blend is the top ingredient, with a market share of 34.00% anticipated for 2024.

How will India’s Sodium Reduction Ingredient Market Progress?

The market in India is expected to progress at a CAGR of 7.40% through 2034.

Table of Content
1. Executive Summary
    1.1. Global Market Outlook
    1.2. Demand-side Trends
    1.3. Supply-side Trends
    1.4. Technology Roadmap Analysis
    1.5. Analysis and Recommendations
2. Market Overview
    2.1. Market Coverage / Taxonomy
    2.2. Market Definition / Scope / Limitations
3. Market Background
    3.1. Market Dynamics
        3.1.1. Drivers
        3.1.2. Restraints
        3.1.3. Opportunity
        3.1.4. Trends
    3.2. Scenario Forecast
        3.2.1. Demand in Optimistic Scenario
        3.2.2. Demand in Likely Scenario
        3.2.3. Demand in Conservative Scenario
    3.3. Opportunity Map Analysis
    3.4. Product Life Cycle Analysis
    3.5. Supply Chain Analysis
        3.5.1. Supply Side Participants and their Roles
            3.5.1.1. Manufacturer
        3.5.2. Value Added and Value Created at Node in the Supply Chain
        3.5.3. List of Raw Material Suppliers
        3.5.4. List of Existing and Potential Buyer’s
    3.6. Investment Feasibility Matrix
    3.7. Value Chain Analysis
        3.7.1. Profit Margin Analysis
    3.8. PESTLE and Porter’s Analysis
    3.9. Regulatory Landscape
        3.9.1. By Key Regions
        3.9.2. By Key Countries
    3.10. Regional Parent Market Outlook
    3.11. Production and Consumption Statistics
    3.12. Import and Export Statistics
4. Global Market Analysis 2019 to 2023 and Forecast, 2024 to 2034
    4.1. Historical Market Size Value (US$ Million) & Volume (Tons) Analysis, 2019 to 2023
    4.2. Current and Future Market Size Value (US$ Million) & Volume (Tons) Projections, 2024 to 2034
        4.2.1. Y-o-Y Growth Trend Analysis
        4.2.2. Absolute $ Opportunity Analysis
5. Global Market Analysis 2019 to 2023 and Forecast 2024 to 2034, By Application
    5.1. Introduction / Key Findings
    5.2. Historical Market Size Value (US$ Million) & Volume (Tons) Analysis By Application, 2019 to 2023
    5.3. Current and Future Market Size Value (US$ Million) & Volume (Tons) Analysis and Forecast By Application, 2024 to 2034
        5.3.1. Snacks
        5.3.2. Frozen food
        5.3.3. Dips/ Sauce/Dressings
        5.3.4. Butter/ Cheese
        5.3.5. Bakery Food
        5.3.6. Others
    5.4. Y-o-Y Growth Trend Analysis By Application, 2019 to 2023
    5.5. Absolute $ Opportunity Analysis By Application, 2024 to 2034
6. Global Market Analysis 2019 to 2023 and Forecast 2024 to 2034, By Ingredients
    6.1. Introduction / Key Findings
    6.2. Historical Market Size Value (US$ Million) & Volume (Tons) Analysis By Ingredients, 2019 to 2023
    6.3. Current and Future Market Size Value (US$ Million) & Volume (Tons) Analysis and Forecast By Ingredients, 2024 to 2034
        6.3.1. Mineral Blends
            6.3.1.1. Potassium Sulfate
            6.3.1.2. Magnesium Sulfate
            6.3.1.3. Calcium Chloride
            6.3.1.4. Potassium Lactate
            6.3.1.5. Potassium Chloride
        6.3.2. Amino Acid
        6.3.3. Yeast Extract
        6.3.4. Others
    6.4. Y-o-Y Growth Trend Analysis By Ingredients, 2019 to 2023
    6.5. Absolute $ Opportunity Analysis By Ingredients, 2024 to 2034
7. Global Market Analysis 2019 to 2023 and Forecast 2024 to 2034, By Region
    7.1. Introduction
    7.2. Historical Market Size Value (US$ Million) & Volume (Tons) Analysis By Region, 2019 to 2023
    7.3. Current Market Size Value (US$ Million) & Volume (Tons) Analysis and Forecast By Region, 2024 to 2034
        7.3.1. North America
        7.3.2. Latin America
        7.3.3. Western Europe
        7.3.4. Eastern Europe
        7.3.5. South Asia and Pacific
        7.3.6. East Asia
        7.3.7. Middle East and Africa
    7.4. Market Attractiveness Analysis By Region
8. North America Market Analysis 2019 to 2023 and Forecast 2024 to 2034, By Country
    8.1. Historical Market Size Value (US$ Million) & Volume (Tons) Trend Analysis By Market Taxonomy, 2019 to 2023
    8.2. Market Size Value (US$ Million) & Volume (Tons) Forecast By Market Taxonomy, 2024 to 2034
        8.2.1. By Country
            8.2.1.1. USA
            8.2.1.2. Canada
        8.2.2. By Application
        8.2.3. By Ingredients
    8.3. Market Attractiveness Analysis
        8.3.1. By Country
        8.3.2. By Application
        8.3.3. By Ingredients
    8.4. Key Takeaways
9. Latin America Market Analysis 2019 to 2023 and Forecast 2024 to 2034, By Country
    9.1. Historical Market Size Value (US$ Million) & Volume (Tons) Trend Analysis By Market Taxonomy, 2019 to 2023
    9.2. Market Size Value (US$ Million) & Volume (Tons) Forecast By Market Taxonomy, 2024 to 2034
        9.2.1. By Country
            9.2.1.1. Brazil
            9.2.1.2. Mexico
            9.2.1.3. Rest of Latin America
        9.2.2. By Application
        9.2.3. By Ingredients
    9.3. Market Attractiveness Analysis
        9.3.1. By Country
        9.3.2. By Application
        9.3.3. By Ingredients
    9.4. Key Takeaways
10. Western Europe Market Analysis 2019 to 2023 and Forecast 2024 to 2034, By Country
    10.1. Historical Market Size Value (US$ Million) & Volume (Tons) Trend Analysis By Market Taxonomy, 2019 to 2023
    10.2. Market Size Value (US$ Million) & Volume (Tons) Forecast By Market Taxonomy, 2024 to 2034
        10.2.1. By Country
            10.2.1.1. Germany
            10.2.1.2. UK
            10.2.1.3. France
            10.2.1.4. Spain
            10.2.1.5. Italy
            10.2.1.6. Rest of Western Europe
        10.2.2. By Application
        10.2.3. By Ingredients
    10.3. Market Attractiveness Analysis
        10.3.1. By Country
        10.3.2. By Application
        10.3.3. By Ingredients
    10.4. Key Takeaways
11. Eastern Europe Market Analysis 2019 to 2023 and Forecast 2024 to 2034, By Country
    11.1. Historical Market Size Value (US$ Million) & Volume (Tons) Trend Analysis By Market Taxonomy, 2019 to 2023
    11.2. Market Size Value (US$ Million) & Volume (Tons) Forecast By Market Taxonomy, 2024 to 2034
        11.2.1. By Country
            11.2.1.1. Poland
            11.2.1.2. Russia
            11.2.1.3. Czech Republic
            11.2.1.4. Romania
            11.2.1.5. Rest of Eastern Europe
        11.2.2. By Application
        11.2.3. By Ingredients
    11.3. Market Attractiveness Analysis
        11.3.1. By Country
        11.3.2. By Application
        11.3.3. By Ingredients
    11.4. Key Takeaways
12. South Asia and Pacific Market Analysis 2019 to 2023 and Forecast 2024 to 2034, By Country
    12.1. Historical Market Size Value (US$ Million) & Volume (Tons) Trend Analysis By Market Taxonomy, 2019 to 2023
    12.2. Market Size Value (US$ Million) & Volume (Tons) Forecast By Market Taxonomy, 2024 to 2034
        12.2.1. By Country
            12.2.1.1. India
            12.2.1.2. Bangladesh
            12.2.1.3. Australia
            12.2.1.4. New Zealand
            12.2.1.5. Rest of South Asia and Pacific
        12.2.2. By Application
        12.2.3. By Ingredients
    12.3. Market Attractiveness Analysis
        12.3.1. By Country
        12.3.2. By Application
        12.3.3. By Ingredients
    12.4. Key Takeaways
13. East Asia Market Analysis 2019 to 2023 and Forecast 2024 to 2034, By Country
    13.1. Historical Market Size Value (US$ Million) & Volume (Tons) Trend Analysis By Market Taxonomy, 2019 to 2023
    13.2. Market Size Value (US$ Million) & Volume (Tons) Forecast By Market Taxonomy, 2024 to 2034
        13.2.1. By Country
            13.2.1.1. China
            13.2.1.2. Japan
            13.2.1.3. South Korea
        13.2.2. By Application
        13.2.3. By Ingredients
    13.3. Market Attractiveness Analysis
        13.3.1. By Country
        13.3.2. By Application
        13.3.3. By Ingredients
    13.4. Key Takeaways
14. Middle East and Africa Market Analysis 2019 to 2023 and Forecast 2024 to 2034, By Country
    14.1. Historical Market Size Value (US$ Million) & Volume (Tons) Trend Analysis By Market Taxonomy, 2019 to 2023
    14.2. Market Size Value (US$ Million) & Volume (Tons) Forecast By Market Taxonomy, 2024 to 2034
        14.2.1. By Country
            14.2.1.1. GCC Countries
            14.2.1.2. South Africa
            14.2.1.3. Israel
            14.2.1.4. Rest of MEA
        14.2.2. By Application
        14.2.3. By Ingredients
    14.3. Market Attractiveness Analysis
        14.3.1. By Country
        14.3.2. By Application
        14.3.3. By Ingredients
    14.4. Key Takeaways
15. Key Countries Market Analysis
    15.1. USA
        15.1.1. Pricing Analysis
        15.1.2. Market Share Analysis, 2023
            15.1.2.1. By Application
            15.1.2.2. By Ingredients
    15.2. Canada
        15.2.1. Pricing Analysis
        15.2.2. Market Share Analysis, 2023
            15.2.2.1. By Application
            15.2.2.2. By Ingredients
    15.3. Brazil
        15.3.1. Pricing Analysis
        15.3.2. Market Share Analysis, 2023
            15.3.2.1. By Application
            15.3.2.2. By Ingredients
    15.4. Mexico
        15.4.1. Pricing Analysis
        15.4.2. Market Share Analysis, 2023
            15.4.2.1. By Application
            15.4.2.2. By Ingredients
    15.5. Germany
        15.5.1. Pricing Analysis
        15.5.2. Market Share Analysis, 2023
            15.5.2.1. By Application
            15.5.2.2. By Ingredients
    15.6. UK
        15.6.1. Pricing Analysis
        15.6.2. Market Share Analysis, 2023
            15.6.2.1. By Application
            15.6.2.2. By Ingredients
    15.7. France
        15.7.1. Pricing Analysis
        15.7.2. Market Share Analysis, 2023
            15.7.2.1. By Application
            15.7.2.2. By Ingredients
    15.8. Spain
        15.8.1. Pricing Analysis
        15.8.2. Market Share Analysis, 2023
            15.8.2.1. By Application
            15.8.2.2. By Ingredients
    15.9. Italy
        15.9.1. Pricing Analysis
        15.9.2. Market Share Analysis, 2023
            15.9.2.1. By Application
            15.9.2.2. By Ingredients
    15.10. Poland
        15.10.1. Pricing Analysis
        15.10.2. Market Share Analysis, 2023
            15.10.2.1. By Application
            15.10.2.2. By Ingredients
    15.11. Russia
        15.11.1. Pricing Analysis
        15.11.2. Market Share Analysis, 2023
            15.11.2.1. By Application
            15.11.2.2. By Ingredients
    15.12. Czech Republic
        15.12.1. Pricing Analysis
        15.12.2. Market Share Analysis, 2023
            15.12.2.1. By Application
            15.12.2.2. By Ingredients
    15.13. Romania
        15.13.1. Pricing Analysis
        15.13.2. Market Share Analysis, 2023
            15.13.2.1. By Application
            15.13.2.2. By Ingredients
    15.14. India
        15.14.1. Pricing Analysis
        15.14.2. Market Share Analysis, 2023
            15.14.2.1. By Application
            15.14.2.2. By Ingredients
    15.15. Bangladesh
        15.15.1. Pricing Analysis
        15.15.2. Market Share Analysis, 2023
            15.15.2.1. By Application
            15.15.2.2. By Ingredients
    15.16. Australia
        15.16.1. Pricing Analysis
        15.16.2. Market Share Analysis, 2023
            15.16.2.1. By Application
            15.16.2.2. By Ingredients
    15.17. New Zealand
        15.17.1. Pricing Analysis
        15.17.2. Market Share Analysis, 2023
            15.17.2.1. By Application
            15.17.2.2. By Ingredients
    15.18. China
        15.18.1. Pricing Analysis
        15.18.2. Market Share Analysis, 2023
            15.18.2.1. By Application
            15.18.2.2. By Ingredients
    15.19. Japan
        15.19.1. Pricing Analysis
        15.19.2. Market Share Analysis, 2023
            15.19.2.1. By Application
            15.19.2.2. By Ingredients
    15.20. South Korea
        15.20.1. Pricing Analysis
        15.20.2. Market Share Analysis, 2023
            15.20.2.1. By Application
            15.20.2.2. By Ingredients
    15.21. GCC Countries
        15.21.1. Pricing Analysis
        15.21.2. Market Share Analysis, 2023
            15.21.2.1. By Application
            15.21.2.2. By Ingredients
    15.22. South Africa
        15.22.1. Pricing Analysis
        15.22.2. Market Share Analysis, 2023
            15.22.2.1. By Application
            15.22.2.2. By Ingredients
    15.23. Israel
        15.23.1. Pricing Analysis
        15.23.2. Market Share Analysis, 2023
            15.23.2.1. By Application
            15.23.2.2. By Ingredients
16. Market Structure Analysis
    16.1. Competition Dashboard
    16.2. Competition Benchmarking
    16.3. Market Share Analysis of Top Players
        16.3.1. By Regional
        16.3.2. By Application
        16.3.3. By Ingredients
17. Competition Analysis
    17.1. Competition Deep Dive
        17.1.1. Kerry Group Plc
            17.1.1.1. Overview
            17.1.1.2. Product Portfolio
            17.1.1.3. Profitability by Market Segments
            17.1.1.4. Sales Footprint
            17.1.1.5. Strategy Overview
                17.1.1.5.1. Marketing Strategy
                17.1.1.5.2. Product Strategy
                17.1.1.5.3. Channel Strategy
        17.1.2. Angel Yeast Co. Ltd
            17.1.2.1. Overview
            17.1.2.2. Product Portfolio
            17.1.2.3. Profitability by Market Segments
            17.1.2.4. Sales Footprint
            17.1.2.5. Strategy Overview
                17.1.2.5.1. Marketing Strategy
                17.1.2.5.2. Product Strategy
                17.1.2.5.3. Channel Strategy
        17.1.3. Innophos Holdings Incorporated
            17.1.3.1. Overview
            17.1.3.2. Product Portfolio
            17.1.3.3. Profitability by Market Segments
            17.1.3.4. Sales Footprint
            17.1.3.5. Strategy Overview
                17.1.3.5.1. Marketing Strategy
                17.1.3.5.2. Product Strategy
                17.1.3.5.3. Channel Strategy
        17.1.4. Cargill Incorporated
            17.1.4.1. Overview
            17.1.4.2. Product Portfolio
            17.1.4.3. Profitability by Market Segments
            17.1.4.4. Sales Footprint
            17.1.4.5. Strategy Overview
                17.1.4.5.1. Marketing Strategy
                17.1.4.5.2. Product Strategy
                17.1.4.5.3. Channel Strategy
        17.1.5. Royal DSM N.V
            17.1.5.1. Overview
            17.1.5.2. Product Portfolio
            17.1.5.3. Profitability by Market Segments
            17.1.5.4. Sales Footprint
            17.1.5.5. Strategy Overview
                17.1.5.5.1. Marketing Strategy
                17.1.5.5.2. Product Strategy
                17.1.5.5.3. Channel Strategy
        17.1.6. Advanced Food Systems Inc
            17.1.6.1. Overview
            17.1.6.2. Product Portfolio
            17.1.6.3. Profitability by Market Segments
            17.1.6.4. Sales Footprint
            17.1.6.5. Strategy Overview
                17.1.6.5.1. Marketing Strategy
                17.1.6.5.2. Product Strategy
                17.1.6.5.3. Channel Strategy
        17.1.7. Givaudan
            17.1.7.1. Overview
            17.1.7.2. Product Portfolio
            17.1.7.3. Profitability by Market Segments
            17.1.7.4. Sales Footprint
            17.1.7.5. Strategy Overview
                17.1.7.5.1. Marketing Strategy
                17.1.7.5.2. Product Strategy
                17.1.7.5.3. Channel Strategy
        17.1.8. DuPont
            17.1.8.1. Overview
            17.1.8.2. Product Portfolio
            17.1.8.3. Profitability by Market Segments
            17.1.8.4. Sales Footprint
            17.1.8.5. Strategy Overview
                17.1.8.5.1. Marketing Strategy
                17.1.8.5.2. Product Strategy
                17.1.8.5.3. Channel Strategy
        17.1.9. Dr. Paul Lohmann GmbH & Co. KGaA
            17.1.9.1. Overview
            17.1.9.2. Product Portfolio
            17.1.9.3. Profitability by Market Segments
            17.1.9.4. Sales Footprint
            17.1.9.5. Strategy Overview
                17.1.9.5.1. Marketing Strategy
                17.1.9.5.2. Product Strategy
                17.1.9.5.3. Channel Strategy
18. Assumptions & Acronyms Used
19. Research Methodology
Recommendations

Food and Beverage

Prebiotic Ingredient Market

February 2024

REP-GB-788

350 pages

Food and Beverage

Bakery Ingredient Market

October 2023

REP-GB-416

339 pages

Explore Food and Beverage Insights

View Reports
Future Market Insights

Sodium Reduction Ingredient Market

Schedule a Call