The global sodium caseinate market is likely to grow from USD 1.5 billion in 2025 to USD 2.7 billion by 2035, advancing at a CAGR of 6.1%. The industry stands at the threshold of a decade-long expansion trajectory that promises to reshape dairy protein formulation technology and functional ingredient solutions. The market's journey from USD 1.5 billion in 2025 to USD 2.7 billion by 2035 represents substantial growth, demonstrating the accelerating adoption of advanced dairy-derived protein ingredients and clean-label formulation technology across food additives, emulsifiers, and nutrition sectors worldwide.
The first half of the decade (2025 to 2030) will witness the market climbing from USD 1.5 billion to approximately USD 2.0 billion, adding USD 0.5 billion in value, which constitutes 42% of the total forecast growth period. This phase will be characterized by the rapid adoption of food-grade caseinate systems, driven by increasing demand for protein-fortified foods and the growing need for functional dairy ingredients worldwide. Advanced emulsification capabilities and clean-label reformulation systems will become standard expectations rather than premium options.
The latter half (2030 to 2035) will witness steady growth from USD 2.0 billion to USD 2.7 billion, representing an addition of USD 0.7 billion or 58% of the decade's expansion. This period will be defined by mass market penetration of specialized sodium caseinate formulations, integration with comprehensive nutrition platforms, and seamless compatibility with existing food processing infrastructure. The market trajectory signals fundamental shifts in how food manufacturers approach protein fortification and functional ingredient optimization, with participants positioned to benefit from constant demand across multiple product grades and application segments.
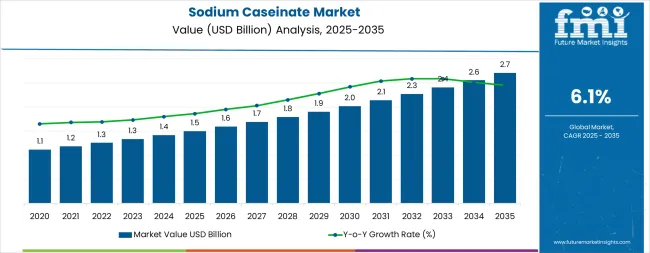
The market demonstrates distinct growth phases with varying market characteristics and competitive dynamics. Between 2025 and 2030, the market progresses through its adoption phase, expanding from USD 1.5 billion to USD 2.0 billion with steady annual increments averaging 6.1% growth. This period showcases the transition from basic protein ingredients to advanced caseinate systems with enhanced solubility capabilities and integrated clean-label features becoming mainstream across food and beverage applications.
The 2025 to 2030 phase adds USD 0.5 billion to market value, representing 42% of total decade expansion. Market maturation factors include standardization of dairy protein protocols, declining processing costs for specialized caseinate formulations, and increasing food industry awareness of functional protein benefits reaching 95-98% adoption in sports nutrition applications.
Competitive landscape evolution during this period features established dairy cooperatives like FrieslandCampina and Arla Foods expanding their protein portfolios while specialty manufacturers focus on advanced formulation development and enhanced emulsification capabilities. From 2030 to 2035, market dynamics shift toward advanced functional integration and global nutrition expansion, with growth continuing from USD 2.0 billion to USD 2.7 billion, adding USD 0.7 billion or 58% of total expansion. This phase transition centers on specialized caseinate chemistry systems, integration with automated food processing networks, and deployment across diverse nutrition scenarios, becoming standard rather than specialized applications. The competitive environment matures with focus shifting from basic protein capability to comprehensive nutrition optimization systems and integration with product development platforms.
At-a-Glance Metrics
| Metric | Value |
|---|---|
| Market Value (2025) | USD 1.5 billion |
| Market Forecast (2035) | USD 2.7 billion |
| Growth Rate | 6.1% CAGR |
| Leading Technology | Food-grade Product Type |
| Primary Application | Food & Beverages Segment |
The market demonstrates strong fundamentals with food-grade systems capturing a dominant 60.0% share through advanced emulsification and protein stabilization capabilities. Food & beverages applications drive primary demand at 44.0% share, supported by increasing functional food production and dairy protein fortification requirements. Geographic expansion remains concentrated in developed markets with established dairy infrastructure, while emerging economies show accelerating adoption rates driven by nutrition modernization and rising protein consumption standards.
Market expansion rests on three fundamental shifts driving adoption across the food processing and nutrition sectors. First, protein fortification demand creates compelling nutritional advantages through sodium caseinate ingredients that provide immediate functional benefits without processing delays, enabling food manufacturers to meet clean-label standards while maintaining product quality and reducing formulation costs.
Second, dairy ingredient modernization accelerates as production facilities worldwide seek advanced protein systems that complement traditional formulations, enabling precise emulsification and stabilization that align with food industry standards and nutritional enhancement regulations.
Third, functional food infrastructure enhancement drives adoption from processing facilities and nutrition manufacturers requiring effective protein solutions that minimize formulation failures while maintaining operational productivity during product development and ingredient integration operations.
Growth faces headwinds from raw material cost challenges that vary across dairy suppliers regarding the sourcing of milk proteins and specialty processing ingredients, which may limit adoption in cost-sensitive manufacturing environments. Technical limitations also persist regarding allergen considerations and lactose sensitivity that may reduce applicability in certain consumer segments, which affect ingredient selection and formulation compatibility.
The sodium caseinate market represents a specialized yet critical dairy ingredient opportunity driven by expanding global nutrition demand, food processing modernization, and the need for superior functional properties in protein-fortified applications.
As food manufacturers worldwide seek to achieve optimal emulsification effectiveness, reduce formulation defects, and integrate advanced protein systems with automated processing platforms, sodium caseinate is evolving from basic protein ingredients to sophisticated functional solutions that ensure product quality and nutritional excellence.
The convergence of protein fortification expansion, functional food infrastructure enhancement, and advanced dairy processing development creates constant demand drivers across multiple nutrition segments. The market's growth trajectory from USD 1.5 billion in 2025 to USD 2.7 billion by 2035 at a 6.1% CAGR reflects fundamental shifts in food industry protein requirements and functional ingredient optimization.
Geographic expansion opportunities are particularly pronounced in high-growth markets, where the United States (6.3% CAGR), India (6.4% CAGR), and South Korea (6.2% CAGR) lead through aggressive nutrition programs and dairy processing infrastructure development. The dominance of food-grade systems (60.0% market share) and food & beverages applications (44.0% share) provides clear strategic focus areas, while emerging pharmaceutical and cosmetics applications open new revenue streams across diverse functional protein markets.
Strengthening the dominant food-grade segment (60.0% market share) through enhanced protein formulations, superior solubility, clean-label positioning, and seamless integration with food processing infrastructure. This pathway focuses on optimizing protein content, improving emulsification consistency, extending functional effectiveness to 95-98% success rates, and developing specialized formulations for diverse nutrition applications.
Market leadership consolidation through advanced dairy engineering, comprehensive quality monitoring, and automated processing integration enables premium positioning while defending competitive advantages against alternative protein sources and expanding market penetration across food manufacturing applications. Expected revenue pool: USD 180-250 million
Rapid protein consumption growth across the United States (6.3% CAGR) and India (6.4% CAGR) creates substantial expansion opportunities through local dairy processing capabilities, technology transfer partnerships, and comprehensive supply chain development. Growing functional food production, nutrition modernization, and government health initiatives drive steady demand for advanced caseinate systems.
Localization strategies reduce import costs, enable faster technical support, and position companies advantageously for food procurement programs while accessing growing domestic markets requiring specialized protein solutions for sports and clinical nutrition applications. Expected revenue pool: USD 150-220 million
Expansion within the dominant food additives segment (38.0% market share) through specialized formulations addressing food industry quality standards, high-volume processing requirements, and comprehensive functional reliability for bakery and dairy applications. This pathway encompasses automated dosing systems, quality control integration, cost-effective formulations, and compatibility with diverse food processing requirements.
Premium positioning reflects superior emulsification performance, consistent quality outcomes, and comprehensive food compliance that supports modern functional food production while enabling integration with advanced processing monitoring and quality assurance systems. Expected revenue pool: USD 120-180 million
Strategic expansion into pharmaceutical/cosmetics/chemicals segments (7.0% market share) requires enhanced purity, superior binding strength, and specialized protein formulations addressing medical and industrial operational requirements.
This pathway addresses pharmaceutical excipients, cosmetic emulsifiers, industrial adhesives, and specialty protein applications with advanced processing for demanding quality conditions. Premium pricing reflects specialized purity requirements, extended stability standards, and comprehensive regulatory support necessary for pharmaceutical applications while creating opportunities for long-term supply agreements and specialized technical services. Expected revenue pool: USD 90-140 million
Development of specialized emulsifier formulations (22.0% share) and free-fat stabilizers (16.0% share) addressing specific food processing requirements, performance optimization needs, and niche application demands. This pathway encompasses hybrid protein formulations, clean-label optimized ingredients, specialized dairy applications, and cost-effective alternatives for price-sensitive markets. Technology differentiation through proprietary processing, application-specific optimization, and comprehensive technical support enables diversified revenue streams while reducing dependency on single application platforms and expanding addressable market opportunities. Expected revenue pool: USD 80-130 million
Integration of sodium caseinate with sports nutrition platforms, meal replacement systems, and clinical nutrition technologies enabling high-protein formulations, performance enhancement, and comprehensive nutritional optimization.
This pathway encompasses RTD beverages, protein bars, medical foods, and nutrition supplements for athletic and healthcare applications. Premium positioning through superior amino acid profiles, sustained-release characteristics, and extensive nutritional documentation creates opportunities for specialized nutrition partnerships and ongoing customer relationships through science-backed formulation enhancement. Expected revenue pool: USD 70-110 million
Development of clean-label sodium caseinate formulations focuses on addressing consumer preferences, eco-friendly requirements, and natural ingredient positioning across food applications. This pathway encompasses minimally processed protein systems, sustainable dairy sourcing practices, allergen-reduced ingredient solutions, and comprehensive transparency documentation meeting global food industry compliance standards. Premium positioning is achieved through clean-label leadership, processing expertise, and ecofriendly dairy production capabilities that enhance traceability and quality assurance.
These formulations enable access to premium-focused procurement programs, transparency-driven partnerships, and ingredient authentication platforms supporting diverse applications across dairy, bakery, nutrition, and ready-to-eat product manufacturing. Expected revenue pool: USD 60–100 million.
Primary Classification: The market segments by product grade into Food-grade and Industrial-grade categories, representing the evolution from basic protein ingredients to specialized functional solutions for comprehensive nutrition optimization.
Secondary Classification: Application segmentation divides the market into Food additives, Emulsifiers, Free-fat stabilizers, and Others (thickening/foaming/encapsulation), reflecting distinct requirements for functional performance, processing compatibility, and formulation optimization standards.
Tertiary Classification: End-use segmentation encompasses Food & beverages, Dairy products, Bakery & confectionery, Ready-to-eat & frozen foods, and Pharmaceuticals/cosmetics/chemicals/other industrial sectors, representing diverse market opportunities.
Regional Classification: Geographic distribution covers North America, Europe, Asia Pacific, Latin America, and the Middle East & Africa, with developed markets leading adoption while emerging economies show accelerating growth patterns driven by nutrition expansion programs.
The segmentation structure reveals technology progression from standard protein formulations toward specialized functional systems with enhanced emulsification and clean-label capabilities, while application diversity spans from food processing to specialized pharmaceutical and industrial manufacturing requiring precise protein solutions.
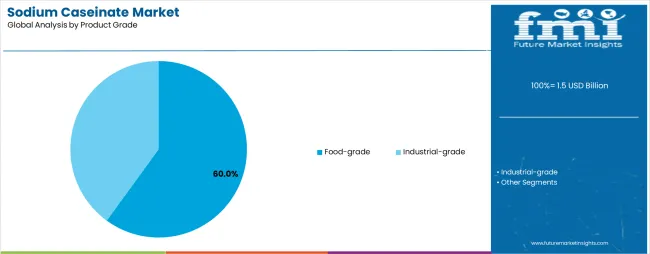
Market Position: Food-grade systems command the leading position in the Sodium Caseinate market with 60.0% market share through advanced functional properties, including superior emulsification strength, solubility capability, and clean-label positioning that enable food manufacturers to achieve optimal protein fortification across diverse nutrition and processing environments.
Value Drivers: The segment benefits from food manufacturer preference for reliable protein systems that provide consistent functional performance, reduced formulation defects, and processing efficiency optimization without requiring significant recipe modifications. Advanced formulation features enable automated dosing systems, emulsification consistency, and integration with existing food processing equipment, where protein quality and functional reliability represent critical operational requirements.
Competitive Advantages: Food-grade systems differentiate through proven safety profiles, consistent functional characteristics, and integration with clean-label food systems that enhance nutritional effectiveness while maintaining optimal product quality suitable for diverse food and beverage applications.
Key market characteristics:
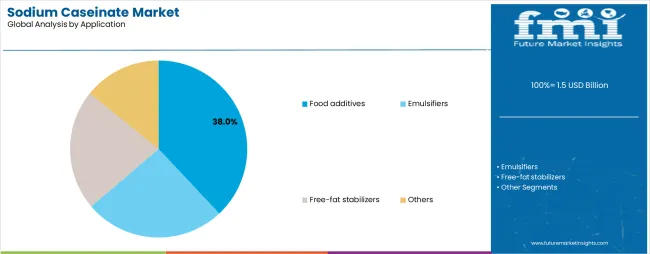
Market Context: Food additives applications dominate the Sodium Caseinate market with 38.0% market share due to widespread adoption of protein systems and increasing focus on functional ingredient optimization, product quality management, and formulation cost reduction applications that minimize processing failures while maintaining food industry standards.
Appeal Factors: Food manufacturers prioritize system reliability, functional consistency, and integration with existing processing infrastructure that enables coordinated protein application across multiple production lines. The segment benefits from substantial food industry investment and modernization programs that prioritize the acquisition of functional protein systems for quality control and processing efficiency applications.
Growth Drivers: Food processing expansion programs incorporate sodium caseinate as standard ingredients for functional food operations, while nutrition industry growth increases demand for advanced protein capabilities that comply with food quality standards and minimize formulation defects.
Market Challenges: Varying food industry standards and processing technology differences may limit ingredient standardization across different production facilities or operational scenarios.
Application dynamics include:
Growth Accelerators: Protein fortification expansion drives primary adoption as sodium caseinate provides functional efficiency capabilities that enable food manufacturers to meet nutritional standards without excessive processing complexities, supporting product development and nutrition missions that require precise protein integration applications.
Functional food infrastructure demand accelerates market expansion as processing facilities seek effective protein systems that minimize formulation failures while maintaining operational effectiveness during food production and ingredient integration scenarios. Clean-label technology spending increases worldwide, creating steady demand for dairy protein systems that complement traditional food processing and provide formulation flexibility in complex nutrition development environments.
Growth Inhibitors: Raw material cost challenges vary across dairy suppliers regarding the sourcing of milk proteins and specialty processing ingredients, which may limit operational flexibility and market penetration in regions with volatile commodity prices or cost-sensitive food manufacturing operations.
Allergen sensitivity considerations persist regarding lactose content and milk protein allergies that may reduce applicability in certain consumer segments, affecting ingredient selection and formulation compatibility. Market fragmentation across multiple food specifications and processing standards creates compatibility concerns between different protein suppliers and existing production infrastructure.
Market Evolution Patterns: Adoption accelerates in functional food and sports nutrition sectors where protein requirements justify ingredient system costs, with geographic concentration in developed markets transitioning toward mainstream adoption in emerging economies driven by nutrition expansion and protein consumption development.
Technology development focuses on enhanced clean-label formulations, improved solubility characteristics, and integration with eco-friendly dairy systems that optimize functional performance and nutritional effectiveness. The market could face disruption if plant-based protein alternatives or regulatory changes significantly limit the deployment of dairy-derived proteins in food or nutrition applications.
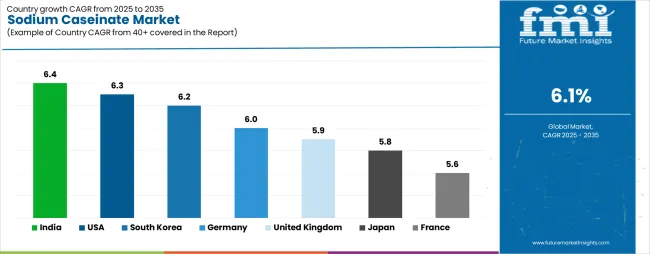
The Sodium Caseinate market demonstrates varied regional dynamics with Growth Leaders including the United States (6.3% CAGR) and India (6.4% CAGR) driving expansion through nutrition modernization and dairy processing infrastructure development.
Steady Performers encompass South Korea (6.2% CAGR), Germany (6.0% CAGR), and the United Kingdom (5.9% CAGR), benefiting from established functional food industries and advanced protein ingredient adoption. Mature Markets feature Japan (5.8% CAGR) and France (5.6% CAGR), where specialized nutrition applications and dairy technology integration support consistent growth patterns.
| Country | CAGR (2025 to 2035) |
|---|---|
| United States | 6.3% |
| India | 6.4% |
| South Korea | 6.2% |
| Germany | 6.0% |
| United Kingdom | 5.9% |
| Japan | 5.8% |
| France | 5.6% |
Regional synthesis reveals North America and Asia-Pacific markets leading adoption through nutrition expansion and functional food infrastructure development, while European countries maintain steady expansion supported by dairy protein technology advancement and clean-label standardization requirements.
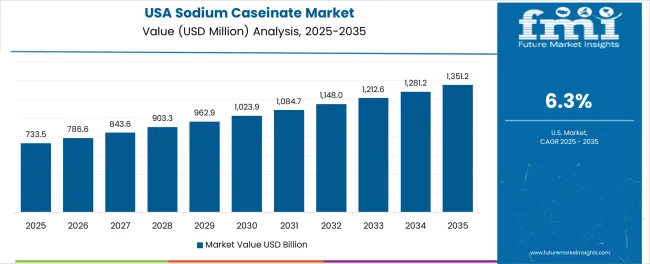
The USA market prioritizes advanced protein features, including precision functional control and integration with comprehensive nutrition platforms that manage product quality, formulation optimization, and cost control applications through unified processing systems. The country holds strong market positioning, driven by sports nutrition modernization and functional food equipment upgrades that support protein system integration. American food manufacturers prioritize operational effectiveness with caseinate systems delivering consistent functional performance through advanced formulation algorithms and processing adaptation capabilities.
Technology deployment channels include major dairy ingredient contractors, specialized nutrition equipment suppliers, and food industry procurement programs that support professional applications for complex functional food requirements. Processing platform integration capabilities with established food systems expand market appeal across diverse operational requirements seeking precision and reliability benefits.
Performance Metrics:
In Mumbai, Delhi, and Bangalore, food processing facilities and dairy production plants are implementing sodium caseinate as standard ingredients for protein fortification and functional food applications, driven by increasing nutrition industry investment and processing modernization programs that prioritize the importance of protein enrichment capabilities. The market demonstrates 6.4% CAGR, supported by government nutrition initiatives and dairy infrastructure development programs that promote advanced protein systems for food manufacturing and nutrition production facilities.
Market expansion benefits from growing dairy processing capabilities and international technology transfer agreements that enable domestic production of advanced protein systems for food and nutrition applications. Technology adoption follows patterns established in functional ingredients, where quality and performance drive procurement decisions and operational deployment.
Market Intelligence Brief:
South Korea demonstrates strong market development with 6.2% CAGR, distinguished by food manufacturers' preference for high-quality protein systems that integrate seamlessly with existing processing systems and provide reliable long-term performance in specialized nutrition applications. The market prioritizes advanced features, including precision functional control, clean-label compatibility, and integration with comprehensive food platforms that reflect Korean food industry expectations for technological sophistication and nutritional excellence.
Strategic Market Considerations:
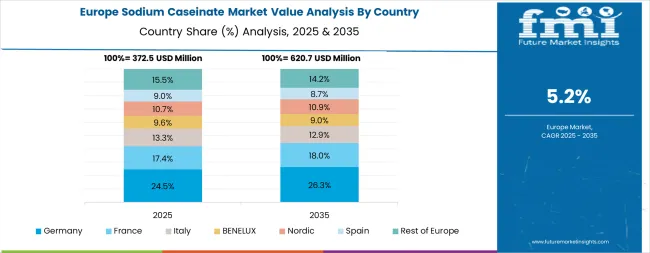
Germany's advanced dairy ingredient market demonstrates sophisticated sodium caseinate deployment with documented operational effectiveness in food processing applications and nutrition production facilities through integration with existing protein systems and clean-label infrastructure. The country leverages engineering expertise in dairy ingredients and processing systems integration to maintain 6.0% CAGR performance. Industrial centers, including Bavaria and North Rhine-Westphalia, showcase premium installations where protein systems integrate with comprehensive food platforms and formulation management systems to optimize nutrition production and functional effectiveness.
German dairy companies prioritize system reliability and EU compliance in protein development, creating demand for premium ingredient systems with advanced features, including processing monitoring integration and clean-label compatibility. The market benefits from established dairy processing infrastructure and a willingness to invest in advanced functional food technologies that provide long-term nutritional benefits and compliance with international food standards.
Market Intelligence Brief:
In London, Birmingham, and Manchester, British food processing facilities and nutrition production plants are implementing advanced protein systems to enhance functional food capabilities and support nutrition operations that align with food industry regulations and clean-label standards. The UK market holds 5.9% CAGR positioning, driven by functional food modernization programs and processing equipment upgrades that prioritize advanced protein systems for food production and nutrition applications.
Market expansion benefits from private-label functional food programs that mandate protein performance capabilities in product specifications, creating constant demand across the UK's food manufacturing and nutrition sectors, where formulation flexibility and quality represent critical requirements. The regulatory framework supports protein adoption through food equipment standards and compliance requirements that promote advanced dairy systems aligned with nutritional management capabilities.
Strategic Market Indicators:
Japan demonstrates steady market development with 5.8% CAGR, distinguished by food manufacturers' preference for high-quality protein systems that integrate seamlessly with existing nutrition systems and provide reliable long-term operation in specialized functional food applications. The market prioritizes advanced features, including precision protein control, medical nutrition compatibility, and integration with comprehensive processing platforms that reflect Japanese food industry expectations for technological sophistication and nutritional excellence.
Performance Characteristics:
France demonstrates 5.6% CAGR performance with strong foundations in dairy processing, cheese production, and premium protein ingredients. The market benefits from comprehensive dairy infrastructure and culinary traditions that prioritize high-quality ingredients in bakery, desserts, and specialty food applications. Premium dairy product development and steady nutraceutical integration support consistent protein ingredient demand across diverse food manufacturing sectors.
Market Dynamics:
Western Europe remains the anchor for sodium caseinate in 2025, led by Germany at 22.0% of regional value on the back of strong dairy processing, nutrition brands, and B2B formulation hubs around Bavaria and North Rhine-Westphalia. France follows at 18.0% with deep penetration in cheese, bakery, and premium dairy proteins.
The United Kingdom holds 16.0%, supported by sports-nutrition and high-protein convenience categories. Italy accounts for 12.0% through specialty dairy and gelato bases, while the Netherlands at 9.0% benefits from export-oriented ingredients producers.
Spain contributes 8.0% via bakery and ready meals. The Rest of Europe totals 15.0%, reflecting steady uptake in the Nordics, Ireland, and Central/Eastern Europe. By 2035, Germany eases marginally to 21.5% as share diffuses across France (18.5%) and the UK (16.2%); Italy (12.3%), the Netherlands (9.2%), and Spain (8.1%) edge up with modernization of dairy and functional foods; Rest of Europe normalizes to 14.2%.
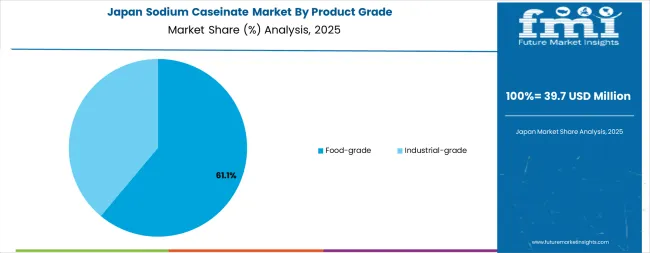
In Japan, the market prioritizes food-grade systems, which capture the dominant share of nutrition manufacturing and food production installations due to their advanced features, including precision protein formulation optimization and seamless integration with existing food processing infrastructure.
Japanese food manufacturers prioritize reliability, precision, and long-term operational excellence, creating demand for food-grade systems that provide consistent functional capabilities and adaptive protein performance based on formulation requirements and processing conditions.
Industrial-grade types maintain secondary positions primarily in specialized applications and technical manufacturing installations where comprehensive protein functionality meets operational requirements without compromising production efficiency.
Market Characteristics:
In South Korea, the market structure favors international dairy cooperatives, including FrieslandCampina Ingredients, Arla Foods Ingredients, and Kerry Group, which maintain dominant positions through comprehensive product portfolios and established food industry networks supporting both nutrition manufacturing and food production installations.
These providers offer integrated solutions combining advanced protein systems with professional formulation services and ongoing technical support that appeal to Korean food manufacturers seeking reliable dairy ingredient systems.
Local ingredient contractors and system integrators capture a moderate market share by providing localized service capabilities and competitive pricing for standard food manufacturing installations. At the same time, domestic manufacturers focus on specialized applications and cost-effective solutions tailored to Korean food characteristics.
Channel Insights:
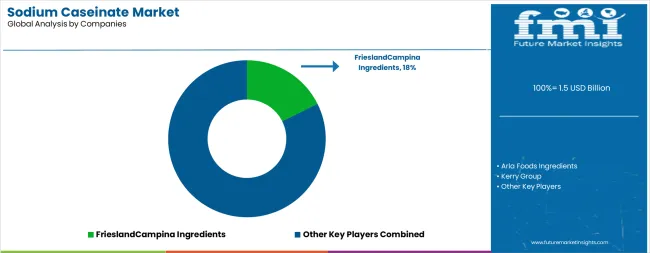
The market operates with moderate concentration, featuring approximately 10-12 meaningful participants, where leading companies control roughly 48-53% of the global market share through established food industry relationships and comprehensive dairy protein portfolios. Competition prioritizes advanced protein formulation capabilities, system reliability, and food processing platform integration rather than price-based rivalry.
Market Leaders encompass FrieslandCampina Ingredients, Arla Foods Ingredients, and Kerry Group, which maintain competitive advantages through extensive dairy protein expertise, global food industry contractor networks, and comprehensive system integration capabilities that create customer switching costs and support premium pricing. These companies leverage decades of dairy technology experience and ongoing research investments to develop advanced protein systems with precision emulsification control and food processing monitoring features.
Technology Innovators include Fonterra Co-operative Group, AMCO Proteins, and Tatua Cooperative Dairy Company, which compete through specialized protein formulation technology focus and innovative application interfaces that appeal to food manufacturers seeking advanced functional capabilities and operational flexibility. These companies differentiate through rapid dairy development cycles and specialized nutrition application focus.
Regional Specialists feature companies like Charotar Casein Company, Dairygold Co-Operative Society, and Farbest Brands, which focus on specific geographic markets and specialized applications, including casein-based systems and integrated food processing solutions. Market dynamics favor participants that combine reliable protein formulations with advanced processing software, including precision functional control and automatic performance optimization capabilities.
Competitive pressure intensifies as traditional dairy ingredient contractors expand into caseinate systems. In contrast, specialized protein companies challenge established players through innovative formulation solutions and cost-effective platforms targeting specialized nutrition manufacturing segments.
| Item | Value |
|---|---|
| Quantitative Units | USD 1.5 billion |
| Product Grade | Food-grade, Industrial-grade |
| Application | Food additives, Emulsifiers, Free-fat stabilizers, Others (thickening/foaming/encapsulation) |
| End Use | Food & beverages, Dairy products, Bakery & confectionery, Ready-to-eat & frozen foods, Pharmaceuticals/cosmetics/chemicals/other industrial |
| Regions Covered | North America, Europe, Asia Pacific, Latin America, Middle East & Africa |
| Countries Covered | United States, India, South Korea, Germany, United Kingdom, Japan, France, and 25+ additional countries |
| Key Companies Profiled | FrieslandCampina Ingredients, Arla Foods Ingredients, Kerry Group, Fonterra Co-operative Group, AMCO Proteins, Charotar Casein Company, Dairygold Co-Operative Society |
| Additional Attributes | Dollar sales by product grade and application categories, regional adoption trends across North America, Europe, and Asia-Pacific, competitive landscape with dairy cooperatives and nutrition suppliers, food manufacturer preferences for precision functional control and system reliability, integration with food processing platforms and nutrition monitoring systems, innovations in protein-based formulations and clean-label development, and development of automated application solutions with enhanced performance and nutrition optimization capabilities. |
The global sodium caseinate market is estimated to be valued at USD 1.5 billion in 2025.
The market size for the sodium caseinate market is projected to reach USD 2.7 billion by 2035.
The sodium caseinate market is expected to grow at a 6.1% CAGR between 2025 and 2035.
The key product types in sodium caseinate market are food-grade and industrial-grade.
In terms of application, food additives segment to command 38.0% share in the sodium caseinate market in 2025.


Full Research Suite comprises of:
Market outlook & trends analysis
Interviews & case studies
Strategic recommendations
Vendor profiles & capabilities analysis
5-year forecasts
8 regions and 60+ country-level data splits
Market segment data splits
12 months of continuous data updates
DELIVERED AS:
PDF EXCEL ONLINE
Demand for Sodium Caseinates in EU Size and Share Forecast Outlook 2025 to 2035
Sodium Difluorophosphate (NaDFP) Market Size and Share Forecast Outlook 2025 to 2035
Sodium Bisulfite Market Size and Share Forecast Outlook 2025 to 2035
Sodium Formate Market Size and Share Forecast Outlook 2025 to 2035
Sodium Borohydride Market Size and Share Forecast Outlook 2025 to 2035
Sodium Chloride Market Size and Share Forecast Outlook 2025 to 2035
Sodium Lactate Market Size and Share Forecast Outlook 2025 to 2035
Sodium Caprylate Market Size and Share Forecast Outlook 2025 to 2035
Sodium Iodide Market Size and Share Forecast Outlook 2025 to 2035
Sodium Lauryl Sulphate Market Size and Share Forecast Outlook 2025 to 2035
Sodium Cumenesulfonate Market Size and Share Forecast Outlook 2025 to 2035
Sodium Stearoyl Lactate Market Size and Share Forecast Outlook 2025 to 2035
Sodium Hydrosulfite Market Size and Share Forecast Outlook 2025 to 2035
Sodium Sulphate Market Size and Share Forecast Outlook 2025 to 2035
Sodium-Ion Batteries Market Analysis - Size, Share, and Forecast Outlook 2025 to 2035
Sodium Hyaluronate Crosslinked Market Size and Share Forecast Outlook 2025 to 2035
Sodium Sulfur Batteries Market Size and Share Forecast Outlook 2025 to 2035
Sodium Malate Market Size and Share Forecast Outlook 2025 to 2035
Sodium Thiosulphate Market Size and Share Forecast Outlook 2025 to 2035
Sodium Lauroyl Isethionate Market Size and Share Forecast Outlook 2025 to 2035

Thank you!
You will receive an email from our Business Development Manager. Please be sure to check your SPAM/JUNK folder too.
Chat With
MaRIA