Sodium Chloride Market Size and Share Forecast Outlook 2025 to 2035

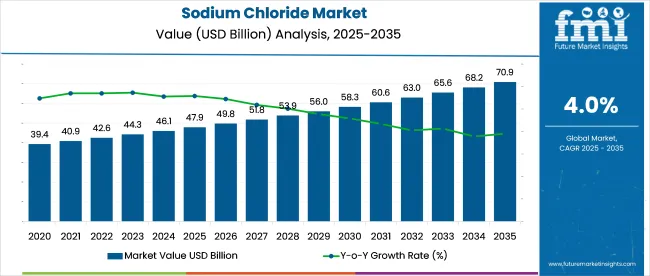
The global sodium chloride market is forecasted to reach USD 70.9 billion by 2035, recording an absolute increase of USD 23.0 billion over the forecast period. The market is valued at USD 47.9 billion in 2025 and is set to rise at a CAGR of 4.0% during the assessment period. The overall market size is expected to grow by nearly 1.5 times during the same period, supported by increasing demand for chlor-alkali chemicals and water treatment solutions worldwide, driving demand for efficient industrial salt supplies and increasing investments in chemical manufacturing, municipal infrastructure, and food processing globally. Environmental concerns regarding salt production and competition from synthetic alternatives in specific applications may pose challenges to market expansion.
Quick Stats for Sodium Chloride Market

  • Sodium Chloride Market Value (2025): USD 47.9 billion
  • Sodium Chloride Market Forecast Value (2035): USD 70.9 billion
  • Sodium Chloride Market Forecast CAGR: 4.0%
  • Leading End-Use in Sodium Chloride Market: Chemicals
  • Key Growth Regions in Sodium Chloride Market: Asia Pacific, North America, and Europe
  • Top Key Players in Sodium Chloride Market: Cargill, Compass Minerals International, K+S Aktiengesellschaft, Tata Chemicals, INEOS, Dampier Salt, Salins Group, Südwestdeutsche Salzwerke, Nouryon, Dominion Salt
  • Sodium Chloride Market Year-over-Year Forecast (2025-2035)
Sodium Chloride Market Market Value Analysis

Between 2025 and 2030, the market is projected to expand from USD 47.9 billion to USD 58.7 billion, resulting in a value increase of USD 10.8 billion, which represents 47.0% of the total forecast growth for the decade. This phase of development will be shaped by rising demand for chlorine and caustic soda production, product innovation in high-purity pharmaceutical grades and specialty formulations, as well as expanding integration with water treatment infrastructure and food safety programs. Companies are establishing competitive positions through investment in solar evaporation facilities, solution mining technologies, and strategic market expansion across chemical manufacturing, deicing, and food-grade applications.

From 2030 to 2035, the market is forecast to grow from USD 58.7 billion to USD 70.9 billion, adding another USD 12.2 billion, which constitutes 53.0% of the overall ten-year expansion. This period is expected to be characterized by the expansion of specialized sodium chloride systems, including advanced vacuum-refined grades and integrated brine solutions tailored for specific industry requirements, strategic collaborations between salt producers and end-user industries, and an enhanced focus on ecofriendly production methods and environmental compliance. The growing focus on water infrastructure development and pharmaceutical manufacturing quality will drive demand for high-purity sodium chloride solutions across diverse industrial applications.

Sodium Chloride Market Key Takeaways

Metric Value
Market Value (2025) USD 47.9 billion
Market Forecast Value (2035) USD 70.9 billion
Forecast CAGR (2025-2035) 4.0%

Why is the Sodium Chloride Market Growing?

The sodium chloride market grows by enabling chemical manufacturers to produce essential industrial chemicals including chlorine, caustic soda, and soda ash that serve as building blocks for countless downstream products ranging from PVC plastics to pharmaceuticals. Chemical industries face continuous demand growth for chlor-alkali products, with sodium chloride serving as the primary feedstock for electrolytic chlorine production used in water treatment, polymers, and industrial chemicals manufacturing. The water treatment sector's expansion driven by urbanization and infrastructure development creates steady demand for sodium chloride in water softening systems, municipal water treatment facilities, and industrial process water conditioning.

Municipal infrastructure development accelerates sodium chloride adoption for road deicing and snow removal in northern climates, where highway safety programs require reliable winter maintenance material supplies ensuring transportation system functionality during winter weather events. Food processing industry growth drives demand for food-grade sodium chloride serving preservation, flavor enhancement, and processing functions across packaged foods, dairy products, and meat processing applications. Environmental concerns regarding salt runoff impacts on freshwater ecosystems and soil quality may drive regulatory restrictions on deicing applications, while technological alternatives including potassium chloride in water softening and alternative deicing agents create competitive pressure in specific market segments.

Segmental Analysis

The market is segmented by end use, product form, source, and region. By end use, the market is divided into chemicals, food & beverages, water treatment, deicing, industrial, oil & gas, pharmaceuticals, and agriculture. Based on product form, the market is categorized into solid, liquid brine, and high-purity refined/vacuum salt. By source, the market is segmented into sea water & brine and solid mining. Regionally, the market is divided into Asia Pacific, Europe, North America, Latin America, and Middle East & Africa.
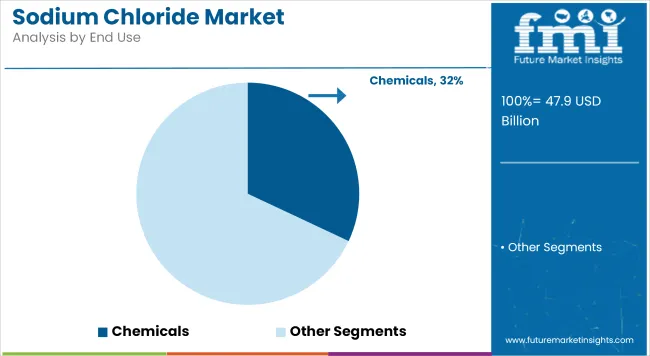
By End Use, the Chemicals Segment Accounts for a Dominant Market Share

Sodium Chloride Market Analysis By End Use

The chemicals segment represents the dominant force in the market, capturing approximately 32.0% of total market share in 2025. This critical end-use category encompasses sodium chloride consumption as feedstock for chlor-alkali production, soda ash manufacturing, and other chemical derivative processes that form the foundation of modern chemical industry value chains. The chemicals segment's market leadership stems from chlorine and caustic soda's indispensable roles across polymer manufacturing, water treatment chemicals, pharmaceutical intermediates, and industrial chemical production requiring large-scale, reliable salt supply.

Within the chemicals end-use segment, chlor-alkali production including chlorine and caustic soda manufacturing accounts for 21.0% of total market share, serving as the largest single sodium chloride application through electrolytic processes producing chlorine gas and sodium hydroxide for PVC, pulp and paper, and chemical synthesis. Soda ash production represents 7.0% share through Solvay process and other synthetic routes producing sodium carbonate for glass manufacturing, detergents, and chemical processing. Other chemical derivatives capture 4.0% share in specialty chemical production and industrial processes.

Food & beverages represent 19.0% market share through food preservation, flavor enhancement, and dairy processing. Water treatment accounts for 14.0% share in municipal and industrial water softening and purification. Deicing captures 13.0% share through road salt applications. Industrial non-chemical uses represent 9.0%, oil & gas holds 5.0%, pharmaceuticals account for 4.0%, and agriculture represents 4.0% of the market.

Key technological advantages driving the chemicals segment include:
  • Essential feedstock position in chlor-alkali electrolysis producing chlorine and caustic soda for diverse downstream industries
  • Large-volume consumption requirements creating stable demand patterns supporting long-term supply contracts
  • Quality specifications accommodating various salt grades from rock salt to refined forms depending on process requirements
  • Established infrastructure including pipeline brine delivery and bulk handling systems optimizing logistics and costs

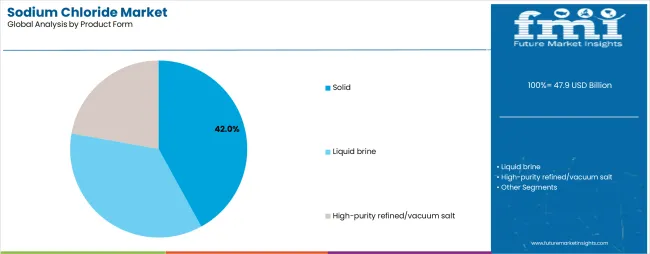
By Product Form, the Solid Segment Accounts for the Largest Market Share

Sodium Chloride Market Analysis By Product Form

Solid sodium chloride dominates the product form segment with approximately 42.0% market share in 2025, reflecting diverse applications ranging from deicing and food processing to chemical feedstock requiring crystalline or granular salt forms. The solid segment's market leadership is supported by versatile application compatibility, established production infrastructure, and cost-effectiveness for bulk industrial and municipal uses requiring dry salt handling and storage systems.

Within the solid product form segment, rock salt mined directly from underground deposits accounts for 18.0% of total market share, serving deicing, industrial, and chemical applications where lower purity grades meet functional requirements at competitive costs. Solar-evaporated salt produced through seawater or brine evaporation in coastal facilities represents 16.0% share through natural evaporation processes yielding high-purity crystals suitable for food and chemical uses. Pellets and tablets including water softener salt capture 8.0% share in consumer and commercial water treatment applications requiring dissolution-optimized forms.

Liquid brine accounts for 39.0% market share through direct use in chemical manufacturing, pipeline delivery to chlor-alkali plants, and deicing applications utilizing pre-wetted or liquid application methods. High-purity refined and vacuum salt represents 19.0% of the market through specialty pharmaceutical, food-grade, and analytical applications requiring ultra-pure sodium chloride meeting stringent quality specifications.

Key factors driving solid form dominance include:

  • Versatile application compatibility spanning deicing, food processing, water softening, and industrial chemical uses
  • Established logistics infrastructure including rail, truck, and bulk handling systems optimized for solid salt distribution
  • Storage stability enabling seasonal stockpiling for deicing programs and industrial inventory management
  • Cost-effectiveness for high-volume applications where solid form handling and dissolution are straightforward

What are the Drivers, Restraints, and Key Trends of the Sodium Chloride Market?

The market is driven by three concrete demand factors tied to industrial chemical production and infrastructure development. First, chlor-alkali industry expansion supporting PVC production, water treatment chemicals, and industrial chlorine applications creates fundamental demand for sodium chloride feedstock, with global chlorine production capacity projected to grow 3-4% annually driven by construction materials, water infrastructure, and pharmaceutical intermediates requiring reliable salt supply at multi-million-ton scale for integrated chemical complexes. Second, urban infrastructure development and water quality improvement programs drive municipal water treatment sodium chloride consumption, with water softening systems requiring continuous salt supply for ion exchange regeneration in municipal facilities, commercial buildings, and industrial process water systems addressing hardness issues and improving water quality for equipment protection and consumer applications. Third, winter road safety programs and expanding highway networks in northern climates sustain deicing market growth, with state departments of transportation and municipal public works departments stockpiling millions of tons annually for snow and ice control operations ensuring transportation system reliability and public safety during winter weather events.

Market restraints include environmental concerns regarding sodium chloride impacts on freshwater ecosystems, soil chemistry, and vegetation health creating regulatory pressure to reduce deicing salt application rates, implement best management practices, and evaluate alternative materials including calcium chloride, magnesium chloride, and organic deicers that may substitute for traditional rock salt in environmentally sensitive areas. Production energy intensity and greenhouse gas emissions associated with vacuum refining and transportation create sustainability challenges, particularly for high-purity pharmaceutical and food-grade products requiring energy-intensive processing and long-distance logistics from production facilities to end-use markets. Competition from substitute materials including potassium chloride in water softening applications and alternative chemical feedstocks for specific industrial processes creates pressure in selected market segments where technical performance and economic considerations favor alternative materials.

Key trends indicate growing adoption of liquid brine and pre-wetted salt applications for deicing operations improving efficiency and environmental performance through reduced material usage, enhanced ice-melting effectiveness, and minimized scatter losses compared to traditional dry salt spreading, with many highway agencies transitioning winter maintenance strategies. Innovation in high-purity pharmaceutical-grade production supports growing demand for intravenous solutions, dialysis, and biotechnology applications requiring ultra-pure sodium chloride meeting USP, EP, and other stringent pharmacopeia specifications validated through advanced refining and quality control processes. Increasing integration of desalination by-product salt recovery provides alternative supply sources in water-scarce regions where seawater desalination facilities generate concentrated brine streams that can be processed into commercial salt products supporting circular economy principles.

Analysis of the Sodium Chloride Market by Key Country

Country CAGR (2025-2035)
India 5.2%
China 4.8%
USA 4.0%
Brazil 4.3%
Canada 4.2%
Mexico 4.1%
Germany 3.6%

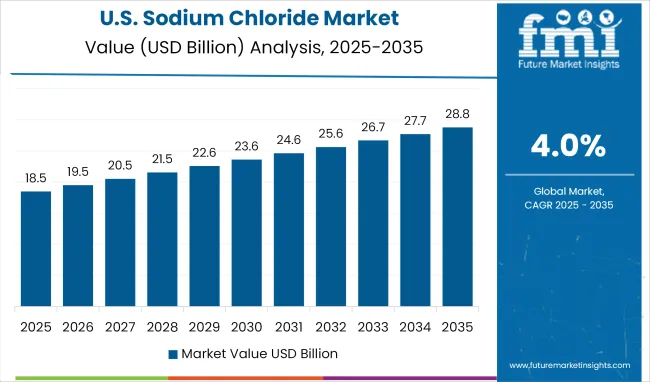
The global market is anticipated to expand moderately between 2025 and 2035, supported by rising demand from chemical manufacturing, food processing, and de-icing applications. India leads with a CAGR of 5.2%, driven by expanding chlor-alkali production and industrial salt utilization. China follows at 4.8%, supported by consistent demand from chemical processing and water treatment industries. Brazil records a 4.3% CAGR, reflecting increasing industrial use and food-grade salt consumption. The United States grows at 4.0%, driven by steady demand for de-icing and chemical applications. Canada and Mexico show similar growth at 4.2% and 4.1%, respectively, supported by industrial and food processing sectors. Germany registers a 3.6% CAGR, reflecting a mature European market with stable demand for industrial and de-icing salt, coupled with efficiency improvements in production and distribution across regional supply chains.

The report covers an in-depth analysis of 40+ countries, top-performing countries are highlighted below.

India Leads Global Market Expansion

India demonstrates the strongest growth potential in the market with a CAGR of 5.2% through 2035. The country's leadership position stems from packaged food industry expansion requiring food-grade salt, pharmaceutical-grade vacuum salt capacity development supporting IV solutions and dialysis applications, and extensive coastal solar evaporation infrastructure in Gujarat, Tamil Nadu, and Rajasthan. Growth is concentrated in major producing and consuming regions, including Gujarat's coastal districts for solar salt production, Maharashtra for chemical and pharmaceutical applications, and Tamil Nadu for food processing and industrial uses. Distribution channels through established chemical trading networks and direct supply relationships with food processors and pharmaceutical manufacturers expand deployment across diverse applications. The country's Make in India initiatives and pharmaceutical export growth provide policy support for high-purity salt production and quality standards enhancement.

Key market factors:

  • Packaged food sector expansion driving demand for food-grade sodium chloride in preservation and flavor applications
  • Pharmaceutical-grade vacuum salt capacity supporting domestic and export markets for IV fluids and dialysis applications
  • Coastal solar pan infrastructure providing low-cost salt production through natural evaporation in arid coastal regions
  • Industrial water treatment growth supporting municipal and commercial water softening salt consumption

China Emerges as Chemical Industry Hub

In major industrial provinces including Shandong, Jiangsu, Zhejiang, and coastal regions, sodium chloride consumption is accelerating across chlor-alkali production facilities, industrial water treatment systems, and refined salt processing operations, driven by chemical industry expansion and urbanization. The market demonstrates strong growth momentum with a CAGR of 4.8% through 2035, linked to PVC production capacity additions and comprehensive chemical complex development serving construction materials and industrial chemicals. Chinese manufacturers are implementing modern solar evaporation facilities and vacuum refining capacity producing pharmaceutical and food-grade products meeting international quality standards. The country's integrated chemical industry structure and coastal salt production advantages create steady demand for both brine feedstock and solid salt products.

Key market characteristics:
  • Chlor-alkali production clusters in coastal provinces driving large-volume sodium chloride consumption for chlorine manufacturing
  • Industrial water treatment expansion supporting municipal and industrial water softening applications in urban centers
  • Refined grade capacity growth producing pharmaceutical and food-grade products for domestic and export markets
  • Government chemical industry development policies supporting integrated salt-chlor-alkali-PVC value chains

United States Demonstrates Diversified Demand

Sodium Chloride Market Country Value Analysis

The United States market demonstrates mature sodium chloride consumption patterns across water softening, deicing, and chemical manufacturing applications, with documented usage in residential and commercial water treatment systems, comprehensive highway winter maintenance programs, and Gulf Coast chlor-alkali facilities. The country shows steady growth potential with a CAGR of 4.0% through 2035, driven by ongoing infrastructure development, population growth in water-scarce regions requiring softening, and consistent winter maintenance requirements across northern states. American consumers and industries utilize sodium chloride across diverse applications including consumer water softening tablets, bulk road salt stockpiles, and pipeline brine delivery to integrated chemical complexes. Established supply chains including Great Lakes mining operations and Gulf Coast solar facilities support reliable material availability.

Key development areas:

  • Water softening applications in residential, commercial, and industrial facilities addressing hard water quality issues
  • Deicing programs across northern states stockpiling millions of tons for winter road maintenance operations
  • Gulf Coast chemical manufacturing consuming brine feedstock for chlorine, caustic soda, and chemical intermediate production
  • Food processing industry utilizing food-grade sodium chloride in meat processing, dairy, and packaged foods

Brazil Shows Chemical Industry Growth

Brazil's market expansion is driven by PVC value chain development supporting construction and packaging industries, processed food sector growth consuming food-grade salt, and municipal water infrastructure expansion requiring water treatment chemicals. The country demonstrates solid growth potential with a CAGR of 4.3% through 2035, supported by domestic chemical industry investment and urbanization trends. Brazilian manufacturers are developing integrated chlor-alkali capacity and solar evaporation facilities in coastal regions producing material for chemical and food applications. Growing focus on domestic chemical production and processed food manufacturing creates compelling business cases for sodium chloride production capacity expansion and quality improvement initiatives.

Market characteristics:

  • PVC chain growth supporting chlor-alkali capacity additions requiring sodium chloride feedstock supply
  • Processed food industry expansion driving demand for food-grade salt in preservation and processing applications
  • Municipal water treatment infrastructure development consuming sodium chloride for water softening and purification
  • Coastal solar evaporation facilities producing salt from seawater through natural evaporation processes

Canada Maintains Winter Services Leadership

Canada's market demonstrates strong sodium chloride consumption driven by entrenched deicing programs across provinces, petrochemical industry requirements in Alberta and Ontario, and water treatment applications supporting municipal infrastructure. The country shows steady growth potential with a CAGR of 4.2% through 2035, driven by reliable winter maintenance programs, potash industry by-product salt availability, and chemical manufacturing requirements. Canadian municipalities and provincial transportation departments maintain comprehensive rock salt stockpiles supporting winter road maintenance operations ensuring highway safety and transportation system functionality during extended winter seasons. Established mining operations and import infrastructure from United States suppliers support reliable material availability for seasonal demand patterns.

Key market characteristics:

  • Deicing programs across all provinces maintaining comprehensive winter road maintenance operations with rock salt
  • Petrochemical industry in Alberta and Ontario consuming sodium chloride for chemical production and process applications
  • Municipal water softening supporting residential and commercial water treatment systems in hard water regions
  • Mining operations and import infrastructure ensuring reliable supply for seasonal deicing demand peaks

Mexico Demonstrates Chemical Integration

Mexico's market demonstrates growth through integrated chlor-alkali facilities serving PVC and chemical industries, water treatment infrastructure expansion supporting urban development, and food processing sector requirements. The country shows solid growth potential with a CAGR of 4.1% through 2035, driven by nearshoring manufacturing trends, chemical industry investment, and urban infrastructure development. Mexican manufacturers are operating integrated salt-chlorine-PVC complexes and expanding water treatment capacity supporting municipal and industrial applications. Coastal solar evaporation facilities and solution mining operations provide material for chemical and food applications serving domestic and export markets.

Market development factors:

  • Integrated chlor-alkali facilities producing chlorine and caustic soda for PVC and chemical manufacturing
  • Water treatment infrastructure retrofits and expansion supporting municipal water quality improvement programs
  • Food processing sector growth consuming food-grade sodium chloride in diverse applications
  • Nearshoring manufacturing trends driving chemical industry investment requiring sodium chloride feedstock

Germany Emphasizes Mature Chemical Applications

Germany's advanced chemical industry demonstrates mature sodium chloride consumption patterns focused on chlor-alkali production, industrial water softening, and pre-wetted winter service applications, with documented integration across established chemical complexes and municipal infrastructure systems. The country maintains moderate growth momentum with a CAGR of 3.6% through 2035, driven by ongoing chemical production supporting automotive, construction, and pharmaceutical industries. German operations prioritize efficiency, environmental compliance, and quality standards, creating steady demand for reliable sodium chloride supply from domestic mining operations and European producers. The market benefits from established infrastructure including solution mining facilities and brine pipeline networks supporting integrated chemical production.

Market development factors:
  • Chlor-alkali integration supporting chemical manufacturing clusters producing chlorine and caustic soda
  • Industrial water softening applications across manufacturing facilities and commercial buildings
  • Pre-wetted brine deicing programs implementing best management practices reducing environmental impacts
  • Mature chemical market focusing efficiency improvements and environmental compliance standards

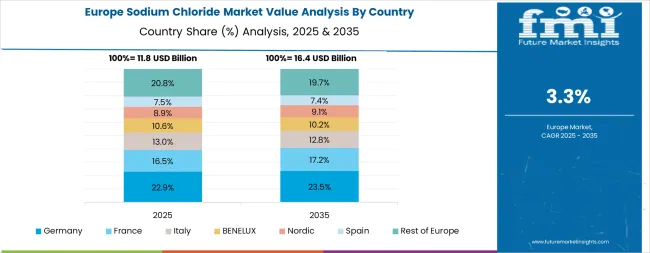
Europe Market Split by Country

Sodium Chloride Market Europe Country Market Share Analysis, 2025 & 2035

The sodium chloride market in Europe accounts for an estimated 28.0% of global spending in 2025, with regional concentration in chemical manufacturing, water treatment, and deicing applications. Within Europe, Germany leads with approximately 19% of regional market share, supported by chlor-alkali integration, industrial water softening applications, and pre-wetted winter service programs in major industrial centers focusing efficiency and environmental compliance.

The United Kingdom follows with approximately 15% share driven by municipal deicing operations, food processing applications, and water utility requirements across England, Scotland, and Wales. France holds approximately 14% share supported by refined food and pharmaceutical-grade production alongside PVC value chain integration. Italy commands approximately 11% market share driven by packaged food applications, tanning and leather industry clusters, and coastal solar salt production in southern regions.

Spain accounts for approximately 9% share supported by food processing applications and chemical manufacturing hubs in coastal industrial areas. Netherlands captures approximately 8% share through Rotterdam chlor-alkali and PVC complexes alongside water treatment applications. Poland represents approximately 7% share driven by packaging, chemicals, and winter maintenance requirements. The Nordic region collectively holds approximately 7% share focusing high-specification road salt and strict environmental controls on deicing operations. Rest of Eastern Europe accounts for approximately 10% of regional market share through integrated chemical parks, district heating brine applications, and public-sector procurement programs.

The European market benefits from established regulatory frameworks governing food-grade salt specifications, pharmaceutical quality standards, and environmental best practices for deicing operations, supporting quality-focused production and application methods. Integration of chlor-alkali production facilities with salt supply infrastructure creates stable long-term demand patterns, while seasonal deicing requirements and water treatment applications provide diversified end-use consumption across the region.

High-Purity Applications Dominate in Japan

The Japanese market demonstrates a mature and quality-focused landscape, characterized by sophisticated integration of pharmaceutical-grade vacuum salt and food-grade refined products with existing chemical manufacturing and consumer applications. Japan's focus on quality excellence and strict specifications drives demand for ultra-pure sodium chloride supporting pharmaceutical manufacturing, food processing, and specialty chemical applications meeting stringent purity and consistency requirements. The market benefits from established supply chains connecting domestic producers and international suppliers with pharmaceutical manufacturers and food processors, creating comprehensive quality assurance systems prioritizing material purity and documentation. Manufacturing facilities showcase advanced quality control implementations where sodium chloride products achieve exceptional consistency through integrated testing and validation supporting pharmaceutical and food industry requirements.

Chemical and Food Applications Lead in South Korea

The South Korean market is characterized by focus on chlor-alkali production supporting PVC manufacturing, food processing applications, and water treatment requirements in urban centers. The market demonstrates stable demand patterns as Korean chemical manufacturers and food processors source reliable sodium chloride supply from domestic coastal solar facilities and import sources. Local salt producers and international suppliers maintain market presence through quality assurance programs and technical service supporting chemical and food industry applications deployed across integrated industrial complexes and food processing facilities. The competitive landscape shows established supply relationships between salt producers and major end-users, creating stable commercial frameworks balancing domestic production with strategic imports meeting volume and quality requirements across chemical, food, and water treatment applications.
Competitive Landscape of the Sodium Chloride Market

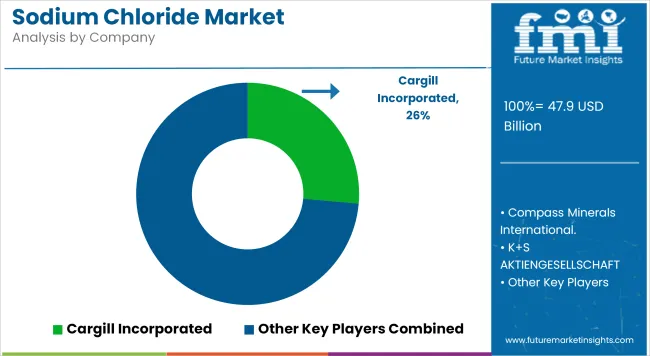
Sodium Chloride Market Analysis By Company

The market features approximately 20-25 meaningful players with moderate concentration, where the top three companies control roughly 25-30% of global market share through established production assets and extensive logistics networks. Competition centers on production scale, logistics efficiency, and quality consistency rather than product differentiation alone. The leading company, Cargill Incorporated, commands approximately 9.0% of global market share through diversified salt operations including solar evaporation facilities, mining assets, and vacuum refining capacity serving food, chemical, and deicing applications across multiple continents.

Market leaders include Cargill Incorporated, Compass Minerals International, and K+S Aktiengesellschaft, which maintain competitive advantages through vertically integrated production operations, established logistics infrastructure including rail terminals and bulk handling facilities, and comprehensive product portfolios spanning industrial, food-grade, and pharmaceutical-quality specifications, creating switching barriers through supply reliability and consistent quality. These companies leverage production scale and strategic asset locations to defend market positions while expanding into specialty applications and geographic markets.

Challengers encompass Tata Chemicals Ltd. with strong positions in Indian and global markets, INEOS (INOVYN) ChlorVinyls with integrated chlor-alkali operations, and Dampier Salt Ltd. (Rio Tinto) with large-scale Australian solar salt production. Regional specialists including Salins Group focusing on European solar salt, Südwestdeutsche Salzwerke AG with German rock salt operations, Nouryon serving chemical industry applications, and Dominion Salt Ltd. with New Zealand production focus on specific geographic markets or quality grades, offering differentiated capabilities in local supply, specialty refining, and application-specific formulations.

Regional players and emerging producers create competitive pressure through capacity expansion and cost-advantaged production, particularly in high-growth markets including India, China, and Middle East where coastal solar evaporation facilities and solution mining operations provide logistics advantages and cost competitiveness. Market dynamics favor companies that combine reliable production operations with comprehensive logistics infrastructure addressing complete supply chain requirements from mining or evaporation through bulk handling, packaging, and delivered supply meeting customer volume, quality, and timing requirements across diverse applications.

Global Sodium Chloride Market - Stakeholder Contribution Framework

Sodium chloride represents an essential industrial commodity and consumer product that enables chemical manufacturers to produce chlorine and caustic soda through electrolysis, supports municipal infrastructure through water treatment and winter road maintenance, and serves fundamental roles in food preservation and processing, delivering reliable, cost-effective supply of a naturally abundant mineral resource with applications spanning chemical feedstock (32% end-use share), food processing (19% share), and water treatment (14% share) across diverse industrial and consumer markets. With the market projected to grow from USD 47.9 billion in 2025 to USD 70.9 billion by 2035 at a 4.0% CAGR, these mineral systems offer compelling advantages - abundant availability, established infrastructure, and versatile functionality - making them indispensable across chemical manufacturing, infrastructure maintenance, and food processing sectors requiring reliable salt supply for essential applications.

How Governments Could Spur Local Production and Adoption?

  • Resource Management & Mining Policy: Maintain access to geological salt formations and coastal areas for mining and solar evaporation operations, implement balanced resource development regulations protecting environmental values while enabling efficient extraction, and support infrastructure development including transportation networks connecting production facilities with consumption centers.
  • Environmental Best Practices: Establish science-based guidelines for deicing salt application rates minimizing ecosystem impacts while maintaining public safety, promote adoption of liquid brine and pre-wetted salt technologies improving efficiency, and support research on environmental fate and mitigation strategies addressing freshwater and soil impacts.
  • Infrastructure Investment: Fund water treatment facility upgrades incorporating efficient salt-based softening systems, support highway department equipment and storage infrastructure for winter maintenance operations, and maintain strategic salt reserves ensuring supply reliability for critical deicing and emergency response applications.
  • Quality & Safety Standards: Enforce food-grade and pharmaceutical-grade sodium chloride specifications ensuring consumer safety and product quality, maintain testing infrastructure validating purity and contaminant levels, and harmonize international standards facilitating trade in refined salt products across borders.
  • Circular Economy Integration: Promote salt recovery from desalination plant brine streams creating beneficial by-product utilization, support research on salt recycling from industrial processes, and establish frameworks for beneficial reuse of salt-impacted materials where technically and environmentally appropriate.

How Industry Bodies Could Support Market Development?

  • Quality Standards & Specifications: Maintain comprehensive grade definitions for food, pharmaceutical, industrial, and deicing applications covering solid (42% form dominance), liquid brine, and refined salt products, establish testing protocols validating purity and performance characteristics, and create certification programs ensuring consistent quality across supply chains.
  • Environmental Stewardship: Develop best management practices for deicing salt application optimizing road safety while minimizing environmental impacts, establish guidelines for brine management in solar evaporation and solution mining operations, and promote ecofriendly production methods reducing energy consumption and emissions.
  • Technical Education: Provide training programs for water treatment operators, highway maintenance personnel, and food processing technicians on proper salt selection and application methods, establish certification programs validating technical competency, and create knowledge resources supporting optimal use across applications.
  • Supply Chain Coordination: Facilitate long-term supply agreements between producers and major consumers ensuring reliable material availability, establish contingency planning frameworks addressing supply disruptions or extreme weather events, and promote transparency in pricing and availability information supporting market efficiency.

How Producers and Mining Companies Could Strengthen the Ecosystem?

  • Production Optimization: Invest in efficient solar evaporation facilities utilizing favorable coastal climates and geology, develop solution mining technologies accessing deep salt formations with minimal surface disturbance, and implement vacuum refining processes producing pharmaceutical and food-grade products meeting stringent specifications.
  • Logistics Infrastructure: Build strategic production and storage locations near major consumption centers, establish rail terminals and bulk handling facilities enabling efficient high-volume distribution, and develop flexible logistics capabilities addressing seasonal demand fluctuations particularly for deicing applications.
  • Quality Assurance: Implement comprehensive testing programs validating product specifications across production batches, maintain traceability systems supporting food safety and pharmaceutical regulatory requirements, and invest in analytical capabilities ensuring compliance with customer specifications and regulatory standards.
  • Green Initiatives: Adopt renewable energy in production and processing operations reducing carbon footprint, implement water management systems minimizing freshwater consumption and environmental discharge, and pursue certifications validating responsible production practices including environmental management and worker safety.

How End-User Industries Could Navigate the Shift?

  • Chemical Manufacturing: Establish long-term supply agreements with salt producers ensuring reliable feedstock for chlor-alkali operations, optimize brine quality specifications balancing purity requirements with cost considerations, and implement process improvements maximizing salt utilization efficiency and minimizing waste streams.
  • Deicing Operations: Adopt best management practices including pre-wetting, calibrated application equipment, and weather-based decision support optimizing salt effectiveness while reducing environmental impacts, implement liquid brine anti-icing strategies preventing bond formation, and maintain adequate storage infrastructure ensuring material availability during severe weather events.
  • Water Treatment: Select appropriate salt products meeting softener system specifications and operational requirements, implement quality control programs ensuring incoming material consistency, and optimize regeneration cycles balancing water quality objectives with salt consumption efficiency and operational costs.
  • Food Processing: Source certified food-grade salt meeting applicable food safety regulations and quality specifications, implement supplier qualification programs validating production controls and testing protocols, and maintain traceability systems supporting food safety management and recall capabilities if necessary.

How Infrastructure Managers Could Capture Value?

  • Winter Maintenance Optimization: Invest in modern spreading equipment with calibration and GPS guidance enabling precise salt application rates, adopt anti-icing and pre-wetting strategies reducing material consumption while maintaining road safety, and implement weather monitoring and decision support systems optimizing treatment timing and methods.
  • Water Utility Efficiency: Optimize water softening system design and operation balancing treatment effectiveness with salt consumption and brine discharge volumes, evaluate alternative technologies for specific applications where environmental considerations warrant, and implement monitoring systems tracking performance and identifying improvement opportunities.
  • Procurement Strategy: Establish strategic supplier relationships ensuring reliable material availability at competitive pricing, maintain adequate storage capacity addressing seasonal demand patterns and supply chain disruptions, and implement quality assurance programs validating incoming material specifications supporting operational requirements.
  • Environmental Compliance: Monitor receiving water quality in watersheds affected by deicing operations, implement best practices minimizing environmental impacts while maintaining public safety objectives, and participate in research initiatives developing improved materials and application methods addressing ecofriendly concerns.

How Investors and Financial Enablers Could Unlock Value?

  • Production Asset Investment: Finance expansion of solar evaporation facilities in favorable coastal locations, support solution mining technology deployment accessing high-quality salt formations, and enable vacuum refining capacity development serving pharmaceutical and specialty markets commanding premium pricing.
  • Infrastructure Development: Provide capital for logistics infrastructure including rail terminals, storage facilities, and bulk handling equipment optimizing distribution efficiency, finance transportation equipment including trucks and railcars supporting reliable delivery capabilities, and support strategic inventory facilities positioned near major consumption centers.
  • Technology & Innovation: Back companies developing efficient production technologies reducing energy consumption and environmental impacts, support research on alternative deicing materials and application methods addressing environmental concerns, and finance analytics platforms optimizing supply chain management and demand forecasting improving operational efficiency.
  • Market Consolidation: Support strategic acquisitions creating integrated producers with diversified geographic presence and product portfolios, finance vertical integration initiatives connecting production assets with end-user applications, and enable consolidation creating comprehensive salt suppliers serving multiple applications and customer segments with reliable supply and technical service capabilities.

Key Players in the Sodium Chloride Market

  • Cargill Incorporated
  • Compass Minerals International
  • K+S Aktiengesellschaft
  • Tata Chemicals Ltd.
  • INEOS (INOVYN) ChlorVinyls
  • Dampier Salt Ltd. (Rio Tinto)
  • Salins Group
  • Südwestdeutsche Salzwerke AG
  • Nouryon
  • Dominion Salt Ltd.

Scope of the Report

Item Value
Quantitative Units USD 47.9 billion
End Use Chemicals (Chlor-alkali, Soda ash, Other chemical derivatives), Food & Beverages, Water Treatment, Deicing, Industrial (non-chemical), Oil & Gas, Pharmaceuticals, Agriculture
Product Form Solid (Rock salt, Solar-evaporated, Pellets/tablets), Liquid brine, High-purity refined/vacuum salt
Source Sea water & brine (Solar evaporation, Solution-mined brine), Solid (rock/halite mining), Other (desalination by-product)
Regions Covered Asia Pacific, Europe, North America, Latin America, Middle East & Africa
Country Covered India, China, the USA, Brazil, Canada, Mexico, Germany, and 40+ countries
Key Companies Profiled Cargill, Compass Minerals International, K+S Aktiengesellschaft, Tata Chemicals, INEOS, Dampier Salt, Salins Group, Südwestdeutsche Salzwerke, Nouryon, Dominion Salt
Additional Attributes Dollar sales by end use, product form, and source categories, regional adoption trends across Asia Pacific, Europe, and North America, competitive landscape with salt producers and logistics integrators, production facility requirements and specifications, integration with chemical manufacturing and infrastructure applications, innovations in refining technology and green production systems, and development of specialized grades with enhanced purity and environmental compliance capabilities.

Sodium Chloride Market by Segments

End Use:

  • Chemicals
    • Chlor-alkali (chlorine/caustic)
    • Soda ash
    • Other chemical derivatives
  • Food & Beverages
  • Water Treatment
  • Deicing
  • Industrial (non-chemical)
  • Oil & Gas
  • Pharmaceuticals
  • Agriculture

Product Form:

  • Solid
    • Rock salt
    • Solar-evaporated
    • Pellets/tablets
  • Liquid brine
  • High-purity refined/vacuum salt

Source:

  • Sea water & brine
    • Solar evaporation
    • Solution-mined brine
  • Solid (rock/halite mining)
  • Other (desalination by-product)

Region:

  • Asia Pacific
    • India
    • China
    • Japan
    • South Korea
    • Australia & New Zealand
    • ASEAN
    • Rest of Asia Pacific
  • Europe
    • Germany
    • United Kingdom
    • France
    • Italy
    • Spain
    • Netherlands
    • Poland
    • Nordic
    • Rest of Eastern Europe
  • North America
    • United States
    • Canada
    • Mexico
  • Latin America
    • Brazil
    • Rest of Latin America
  • Middle East & Africa
    • Kingdom of Saudi Arabia
    • Other GCC Countries
    • Turkey
    • South Africa
    • Rest of Middle East & Africa

Frequently Asked Questions

How big is the sodium chloride market in 2025?

The global sodium chloride market is estimated to be valued at USD 47.9 billion in 2025.

What will be the size of sodium chloride market in 2035?

The market size for the sodium chloride market is projected to reach USD 70.9 billion by 2035.

How much will be the sodium chloride market growth between 2025 and 2035?

The sodium chloride market is expected to grow at a 4.0% CAGR between 2025 and 2035.

What are the key product types in the sodium chloride market?

The key product types in sodium chloride market are chemicals, food & beverages, water treatment, deicing, industrial (non-chemical), oil & gas, pharmaceuticals and agriculture.

Which product form segment to contribute significant share in the sodium chloride market in 2025?

In terms of product form, solid segment to command 42.0% share in the sodium chloride market in 2025.

Table of Content

  1. Executive Summary
    • Global Market Outlook
    • Demand to side Trends
    • Supply to side Trends
    • Technology Roadmap Analysis
    • Analysis and Recommendations
  2. Market Overview
    • Market Coverage / Taxonomy
    • Market Definition / Scope / Limitations
  3. Market Background
    • Market Dynamics
      • Drivers
      • Restraints
      • Opportunity
      • Trends
    • Scenario Forecast
      • Demand in Optimistic Scenario
      • Demand in Likely Scenario
      • Demand in Conservative Scenario
    • Opportunity Map Analysis
    • Product Life Cycle Analysis
    • Supply Chain Analysis
    • Investment Feasibility Matrix
    • Value Chain Analysis
    • PESTLE and Porter’s Analysis
    • Regulatory Landscape
    • Regional Parent Market Outlook
    • Production and Consumption Statistics
    • Import and Export Statistics
  4. Global Market Analysis 2020 to 2024 and Forecast, 2025 to 2035
    • Historical Market Size Value (USD Million) Analysis, 2020 to 2024
    • Current and Future Market Size Value (USD Million) Projections, 2025 to 2035
      • Y to o to Y Growth Trend Analysis
      • Absolute $ Opportunity Analysis
  5. Global Market Pricing Analysis 2020 to 2024 and Forecast 2025 to 2035
  6. Global Market Analysis 2020 to 2024 and Forecast 2025 to 2035, By End Use
    • Introduction / Key Findings
    • Historical Market Size Value (USD Million) Analysis By End Use , 2020 to 2024
    • Current and Future Market Size Value (USD Million) Analysis and Forecast By End Use , 2025 to 2035
      • Chemicals
      • Food & Beverages
      • Water Treatment
      • Deicing
      • Industrial (non-chemical)
      • Oil & Gas
      • Pharmaceuticals
      • Agriculture
    • Y to o to Y Growth Trend Analysis By End Use , 2020 to 2024
    • Absolute $ Opportunity Analysis By End Use , 2025 to 2035
  7. Global Market Analysis 2020 to 2024 and Forecast 2025 to 2035, By Product Form
    • Introduction / Key Findings
    • Historical Market Size Value (USD Million) Analysis By Product Form, 2020 to 2024
    • Current and Future Market Size Value (USD Million) Analysis and Forecast By Product Form, 2025 to 2035
      • Solid
      • Liquid brine
      • High-purity refined/vacuum salt
    • Y to o to Y Growth Trend Analysis By Product Form, 2020 to 2024
    • Absolute $ Opportunity Analysis By Product Form, 2025 to 2035
  8. Global Market Analysis 2020 to 2024 and Forecast 2025 to 2035, By Region
    • Introduction
    • Historical Market Size Value (USD Million) Analysis By Region, 2020 to 2024
    • Current Market Size Value (USD Million) Analysis and Forecast By Region, 2025 to 2035
      • North America
      • Latin America
      • Western Europe
      • Eastern Europe
      • East Asia
      • South Asia and Pacific
      • Middle East & Africa
    • Market Attractiveness Analysis By Region
  9. North America Market Analysis 2020 to 2024 and Forecast 2025 to 2035, By Country
    • Historical Market Size Value (USD Million) Trend Analysis By Market Taxonomy, 2020 to 2024
    • Market Size Value (USD Million) Forecast By Market Taxonomy, 2025 to 2035
      • By Country
        • USA
        • Canada
        • Mexico
      • By End Use
      • By Product Form
    • Market Attractiveness Analysis
      • By Country
      • By End Use
      • By Product Form
    • Key Takeaways
  10. Latin America Market Analysis 2020 to 2024 and Forecast 2025 to 2035, By Country
    • Historical Market Size Value (USD Million) Trend Analysis By Market Taxonomy, 2020 to 2024
    • Market Size Value (USD Million) Forecast By Market Taxonomy, 2025 to 2035
      • By Country
        • Brazil
        • Chile
        • Rest of Latin America
      • By End Use
      • By Product Form
    • Market Attractiveness Analysis
      • By Country
      • By End Use
      • By Product Form
    • Key Takeaways
  11. Western Europe Market Analysis 2020 to 2024 and Forecast 2025 to 2035, By Country
    • Historical Market Size Value (USD Million) Trend Analysis By Market Taxonomy, 2020 to 2024
    • Market Size Value (USD Million) Forecast By Market Taxonomy, 2025 to 2035
      • By Country
        • Germany
        • UK
        • Italy
        • Spain
        • France
        • Nordic
        • BENELUX
        • Rest of Western Europe
      • By End Use
      • By Product Form
    • Market Attractiveness Analysis
      • By Country
      • By End Use
      • By Product Form
    • Key Takeaways
  12. Eastern Europe Market Analysis 2020 to 2024 and Forecast 2025 to 2035, By Country
    • Historical Market Size Value (USD Million) Trend Analysis By Market Taxonomy, 2020 to 2024
    • Market Size Value (USD Million) Forecast By Market Taxonomy, 2025 to 2035
      • By Country
        • Russia
        • Poland
        • Hungary
        • Balkan & Baltic
        • Rest of Eastern Europe
      • By End Use
      • By Product Form
    • Market Attractiveness Analysis
      • By Country
      • By End Use
      • By Product Form
    • Key Takeaways
  13. East Asia Market Analysis 2020 to 2024 and Forecast 2025 to 2035, By Country
    • Historical Market Size Value (USD Million) Trend Analysis By Market Taxonomy, 2020 to 2024
    • Market Size Value (USD Million) Forecast By Market Taxonomy, 2025 to 2035
      • By Country
        • China
        • Japan
        • South Korea
      • By End Use
      • By Product Form
    • Market Attractiveness Analysis
      • By Country
      • By End Use
      • By Product Form
    • Key Takeaways
  14. South Asia and Pacific Market Analysis 2020 to 2024 and Forecast 2025 to 2035, By Country
    • Historical Market Size Value (USD Million) Trend Analysis By Market Taxonomy, 2020 to 2024
    • Market Size Value (USD Million) Forecast By Market Taxonomy, 2025 to 2035
      • By Country
        • India
        • ASEAN
        • Australia & New Zealand
        • Rest of South Asia and Pacific
      • By End Use
      • By Product Form
    • Market Attractiveness Analysis
      • By Country
      • By End Use
      • By Product Form
    • Key Takeaways
  15. Middle East & Africa Market Analysis 2020 to 2024 and Forecast 2025 to 2035, By Country
    • Historical Market Size Value (USD Million) Trend Analysis By Market Taxonomy, 2020 to 2024
    • Market Size Value (USD Million) Forecast By Market Taxonomy, 2025 to 2035
      • By Country
        • Kingdom of Saudi Arabia
        • Other GCC Countries
        • Turkiye
        • South Africa
        • Other African Union
        • Rest of Middle East & Africa
      • By End Use
      • By Product Form
    • Market Attractiveness Analysis
      • By Country
      • By End Use
      • By Product Form
    • Key Takeaways
  16. Key Countries Market Analysis
    • USA
      • Pricing Analysis
      • Market Share Analysis, 2024
        • By End Use
        • By Product Form
    • Canada
      • Pricing Analysis
      • Market Share Analysis, 2024
        • By End Use
        • By Product Form
    • Mexico
      • Pricing Analysis
      • Market Share Analysis, 2024
        • By End Use
        • By Product Form
    • Brazil
      • Pricing Analysis
      • Market Share Analysis, 2024
        • By End Use
        • By Product Form
    • Chile
      • Pricing Analysis
      • Market Share Analysis, 2024
        • By End Use
        • By Product Form
    • Germany
      • Pricing Analysis
      • Market Share Analysis, 2024
        • By End Use
        • By Product Form
    • UK
      • Pricing Analysis
      • Market Share Analysis, 2024
        • By End Use
        • By Product Form
    • Italy
      • Pricing Analysis
      • Market Share Analysis, 2024
        • By End Use
        • By Product Form
    • Spain
      • Pricing Analysis
      • Market Share Analysis, 2024
        • By End Use
        • By Product Form
    • France
      • Pricing Analysis
      • Market Share Analysis, 2024
        • By End Use
        • By Product Form
    • India
      • Pricing Analysis
      • Market Share Analysis, 2024
        • By End Use
        • By Product Form
    • ASEAN
      • Pricing Analysis
      • Market Share Analysis, 2024
        • By End Use
        • By Product Form
    • Australia & New Zealand
      • Pricing Analysis
      • Market Share Analysis, 2024
        • By End Use
        • By Product Form
    • China
      • Pricing Analysis
      • Market Share Analysis, 2024
        • By End Use
        • By Product Form
    • Japan
      • Pricing Analysis
      • Market Share Analysis, 2024
        • By End Use
        • By Product Form
    • South Korea
      • Pricing Analysis
      • Market Share Analysis, 2024
        • By End Use
        • By Product Form
    • Russia
      • Pricing Analysis
      • Market Share Analysis, 2024
        • By End Use
        • By Product Form
    • Poland
      • Pricing Analysis
      • Market Share Analysis, 2024
        • By End Use
        • By Product Form
    • Hungary
      • Pricing Analysis
      • Market Share Analysis, 2024
        • By End Use
        • By Product Form
    • Kingdom of Saudi Arabia
      • Pricing Analysis
      • Market Share Analysis, 2024
        • By End Use
        • By Product Form
    • Turkiye
      • Pricing Analysis
      • Market Share Analysis, 2024
        • By End Use
        • By Product Form
    • South Africa
      • Pricing Analysis
      • Market Share Analysis, 2024
        • By End Use
        • By Product Form
  17. Market Structure Analysis
    • Competition Dashboard
    • Competition Benchmarking
    • Market Share Analysis of Top Players
      • By Regional
      • By End Use
      • By Product Form
  18. Competition Analysis
    • Competition Deep Dive
      • Cargill Incorporated
        • Overview
        • Product Portfolio
        • Profitability by Market Segments (Product/Age /Sales Channel/Region)
        • Sales Footprint
        • Strategy Overview
          • Marketing Strategy
          • Product Strategy
          • Channel Strategy
      • Compass Minerals International
      • K+S Aktiengesellschaft
      • Tata Chemicals Ltd.
      • INEOS (INOVYN) ChlorVinyls
      • Dampier Salt Ltd. (Rio Tinto)
      • Salins Group
      • Südwestdeutsche Salzwerke AG
      • Nouryon
      • Dominion Salt Ltd.
  19. Assumptions & Acronyms Used
  20. Research Methodology

List of Tables

  • Table 1: Global Market Value (USD Million) Forecast by Region, 2020 to 2035
  • Table 2: Global Market Value (USD Million) Forecast by End Use , 2020 to 2035
  • Table 3: Global Market Value (USD Million) Forecast by Product Form, 2020 to 2035
  • Table 4: North America Market Value (USD Million) Forecast by Country, 2020 to 2035
  • Table 5: North America Market Value (USD Million) Forecast by End Use , 2020 to 2035
  • Table 6: North America Market Value (USD Million) Forecast by Product Form, 2020 to 2035
  • Table 7: Latin America Market Value (USD Million) Forecast by Country, 2020 to 2035
  • Table 8: Latin America Market Value (USD Million) Forecast by End Use , 2020 to 2035
  • Table 9: Latin America Market Value (USD Million) Forecast by Product Form, 2020 to 2035
  • Table 10: Western Europe Market Value (USD Million) Forecast by Country, 2020 to 2035
  • Table 11: Western Europe Market Value (USD Million) Forecast by End Use , 2020 to 2035
  • Table 12: Western Europe Market Value (USD Million) Forecast by Product Form, 2020 to 2035
  • Table 13: Eastern Europe Market Value (USD Million) Forecast by Country, 2020 to 2035
  • Table 14: Eastern Europe Market Value (USD Million) Forecast by End Use , 2020 to 2035
  • Table 15: Eastern Europe Market Value (USD Million) Forecast by Product Form, 2020 to 2035
  • Table 16: East Asia Market Value (USD Million) Forecast by Country, 2020 to 2035
  • Table 17: East Asia Market Value (USD Million) Forecast by End Use , 2020 to 2035
  • Table 18: East Asia Market Value (USD Million) Forecast by Product Form, 2020 to 2035
  • Table 19: South Asia and Pacific Market Value (USD Million) Forecast by Country, 2020 to 2035
  • Table 20: South Asia and Pacific Market Value (USD Million) Forecast by End Use , 2020 to 2035
  • Table 21: South Asia and Pacific Market Value (USD Million) Forecast by Product Form, 2020 to 2035
  • Table 22: Middle East & Africa Market Value (USD Million) Forecast by Country, 2020 to 2035
  • Table 23: Middle East & Africa Market Value (USD Million) Forecast by End Use , 2020 to 2035
  • Table 24: Middle East & Africa Market Value (USD Million) Forecast by Product Form, 2020 to 2035

List of Figures

  • Figure 1: Global Market Pricing Analysis
  • Figure 2: Global Market Value (USD Million) Forecast 2020-2035
  • Figure 3: Global Market Value Share and BPS Analysis by End Use , 2025 and 2035
  • Figure 4: Global Market Y to o to Y Growth Comparison by End Use , 2025-2035
  • Figure 5: Global Market Attractiveness Analysis by End Use
  • Figure 6: Global Market Value Share and BPS Analysis by Product Form, 2025 and 2035
  • Figure 7: Global Market Y to o to Y Growth Comparison by Product Form, 2025-2035
  • Figure 8: Global Market Attractiveness Analysis by Product Form
  • Figure 9: Global Market Value (USD Million) Share and BPS Analysis by Region, 2025 and 2035
  • Figure 10: Global Market Y to o to Y Growth Comparison by Region, 2025-2035
  • Figure 11: Global Market Attractiveness Analysis by Region
  • Figure 12: North America Market Incremental Dollar Opportunity, 2025-2035
  • Figure 13: Latin America Market Incremental Dollar Opportunity, 2025-2035
  • Figure 14: Western Europe Market Incremental Dollar Opportunity, 2025-2035
  • Figure 15: Eastern Europe Market Incremental Dollar Opportunity, 2025-2035
  • Figure 16: East Asia Market Incremental Dollar Opportunity, 2025-2035
  • Figure 17: South Asia and Pacific Market Incremental Dollar Opportunity, 2025-2035
  • Figure 18: Middle East & Africa Market Incremental Dollar Opportunity, 2025-2035
  • Figure 19: North America Market Value Share and BPS Analysis by Country, 2025 and 2035
  • Figure 20: North America Market Value Share and BPS Analysis by End Use , 2025 and 2035
  • Figure 21: North America Market Y to o to Y Growth Comparison by End Use , 2025-2035
  • Figure 22: North America Market Attractiveness Analysis by End Use
  • Figure 23: North America Market Value Share and BPS Analysis by Product Form, 2025 and 2035
  • Figure 24: North America Market Y to o to Y Growth Comparison by Product Form, 2025-2035
  • Figure 25: North America Market Attractiveness Analysis by Product Form
  • Figure 26: Latin America Market Value Share and BPS Analysis by Country, 2025 and 2035
  • Figure 27: Latin America Market Value Share and BPS Analysis by End Use , 2025 and 2035
  • Figure 28: Latin America Market Y to o to Y Growth Comparison by End Use , 2025-2035
  • Figure 29: Latin America Market Attractiveness Analysis by End Use
  • Figure 30: Latin America Market Value Share and BPS Analysis by Product Form, 2025 and 2035
  • Figure 31: Latin America Market Y to o to Y Growth Comparison by Product Form, 2025-2035
  • Figure 32: Latin America Market Attractiveness Analysis by Product Form
  • Figure 33: Western Europe Market Value Share and BPS Analysis by Country, 2025 and 2035
  • Figure 34: Western Europe Market Value Share and BPS Analysis by End Use , 2025 and 2035
  • Figure 35: Western Europe Market Y to o to Y Growth Comparison by End Use , 2025-2035
  • Figure 36: Western Europe Market Attractiveness Analysis by End Use
  • Figure 37: Western Europe Market Value Share and BPS Analysis by Product Form, 2025 and 2035
  • Figure 38: Western Europe Market Y to o to Y Growth Comparison by Product Form, 2025-2035
  • Figure 39: Western Europe Market Attractiveness Analysis by Product Form
  • Figure 40: Eastern Europe Market Value Share and BPS Analysis by Country, 2025 and 2035
  • Figure 41: Eastern Europe Market Value Share and BPS Analysis by End Use , 2025 and 2035
  • Figure 42: Eastern Europe Market Y to o to Y Growth Comparison by End Use , 2025-2035
  • Figure 43: Eastern Europe Market Attractiveness Analysis by End Use
  • Figure 44: Eastern Europe Market Value Share and BPS Analysis by Product Form, 2025 and 2035
  • Figure 45: Eastern Europe Market Y to o to Y Growth Comparison by Product Form, 2025-2035
  • Figure 46: Eastern Europe Market Attractiveness Analysis by Product Form
  • Figure 47: East Asia Market Value Share and BPS Analysis by Country, 2025 and 2035
  • Figure 48: East Asia Market Value Share and BPS Analysis by End Use , 2025 and 2035
  • Figure 49: East Asia Market Y to o to Y Growth Comparison by End Use , 2025-2035
  • Figure 50: East Asia Market Attractiveness Analysis by End Use
  • Figure 51: East Asia Market Value Share and BPS Analysis by Product Form, 2025 and 2035
  • Figure 52: East Asia Market Y to o to Y Growth Comparison by Product Form, 2025-2035
  • Figure 53: East Asia Market Attractiveness Analysis by Product Form
  • Figure 54: South Asia and Pacific Market Value Share and BPS Analysis by Country, 2025 and 2035
  • Figure 55: South Asia and Pacific Market Value Share and BPS Analysis by End Use , 2025 and 2035
  • Figure 56: South Asia and Pacific Market Y to o to Y Growth Comparison by End Use , 2025-2035
  • Figure 57: South Asia and Pacific Market Attractiveness Analysis by End Use
  • Figure 58: South Asia and Pacific Market Value Share and BPS Analysis by Product Form, 2025 and 2035
  • Figure 59: South Asia and Pacific Market Y to o to Y Growth Comparison by Product Form, 2025-2035
  • Figure 60: South Asia and Pacific Market Attractiveness Analysis by Product Form
  • Figure 61: Middle East & Africa Market Value Share and BPS Analysis by Country, 2025 and 2035
  • Figure 62: Middle East & Africa Market Value Share and BPS Analysis by End Use , 2025 and 2035
  • Figure 63: Middle East & Africa Market Y to o to Y Growth Comparison by End Use , 2025-2035
  • Figure 64: Middle East & Africa Market Attractiveness Analysis by End Use
  • Figure 65: Middle East & Africa Market Value Share and BPS Analysis by Product Form, 2025 and 2035
  • Figure 66: Middle East & Africa Market Y to o to Y Growth Comparison by Product Form, 2025-2035
  • Figure 67: Middle East & Africa Market Attractiveness Analysis by Product Form
  • Figure 68: Global Market - Tier Structure Analysis
  • Figure 69: Global Market - Company Share Analysis
Dashboard
Dashboard
Dashboard
Dashboard
Dashboard
Dashboard

Full Research Suite comprises of:

Market outlook & trends analysis

Market outlook & trends analysis

Interviews & case studies

Interviews & case studies

Strategic recommendations

Strategic recommendations

Vendor profiles & capabilities analysis

Vendor profiles & capabilities analysis

5-year forecasts

5-year forecasts

8 regions and 60+ country-level data splits

8 regions and 60+ country-level data splits

Market segment data splits

Market segment data splits

12 months of continuous data updates

12 months of continuous data updates

DELIVERED AS:

PDF EXCEL ONLINE

Full Research Suite


$5000

$7500

$10000

Buy Report Now
Similar Industry Reports

Similar Industry Reports

Demand for Sodium Chloride in EU

Demand for Sodium Chloride in EU Size and Share Forecast Outlook 2025 to 2035

Industrial Sodium Chloride Market

Industrial Sodium Chloride Market Size & Trends 2025 to 2035

Pharmaceutical Grade Sodium Chloride Market

Pharmaceutical Grade Sodium Chloride Market Size and Share Forecast Outlook 2025 to 2035

Sodium Difluorophosphate (NaDFP) Market

Sodium Difluorophosphate (NaDFP) Market Size and Share Forecast Outlook 2025 to 2035

Sodium Bisulfite Market

Sodium Bisulfite Market Size and Share Forecast Outlook 2025 to 2035

Sodium Formate Market

Sodium Formate Market Size and Share Forecast Outlook 2025 to 2035

Sodium Borohydride Market

Sodium Borohydride Market Size and Share Forecast Outlook 2025 to 2035

Sodium Lactate Market

Sodium Lactate Market Size and Share Forecast Outlook 2025 to 2035

Sodium Caprylate Market

Sodium Caprylate Market Size and Share Forecast Outlook 2025 to 2035

Sodium Caseinate Market

Sodium Caseinate Market Size and Share Forecast Outlook 2025 to 2035

Sodium Iodide Market

Sodium Iodide Market Size and Share Forecast Outlook 2025 to 2035

Sodium Lauryl Sulphate Market

Sodium Lauryl Sulphate Market Size and Share Forecast Outlook 2025 to 2035

Sodium Cumenesulfonate Market

Sodium Cumenesulfonate Market Size and Share Forecast Outlook 2025 to 2035

Sodium Stearoyl Lactate Market

Sodium Stearoyl Lactate Market Size and Share Forecast Outlook 2025 to 2035

Sodium Hydrosulfite Market

Sodium Hydrosulfite Market Size and Share Forecast Outlook 2025 to 2035

Sodium Sulphate Market

Sodium Sulphate Market Size and Share Forecast Outlook 2025 to 2035

Sodium-Ion Batteries Market

Sodium-Ion Batteries Market Analysis - Size, Share, and Forecast Outlook 2025 to 2035

Sodium Hyaluronate Crosslinked Market

Sodium Hyaluronate Crosslinked Market Size and Share Forecast Outlook 2025 to 2035

Sodium Sulfur Batteries Market

Sodium Sulfur Batteries Market Size and Share Forecast Outlook 2025 to 2035

Sodium Malate Market

Sodium Malate Market Size and Share Forecast Outlook 2025 to 2035

Future Market Insights

Sodium Chloride Market

Chat With MaRIA

Chat With

MaRIA

Hi There, I am MaRIA, Your Market Research Intelligence Assistant. How may I help you?