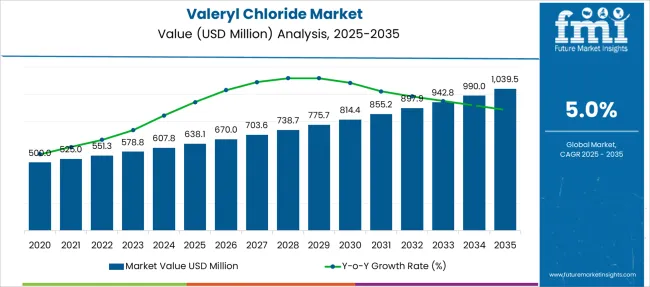
The Valeryl Chloride Market is estimated to be valued at USD 638.1 million in 2025 and is projected to reach USD 1039.5 million by 2035, registering a compound annual growth rate (CAGR) of 5.0% over the forecast period.
| Metric | Value |
|---|---|
| Valeryl Chloride Market Estimated Value in (2025 E) | USD 638.1 million |
| Valeryl Chloride Market Forecast Value in (2035 F) | USD 1039.5 million |
| Forecast CAGR (2025 to 2035) | 5.0% |
The valeryl chloride market is gaining traction globally due to its critical role as an acylating agent in pharmaceutical synthesis, agrochemical manufacturing, and specialty chemical formulation. The compound’s reactivity and compatibility with complex organic structures have made it a preferred intermediate in the production of esters, amides, and other high-value chemical derivatives. With regulatory standards tightening around active pharmaceutical ingredients and high-purity chemicals, the demand for precisely manufactured valeryl chloride has intensified.
Emerging economies are increasingly focusing on domestic pharmaceutical production, creating a favorable landscape for local supply chains involving valeryl chloride. Additionally, manufacturers are adopting advanced purification technologies to meet stringent purity requirements, further boosting market competitiveness.
Strategic collaborations between chemical producers and end-use industries are enabling vertical integration and supply assurance In the coming years, the market is expected to witness accelerated adoption across regulated pharmaceutical zones and expanding generic drug manufacturing hubs, with innovation in synthetic chemistry continuing to drive new application avenues.
The market is segmented by Application and Purity and region. By Application, the market is divided into Pharmaceuticals, Agrochemicals, Fragrances, and Electronics. In terms of Purity, the market is classified into 0.98, 0.99, and Other Purities. Regionally, the market is classified into North America, Latin America, Western Europe, Eastern Europe, Balkan & Baltic Countries, Russia & Belarus, Central Asia, East Asia, South Asia & Pacific, and the Middle East & Africa.
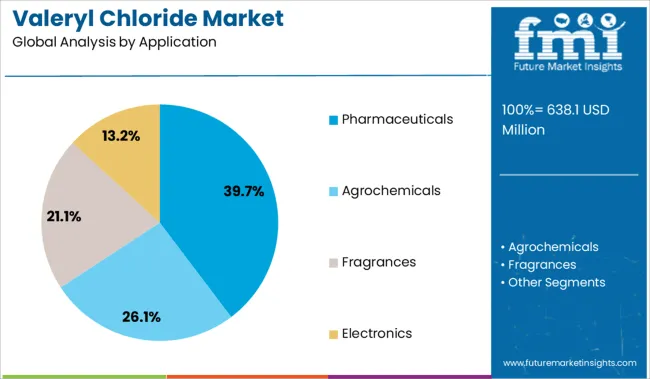
The pharmaceuticals segment is projected to account for 39.7% of the overall revenue share in the valeryl chloride market in 2025. This dominant share is being driven by the compound’s extensive use in synthesizing drug intermediates and active pharmaceutical ingredients that require precise acylation processes. The segment’s growth is being supported by rising investments in generic drug production and the expansion of contract manufacturing organizations in emerging and developed markets.
Valeryl chloride’s high reactivity and compatibility with various organic bases have made it indispensable in producing pharmaceutical-grade compounds. Regulatory emphasis on product purity and traceability has further encouraged the use of this chemical in controlled manufacturing environments.
The ability to tailor reactions with valeryl chloride to achieve targeted chemical profiles has also contributed to its increased adoption in medicinal chemistry As healthcare systems emphasize affordable and scalable drug production, this segment is expected to continue its strong performance in the global market.
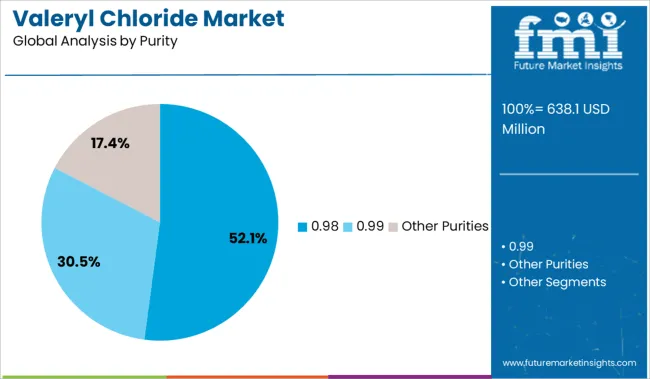
The 98% purity segment is anticipated to hold 52.1% of the revenue share in the valeryl chloride market in 2025, reflecting its importance in applications that require high chemical consistency and minimal impurities. This purity level has become a standard in pharmaceutical and fine chemical industries where regulatory compliance and batch-to-batch reproducibility are essential. The demand for 98% pure valeryl chloride is being reinforced by the rising need for high-efficiency reactions and predictable output in complex synthesis processes.
Manufacturers have responded by adopting advanced distillation and purification methods to consistently meet this quality benchmark. The segment’s growth has also been supported by the need to reduce downstream purification steps, thereby improving overall production efficiency.
Industries involved in the manufacture of specialty esters, agrochemicals, and laboratory reagents are increasingly specifying 98% purity grades to maintain stringent quality controls This trend is expected to persist as global quality standards become more aligned with pharmaceutical-grade chemical requirements.
Most of the demand for valeryl chloride is as a raw material for the production of various surfactants and fragrances. Its varied chemical and physical properties are useful for many manufacturing processes resulting in higher sales of valeryl chloride in industrial units.
It also finds its application in electronics for semiconductors and liquid crystal displays that have boosted the sales of valeryl chloride in the electronics segment in recent years. However, in the last couple of years, the pharmaceutical and agrochemicals sectors have extensively driven worldwide sales of valeryl chloride.
The aging population and advancements in healthcare have led to an increase in demand for better pharmaceutical products. Consequently, increasing general awareness amongst the general population has increased the use of medicine for better physical and mental health, which is expected to drive the demand for valeryl chloride at a steady rate over the forecast period.
The increasing population has also increased the demand for better agrochemicals for faster and quality production. Advancements in agrochemical sectors are estimated to increase demand for valeryl chloride in the coming days. Agriculture-based economies are anticipated to remain at the forefront in sales of valeryl chloride.
Stringent government regulations for the protection of laborers working in the industries contributing to the growth of the valeryl chloride market share are anticipated to hinder the growth.
Apprehensions about the safety of this chemical present in end products are also a major challenge for higher sales of valeryl chloride in several parts.
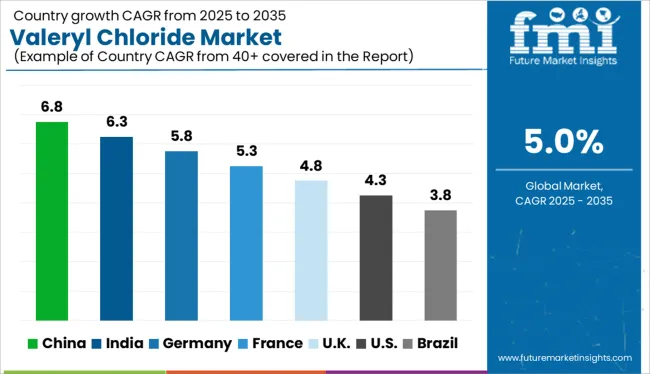
North America and Europe have established a dominant presence in the pharmaceutical market. The USA is a key player in the pharmaceutical market because of the higher attractiveness of the pharmaceutical industry for a wide range of customers with low levels of price regulations.
It has always been a very positive market for pharmaceutical products, which will drive the sales of valeryl chloride in the regional market over the forecast period. North America and Europe will witness steady growth in the demand for valeryl chloride over the forecast period.
In the Asia-Pacific region, countries such as China and India have observed steady growth in the pharmaceutical and agrochemical industries, which will propel the demand for valeryl chloride over the coming years. Government initiatives for better medical and health care have also pushed the sales of valeryl chloride in the local markets positively.
As agrochemicals extensively drive the sales of valeryl chloride, Asia-Pacific holds a dominant share in this sector with increasing agricultural activities, leading to the manufacturing of pesticides and crop-protecting agents, among others. Positive agricultural activities in Latin American countries such as Brazil and Colombia will also witness steady demand for valeryl chloride.
Investments of multiple pharmaceutical companies in Middle-Eastern companies and Africa holds the region as a potential market for higher sales of valeryl chloride, though it may stay stagnant for some more years.
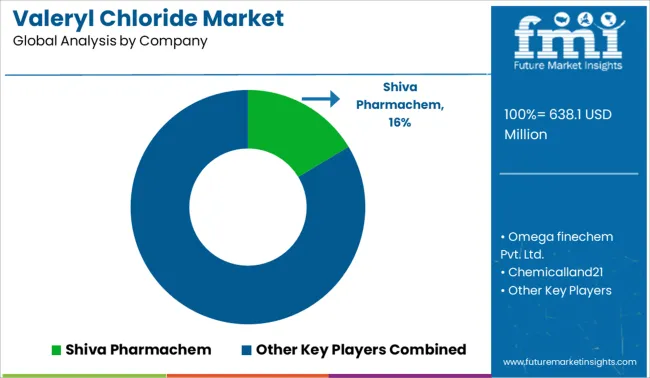
Some of the leading companies operating in the global valeryl chloride market are Shiva Pharmachem, Omega fine chem Pvt. Ltd., Zibo Shanqiang Plastic Co., Ltd., Chemicalland21, Tejraj Bros, Dev Enterprise, BASF SE, CABB Chemicals, Hangzhou Fanda Chemical, Jiangsu Baichang Pharmaceutical, Leonid Chemicals, Shandong Jiahong Chemical, Jinnan Fufang Chemical, and Lianfeng Chemicals among others.
| Report Attribute | Details |
|---|---|
| Growth Rate | CAGR of 5% from 2025 to 2035 |
| Base Year for Estimation | 2024 |
| Historical Data | 2020 to 2024 |
| Forecast Period | 2025 to 2035 |
| Quantitative Units | Revenue in USD Million, Volume in Kilotons, and CAGR from 2025 to 2035 |
| Report Coverage | Revenue Forecast, Volume Forecast, Company Ranking, Competitive Landscape, Growth Factors, Trends, and Pricing Analysis |
| Segments Covered |
Purity, Application, Region |
| Regions Covered |
North America; Latin America; Western Europe; Eastern Europe; Asia Pacific Excluding Japan; Japan; Middle East and Africa |
| Key Countries Profiled | USA, Canada, Brazil, Argentina, Germany, United Kingdom, France, Spain, Italy, Nordics, BENELUX, Australia & New Zealand, China, India, ASIAN, GCC Countries, South Africa |
| Key Companies Profiled |
Shiva Pharmachem; Omega finechem Pvt. Ltd.; Zibo Shanqiang Plastic Co., Ltd.; Chemicalland21; Tejraj Bros; Dev Enterprise; BASF SE; CABB Chemicals; Hangzhou Fanda Chemical; Jiangsu Baichang Pharmaceutical; Leonid Chemicals; Shandong Jiahong Chemical; Jinnan Fufang Chemical; Lianfeng Chemicals. |
| Customization | Available Upon Request |
The global valeryl chloride market is estimated to be valued at USD 638.1 million in 2025.
The market size for the valeryl chloride market is projected to reach USD 1,039.5 million by 2035.
The valeryl chloride market is expected to grow at a 5.0% CAGR between 2025 and 2035.
The key product types in valeryl chloride market are pharmaceuticals, agrochemicals, fragrances and electronics.
In terms of purity, 0.98 segment to command 52.1% share in the valeryl chloride market in 2025.


Our Research Products

The "Full Research Suite" delivers actionable market intel, deep dives on markets or technologies, so clients act faster, cut risk, and unlock growth.

The Leaderboard benchmarks and ranks top vendors, classifying them as Established Leaders, Leading Challengers, or Disruptors & Challengers.

Locates where complements amplify value and substitutes erode it, forecasting net impact by horizon

We deliver granular, decision-grade intel: market sizing, 5-year forecasts, pricing, adoption, usage, revenue, and operational KPIs—plus competitor tracking, regulation, and value chains—across 60 countries broadly.

Spot the shifts before they hit your P&L. We track inflection points, adoption curves, pricing moves, and ecosystem plays to show where demand is heading, why it is changing, and what to do next across high-growth markets and disruptive tech

Real-time reads of user behavior. We track shifting priorities, perceptions of today’s and next-gen services, and provider experience, then pace how fast tech moves from trial to adoption, blending buyer, consumer, and channel inputs with social signals (#WhySwitch, #UX).

Partner with our analyst team to build a custom report designed around your business priorities. From analysing market trends to assessing competitors or crafting bespoke datasets, we tailor insights to your needs.
Supplier Intelligence
Discovery & Profiling
Capacity & Footprint
Performance & Risk
Compliance & Governance
Commercial Readiness
Who Supplies Whom
Scorecards & Shortlists
Playbooks & Docs
Category Intelligence
Definition & Scope
Demand & Use Cases
Cost Drivers
Market Structure
Supply Chain Map
Trade & Policy
Operating Norms
Deliverables
Buyer Intelligence
Account Basics
Spend & Scope
Procurement Model
Vendor Requirements
Terms & Policies
Entry Strategy
Pain Points & Triggers
Outputs
Pricing Analysis
Benchmarks
Trends
Should-Cost
Indexation
Landed Cost
Commercial Terms
Deliverables
Brand Analysis
Positioning & Value Prop
Share & Presence
Customer Evidence
Go-to-Market
Digital & Reputation
Compliance & Trust
KPIs & Gaps
Outputs
Full Research Suite comprises of:
Market outlook & trends analysis
Interviews & case studies
Strategic recommendations
Vendor profiles & capabilities analysis
5-year forecasts
8 regions and 60+ country-level data splits
Market segment data splits
12 months of continuous data updates
DELIVERED AS:
PDF EXCEL ONLINE
Acetyl Isovaleryl Market
Zinc Chloride Market Analysis - Size, Share, and Forecast 2025 to 2035
Acid Chlorides Market Size and Share Forecast Outlook 2025 to 2035
Allyl Chloride Market Size and Share Forecast Outlook 2025 to 2035
Barium Chloride Market Size and Share Forecast Outlook 2025 to 2035
Sodium Chloride Market Size and Share Forecast Outlook 2025 to 2035
Ferric Chloride Market Size and Share Forecast Outlook 2025 to 2035
Industry Share Analysis for Cupric Chloride Companies
Calcium Chloride Market Size and Share Forecast Outlook 2025 to 2035
Choline Chloride Market Size and Share Forecast Outlook 2025 to 2035
Thionyl Chloride Market Size and Share Forecast Outlook 2025 to 2035
Aluminum Chloride Hexahydrate Market Size and Share Forecast Outlook 2025 to 2035
Pivaloyl Chloride Market Size and Share Forecast Outlook 2025 to 2035
Ammonium Chloride Food Grade Market Growth - Demand & Trends 2025 to 2035
Cyanuric Chloride Market
Polyvinyl Chloride (PVC) Packaging Film Market Forecast and Outlook 2025 to 2035
Magnesium Chloride Market Size and Share Forecast Outlook 2025 to 2035
Copper Oxychloride Market Size and Share Forecast Outlook 2025 to 2035
Aluminium Chloride Market Analysis - Size, Share & Forecast 2025 to 2035
Potassium Chloride Market Growth - Trends & Forecast 2025 to 2035

Thank you!
You will receive an email from our Business Development Manager. Please be sure to check your SPAM/JUNK folder too.
Chat With
MaRIA