Thionyl Chloride Market Size and Share Forecast Outlook 2025 to 2035

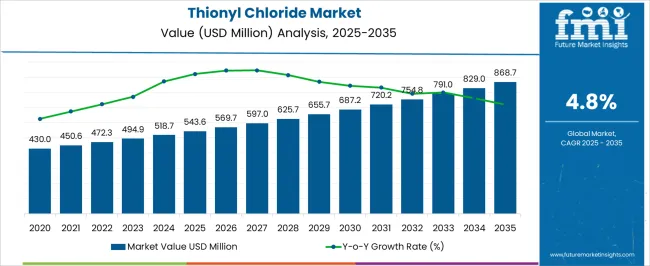
The Thionyl Chloride Market is estimated to be valued at USD 543.6 million in 2025 and is projected to reach USD 868.7 million by 2035, registering a compound annual growth rate (CAGR) of 4.8% over the forecast period.
Quick Stats for Thionyl Chloride Market

  • Thionyl Chloride Market Industry Value (2025): USD 543.6 million
  • Thionyl Chloride Market Forecast Value (2035): USD 868.7 million
  • Thionyl Chloride Market Forecast CAGR: 4.8%
  • Leading Segment in Thionyl Chloride Market in 2025: Technical Grade (68.5%)
  • Key Growth Region in Thionyl Chloride Market: North America, Asia-Pacific, Europe
  • Top Key Players in Thionyl Chloride Market: Lanxess AG, Transpek Industries Ltd., CABB Group, Sigma Aldrich Co. LLC, Shandong Kaisheng New Materials Co. Ltd., Angene International Limited, Aurora Fine Chemicals LLC, Jiangxi Selon Industrial Co. Ltd., Merck KGaA, Hangzhou Trylead Chemical Technology, Bodal Chemicals Limited

Thionyl Chloride Market Market Value Analysis

Metric Value
Thionyl Chloride Market Estimated Value in (2025 E) USD 543.6 million
Thionyl Chloride Market Forecast Value in (2035 F) USD 868.7 million
Forecast CAGR (2025 to 2035) 4.8%

Rationale for Segmental Growth in the Thionyl Chloride Market

The thionyl chloride market is progressing steadily, supported by its critical role as a chemical intermediate across diverse industrial applications. Demand growth has been reinforced by its wide usage in agrochemicals, pharmaceuticals, and dyes, where it serves as an essential chlorinating agent. Industry announcements and company reports have emphasized the expanding consumption of thionyl chloride in the synthesis of crop protection chemicals, reflecting the rising global need for food security and higher agricultural yields.

Additionally, the pharmaceutical sector has utilized thionyl chloride in active ingredient production, further strengthening its market relevance. Advances in production efficiency and investments in modernized chemical facilities have improved capacity utilization while reducing operational costs.

However, regulatory scrutiny over environmental emissions and workplace safety has driven manufacturers to adopt cleaner and more controlled production technologies. Looking forward, the market is expected to grow through increased use in specialty chemical manufacturing, the adoption of sustainable production practices, and rising demand from emerging economies with expanding agrochemical and pharmaceutical industries.
Segmental Analysis

Insights into the Grade Segment: Technical Grade

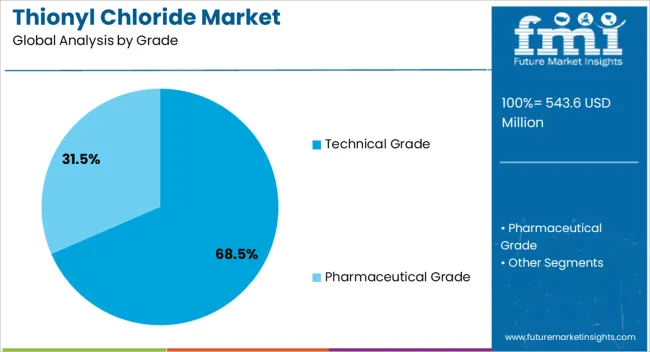
Thionyl Chloride Market Analysis By Grade

The Technical Grade segment is projected to account for 68.5% of the thionyl chloride market revenue in 2025, making it the dominant grade. This leadership has been shaped by the extensive use of technical grade thionyl chloride in large-scale industrial applications, particularly agrochemicals and dyes, where ultra-high purity is not a critical requirement.

The cost-effectiveness of technical grade products has supported their preference in bulk manufacturing, providing a balance between performance and affordability. Chemical industry disclosures have also noted that the availability of technical grade thionyl chloride in large volumes allows producers to meet high-demand cycles efficiently.

As downstream industries expand production capacity, technical grade consumption has risen due to its suitability for non-pharmaceutical applications. This segment’s position is expected to remain strong, supported by its widespread applicability and lower price point relative to higher purity grades.
Insights into the Application Segment: Agrochemicals

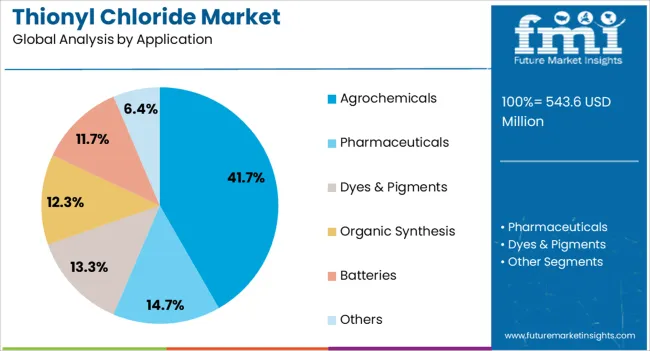
Thionyl Chloride Market Analysis By Application

The Agrochemicals segment is projected to contribute 41.7% of the thionyl chloride market revenue in 2025, reflecting its leading role among applications. Growth has been driven by the increasing use of thionyl chloride in the synthesis of herbicides, pesticides, and insecticides.

Agricultural sector reports have emphasized rising global food demand, which has intensified the need for crop protection chemicals, thereby boosting thionyl chloride consumption. Agrochemical manufacturers have relied on thionyl chloride for its effectiveness in producing intermediates with consistent yield and chemical stability.

Additionally, the segment’s growth has been reinforced by government policies supporting higher agricultural productivity and the expansion of cultivated land in emerging economies. With global agricultural input markets expanding and continuous innovation in crop protection formulations, the Agrochemicals segment is expected to sustain its leadership in thionyl chloride demand.
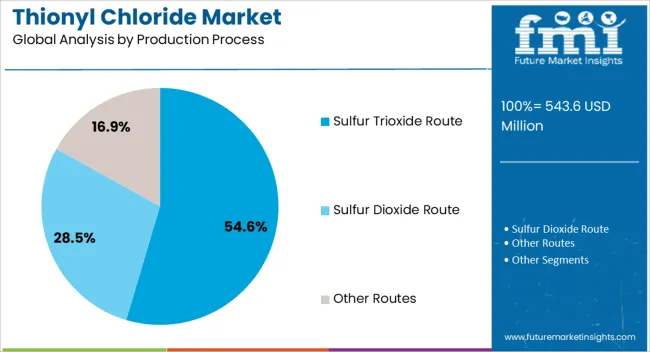
Insights into the Production Process Segment: Sulfur Trioxide Route

Thionyl Chloride Market Analysis By Production Process

The Sulfur Trioxide Route segment is projected to account for 54.6% of the thionyl chloride market revenue in 2025, establishing it as the leading production process. This dominance has been supported by the route’s cost efficiency, high yield, and scalability compared to alternative production methods.

Chemical engineering studies and industry updates have highlighted that the sulfur trioxide route allows consistent quality output while enabling manufacturers to achieve greater economies of scale. Additionally, the route has been favored due to its relative ease of integration with existing sulfur-based chemical production facilities, reducing capital investment requirements.

Environmental considerations have also prompted producers to refine this process, improving emission control and waste management practices. As global demand for thionyl chloride continues to rise, the sulfur trioxide route is expected to remain the preferred production pathway, balancing production efficiency with compliance to evolving environmental regulations.

Thionyl Chloride Market Dynamics

The thionyl chloride industry is assured significant growth opportunities due to its diverse range of applications across various manufacturing units. Thionyl compound is extensively utilized as a major intermediate in chemical synthesis, particularly in the pharmaceutical and agrochemical sectors.

The industry is poised for steady growth during the expected period, driven by its indispensable role in chemical synthesis and its wide-ranging application across diverse industries. Thionyl chloride can efficiently convert carboxylic acids into acyl chlorides, contributing to the rising demand.

The sector indicates that growing research and development activities aim to expand the compound's efficiency and create innovative applications. The increasing popularity of lithium-ion batteries has led to the adoption of thionyl chloride as a vital component in battery electrolytes, amplifying demand in the electronics industry.

The toxic nature and potential environmental hazards of thionyl chloride necessitate stringent regulatory compliance. Variations in raw material costs and geopolitical factors impacting the distribution network can affect industrial dynamics.

Asia Pacific has emerged as a substantial region due to a strong base of manufacturing units, the fastest escalating pharmaceutical sector, and growing demand for agrochemicals. The region is also experiencing increased consumption of thionyl chloride due to the burgeoning electronics sector for battery formulation.

Latest Trends in the Thionyl Chloride Market

Thionyl chloride's role in pharmaceutical synthesis is increasing due to the growth of the pharmaceutical industry and the demand for new drugs. Increased environmental awareness may push for sustainable chemical production methods. Research and development could lead to innovative chemical synthesis methods.

Changes in the global economic and geopolitical landscapes could influence thionyl chloride's production and consumption patterns. Evolving regulations regarding chemical manufacturing, handling, and environmental safety could affect the thionyl chloride market dynamics.

Category-wise Outlook

Technical-grade Thionyl Chloride's Versatility Fuels Market Growth

In the dynamic landscape of the chemical industry, technical-grade thionyl chloride emerges as a star player, poised to capture a whopping 70.4% of the industry share in 2025. Technical grade thionyl chloride is predominantly utilized in the industrial setting in various areas like chemical production, insecticides, and herbicides.

Versatility and compatibility in multiple processes make it essential for production purposes to nurture progress and expansion. The technical grade plays a main role in the chemical sectors as essential intermediates in pharmaceutical and agrochemical manufacturing, enhancing demand.

Attributes Details
Grade Technical Grade
Market Share (2025) 70.4%

Thionyl Chloride Emerged as the Essential Reagent in Pharmaceutical Formulations

In a magnificent symphony of chemical speculation, the pharmaceutical industry takes center stage, poised to claim a substantial 28.8% slice of the thionyl chloride market share in 2025. Thionyl chloride is a versatile reagent that transforms organic compounds into potent pharmaceuticals, and it plays a major role in purification processes.

Thionyl chlorides are popular as drug-crafting maestros, acting as key components in building blocks for life-saving compounds. Despite its unassuming nature, thionyl chloride plays a significant role in the pharmaceutical industry and is crucial in the continued supply for drug synthesis formulations.

Attributes Details
Applications Pharmaceuticals
Market Share (2025) 28.8%

Country-wise Analysis

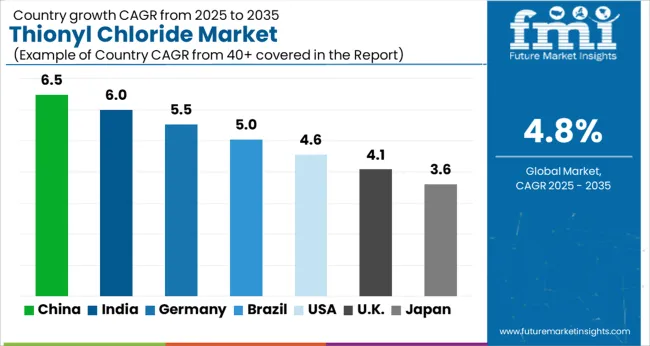
Thionyl Chloride Market Cagr Analysis By Country

The industry is witnessing a surge in demand globally. Demand for thionyl chloride varies by region, with North America and Europe being major contributors to market growth. Meanwhile, Asia Pacific and Latin America are expected to witness significant growth due to the rise in chemical manufacturing activities and the implementation of stringent environmental regulations.

Agrochemical Demand Boosts Thionyl Chloride Market Growth in the United States

Demand for thionyl chlorides is anticipated to exhibit a gradual increase in the United States, with a CAGR of 2.7% over the next decade until 2035. The pharmaceutical sector is a main driver for thionyl chloride as it is highly utilized in the drug and medicinal development process.

Agrochemical formulations rely on thionyl chloride, including pesticides and herbicides, fueling the demand for synthesis chemicals. The technological advancements are significant as manufacturers pursue efficient reagents, which surge the demand.

Multi-purpose Applications Fuel Thionyl Chloride Usage in Spain's Manufacturing Sector

The thionyl chloride industry in Spain is forecasted to experience sluggish growth, maintaining a CAGR of 3.6% until 2035. There is escalating demand for chemical applications in various industries in Spain, including construction, automotive, and the medicinal sector. This amplifies the utilization of thionyl chloride for multi-purpose applications in manufacturing units.

Key players are showing interest in the research and development zone to innovate new products and applications. The growing concern over water treatment may drive and shape the industry’s growth trajectory.
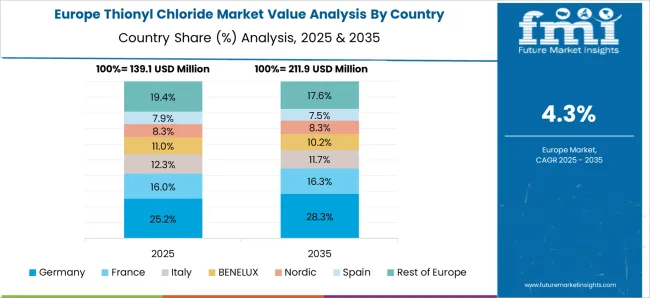
Green Chemistry Initiatives Shape France's Thionyl Chloride Industry Growth

Thionyl Chloride Market Europe Country Market Share Analysis, 2025 & 2035

The thionyl chloride market is likely to demonstrate restrained expansion in France, characterized by a 3.4% CAGR through 2035. Specialty chemicals play a major role in France's chemical sector due to their exclusive properties and tailored functionalities, increasing the demand for multiple chemical processes.

France serves green chemistry during this; the processing entities are aiming at sustainable practices, eco-friendly processes, and bio-based materials. The collaboration between academia and industry fosters commitment toward innovation. These multifaceted drivers outline the sector’s growth.

Government Initiatives Propel Significant Growth in China's Thionyl Chloride Sector

Thionyl chloride market growth in China is expected to be moderate, with a projected CAGR of 5.4% until 2035. The thionyl chloride sector in China has witnessed significant growth due to multiple industry-specific factors and governmental initiatives. Regulatory figures have intensified their focus on environmental protection.

The latest directives emphasize stricter monitoring of chemical manufacturing facilities. Industries ensure reporting transparency and accountability to local environmental protection bureaus, gaining trust in the industry and driving the growth rate.

Health Consciousness Drives Surge in Thionyl Chloride Demand Across Indian Industries

The growth rate of the thionyl chloride market in India is projected to be modest, with a CAGR of 7.2% expected through 2035. Increasing awareness of chemical synthesis indirectly influences industry dynamics by encouraging sustainable practices and demanding quality products.

As people become more health-conscious, they recognize the importance of pharmaceuticals in maintaining health and well-being. Thionyl chlorides are vital components in various industries, including the medicine industry, amplifying the surge in demand.
Competitive Landscape

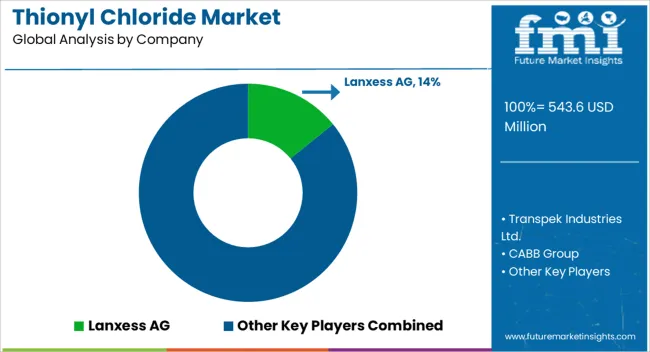
Thionyl Chloride Market Analysis By Company

The thionyl chloride sector boasts a highly consolidated community of influential players, dominating the industry. The top nine industries account for 50% of the total revenue. To maintain this position, companies are aiming to develop strategic collaborations with government entities and end users. This helps them secure long-term contracts and confirm a stable revenue stream.

The increasing demand for thionyl chloride in multiple sectors fuels growth over the expected duration. Moreover, the increasing investment in research and development projects by key players is improving the quality of products and is expected to boost industry growth.

Several prominent players

  • Solvay SA: A leading chemical company that produces thionyl chloride for various applications.
  • Transpek Industry Limited: Known for its high-quality thionyl chloride used in pharmaceuticals and other industries.
  • Shandong Kaisheng New Materials Co., Ltd.: A major player in the production of thionyl chloride.
  • Sigma Aldrich Co. LLC: A leading life science and high-tech company that offers innovative products and services to serve the research, development, and production needs of customers in the chemical, biotech, and pharmaceutical industries.
  • Shandong Kaisheng New Materials Co. Ltd.: A Chinese company that specializes in the production and sale of chemical products, including inorganic chemicals, organic chemicals, and fine chemicals.
  • Angene International Limited: A Hong Kong-based company that provides a wide range of chemical products, including pharmaceutical intermediates, APIs, and natural products, to customers in the biotech and pharmaceutical industries.
  • Aurora Fine Chemicals LLC: A United States-based company that specializes in the development and production of high-quality fine chemicals, including specialty organic intermediates and custom synthesis services, for customers in the pharmaceutical, biotech, and chemical industries.
  • Jiangxi Selon Industrial Co. Ltd.: A Chinese company that offers a range of chemical products, including fine chemicals, pharmaceutical intermediates, and specialty chemicals, to customers in the chemical, pharmaceutical, and agricultural industries.
  • Merck KGaA: A German multinational pharmaceutical, chemical, and life sciences company that develops and produces innovative products and solutions for healthcare, life sciences, and performance materials applications.

Key Companies in the Thionyl Chloride Market

  • Lanxess AG
  • Transpek Industries Ltd.
  • CABB Group
  • Sigma Aldrich Co. LLC
  • Shandong Kaisheng New Materials Co. Ltd.
  • Angene International Limited
  • Aurora Fine Chemicals LLC
  • Jiangxi Selon Industrial Co. Ltd.
  • Merck KGaA
  • Hangzhou Trylead Chemical Technology
  • Bodal Chemicals Limited.

Key Segmentation

By Grade:

The industry is divided into technical grade and pharmaceutical grade depending on grade.

By Application:

Thionyl chloride finds application across agrochemicals, pharmaceuticals, dyes & pigments, organic synthesis, batteries, and others

By Production Process:

Based on production, the industry is categorized into sulfur trioxide route, sulfur dioxide route, and other routes

By Region:

The industry analysis has been conducted across key regions including North America, Latin America, Europe, East Asia, South Asia, Middle East and Africa, as well as Oceania.

Table of Content

  1. Executive Summary
    • Global Market Outlook
    • Demand-side Trends
    • Supply-side Trends
    • Technology Roadmap Analysis
    • Analysis and Recommendations
  2. Market Overview
    • Market Coverage / Taxonomy
    • Market Definition / Scope / Limitations
  3. Market Background
    • Market Dynamics
      • Drivers
      • Restraints
      • Opportunity
      • Trends
    • Scenario Forecast
      • Demand in Optimistic Scenario
      • Demand in Likely Scenario
      • Demand in Conservative Scenario
    • Opportunity Map Analysis
    • Product Life Cycle Analysis
    • Supply Chain Analysis
    • Investment Feasibility Matrix
    • Value Chain Analysis
    • PESTLE and Porter’s Analysis
    • Regulatory Landscape
    • Regional Parent Market Outlook
    • Production and Consumption Statistics
    • Import and Export Statistics
  4. Global e Market Analysis 2020 to 2024 and Forecast, 2025 to 2035
    • Historical Market Size Value (USD Million) Analysis, 2020 to 2024
    • Current and Future Market Size Value (USD Million) Projections, 2025 to 2035
      • Y-o-Y Growth Trend Analysis
      • Absolute $ Opportunity Analysis
  5. Global e Market Pricing Analysis 2020 to 2024 and Forecast 2025 to 2035
  6. Global e Market Analysis 2020 to 2024 and Forecast 2025 to 2035, By Grade
    • Introduction / Key Findings
    • Historical Market Size Value (USD Million) Analysis By Grade , 2020 to 2024
    • Current and Future Market Size Value (USD Million) Analysis and Forecast By Grade , 2025 to 2035
      • Technical Grade
      • Pharmaceutical Grade
    • Y-o-Y Growth Trend Analysis By Grade , 2020 to 2024
    • Absolute $ Opportunity Analysis By Grade , 2025 to 2035
  7. Global e Market Analysis 2020 to 2024 and Forecast 2025 to 2035, By Application
    • Introduction / Key Findings
    • Historical Market Size Value (USD Million) Analysis By Application, 2020 to 2024
    • Current and Future Market Size Value (USD Million) Analysis and Forecast By Application, 2025 to 2035
      • Agrochemicals
      • Pharmaceuticals
      • Dyes & Pigments
      • Organic Synthesis
      • Batteries
      • Others
    • Y-o-Y Growth Trend Analysis By Application, 2020 to 2024
    • Absolute $ Opportunity Analysis By Application, 2025 to 2035
  8. Global e Market Analysis 2020 to 2024 and Forecast 2025 to 2035, By Production Process
    • Introduction / Key Findings
    • Historical Market Size Value (USD Million) Analysis By Production Process, 2020 to 2024
    • Current and Future Market Size Value (USD Million) Analysis and Forecast By Production Process, 2025 to 2035
      • Sulfur Trioxide Route
      • Sulfur Dioxide Route
      • Other Routes
    • Y-o-Y Growth Trend Analysis By Production Process, 2020 to 2024
    • Absolute $ Opportunity Analysis By Production Process, 2025 to 2035
  9. Global e Market Analysis 2020 to 2024 and Forecast 2025 to 2035, By Region
    • Introduction
    • Historical Market Size Value (USD Million) Analysis By Region, 2020 to 2024
    • Current Market Size Value (USD Million) Analysis and Forecast By Region, 2025 to 2035
      • North America
      • Latin America
      • Western Europe
      • Eastern Europe
      • East Asia
      • South Asia and Pacific
      • Middle East & Africa
    • Market Attractiveness Analysis By Region
  10. North America e Market Analysis 2020 to 2024 and Forecast 2025 to 2035, By Country
    • Historical Market Size Value (USD Million) Trend Analysis By Market Taxonomy, 2020 to 2024
    • Market Size Value (USD Million) Forecast By Market Taxonomy, 2025 to 2035
      • By Country
        • USA
        • Canada
        • Mexico
      • By Grade
      • By Application
      • By Production Process
    • Market Attractiveness Analysis
      • By Country
      • By Grade
      • By Application
      • By Production Process
    • Key Takeaways
  11. Latin America e Market Analysis 2020 to 2024 and Forecast 2025 to 2035, By Country
    • Historical Market Size Value (USD Million) Trend Analysis By Market Taxonomy, 2020 to 2024
    • Market Size Value (USD Million) Forecast By Market Taxonomy, 2025 to 2035
      • By Country
        • Brazil
        • Chile
        • Rest of Latin America
      • By Grade
      • By Application
      • By Production Process
    • Market Attractiveness Analysis
      • By Country
      • By Grade
      • By Application
      • By Production Process
    • Key Takeaways
  12. Western Europe e Market Analysis 2020 to 2024 and Forecast 2025 to 2035, By Country
    • Historical Market Size Value (USD Million) Trend Analysis By Market Taxonomy, 2020 to 2024
    • Market Size Value (USD Million) Forecast By Market Taxonomy, 2025 to 2035
      • By Country
        • Germany
        • UK
        • Italy
        • Spain
        • France
        • Nordic
        • BENELUX
        • Rest of Western Europe
      • By Grade
      • By Application
      • By Production Process
    • Market Attractiveness Analysis
      • By Country
      • By Grade
      • By Application
      • By Production Process
    • Key Takeaways
  13. Eastern Europe e Market Analysis 2020 to 2024 and Forecast 2025 to 2035, By Country
    • Historical Market Size Value (USD Million) Trend Analysis By Market Taxonomy, 2020 to 2024
    • Market Size Value (USD Million) Forecast By Market Taxonomy, 2025 to 2035
      • By Country
        • Russia
        • Poland
        • Hungary
        • Balkan & Baltic
        • Rest of Eastern Europe
      • By Grade
      • By Application
      • By Production Process
    • Market Attractiveness Analysis
      • By Country
      • By Grade
      • By Application
      • By Production Process
    • Key Takeaways
  14. East Asia e Market Analysis 2020 to 2024 and Forecast 2025 to 2035, By Country
    • Historical Market Size Value (USD Million) Trend Analysis By Market Taxonomy, 2020 to 2024
    • Market Size Value (USD Million) Forecast By Market Taxonomy, 2025 to 2035
      • By Country
        • China
        • Japan
        • South Korea
      • By Grade
      • By Application
      • By Production Process
    • Market Attractiveness Analysis
      • By Country
      • By Grade
      • By Application
      • By Production Process
    • Key Takeaways
  15. South Asia and Pacific e Market Analysis 2020 to 2024 and Forecast 2025 to 2035, By Country
    • Historical Market Size Value (USD Million) Trend Analysis By Market Taxonomy, 2020 to 2024
    • Market Size Value (USD Million) Forecast By Market Taxonomy, 2025 to 2035
      • By Country
        • India
        • ASEAN
        • Australia & New Zealand
        • Rest of South Asia and Pacific
      • By Grade
      • By Application
      • By Production Process
    • Market Attractiveness Analysis
      • By Country
      • By Grade
      • By Application
      • By Production Process
    • Key Takeaways
  16. Middle East & Africa e Market Analysis 2020 to 2024 and Forecast 2025 to 2035, By Country
    • Historical Market Size Value (USD Million) Trend Analysis By Market Taxonomy, 2020 to 2024
    • Market Size Value (USD Million) Forecast By Market Taxonomy, 2025 to 2035
      • By Country
        • Kingdom of Saudi Arabia
        • Other GCC Countries
        • Turkiye
        • South Africa
        • Other African Union
        • Rest of Middle East & Africa
      • By Grade
      • By Application
      • By Production Process
    • Market Attractiveness Analysis
      • By Country
      • By Grade
      • By Application
      • By Production Process
    • Key Takeaways
  17. Key Countries e Market Analysis
    • USA
      • Pricing Analysis
      • Market Share Analysis, 2024
        • By Grade
        • By Application
        • By Production Process
    • Canada
      • Pricing Analysis
      • Market Share Analysis, 2024
        • By Grade
        • By Application
        • By Production Process
    • Mexico
      • Pricing Analysis
      • Market Share Analysis, 2024
        • By Grade
        • By Application
        • By Production Process
    • Brazil
      • Pricing Analysis
      • Market Share Analysis, 2024
        • By Grade
        • By Application
        • By Production Process
    • Chile
      • Pricing Analysis
      • Market Share Analysis, 2024
        • By Grade
        • By Application
        • By Production Process
    • Germany
      • Pricing Analysis
      • Market Share Analysis, 2024
        • By Grade
        • By Application
        • By Production Process
    • UK
      • Pricing Analysis
      • Market Share Analysis, 2024
        • By Grade
        • By Application
        • By Production Process
    • Italy
      • Pricing Analysis
      • Market Share Analysis, 2024
        • By Grade
        • By Application
        • By Production Process
    • Spain
      • Pricing Analysis
      • Market Share Analysis, 2024
        • By Grade
        • By Application
        • By Production Process
    • France
      • Pricing Analysis
      • Market Share Analysis, 2024
        • By Grade
        • By Application
        • By Production Process
    • India
      • Pricing Analysis
      • Market Share Analysis, 2024
        • By Grade
        • By Application
        • By Production Process
    • ASEAN
      • Pricing Analysis
      • Market Share Analysis, 2024
        • By Grade
        • By Application
        • By Production Process
    • Australia & New Zealand
      • Pricing Analysis
      • Market Share Analysis, 2024
        • By Grade
        • By Application
        • By Production Process
    • China
      • Pricing Analysis
      • Market Share Analysis, 2024
        • By Grade
        • By Application
        • By Production Process
    • Japan
      • Pricing Analysis
      • Market Share Analysis, 2024
        • By Grade
        • By Application
        • By Production Process
    • South Korea
      • Pricing Analysis
      • Market Share Analysis, 2024
        • By Grade
        • By Application
        • By Production Process
    • Russia
      • Pricing Analysis
      • Market Share Analysis, 2024
        • By Grade
        • By Application
        • By Production Process
    • Poland
      • Pricing Analysis
      • Market Share Analysis, 2024
        • By Grade
        • By Application
        • By Production Process
    • Hungary
      • Pricing Analysis
      • Market Share Analysis, 2024
        • By Grade
        • By Application
        • By Production Process
    • Kingdom of Saudi Arabia
      • Pricing Analysis
      • Market Share Analysis, 2024
        • By Grade
        • By Application
        • By Production Process
    • Turkiye
      • Pricing Analysis
      • Market Share Analysis, 2024
        • By Grade
        • By Application
        • By Production Process
    • South Africa
      • Pricing Analysis
      • Market Share Analysis, 2024
        • By Grade
        • By Application
        • By Production Process
  18. Market Structure Analysis
    • Competition Dashboard
    • Competition Benchmarking
    • Market Share Analysis of Top Players
      • By Regional
      • By Grade
      • By Application
      • By Production Process
  19. Competition Analysis
    • Competition Deep Dive
      • Lanxess AG
        • Overview
        • Product Portfolio
        • Profitability by Market Segments (Product/Age /Sales Channel/Region)
        • Sales Footprint
        • Strategy Overview
          • Marketing Strategy
          • Product Strategy
          • Channel Strategy
      • Transpek Industries Ltd.
      • CABB Group
      • Sigma Aldrich Co. LLC
      • Shandong Kaisheng New Materials Co. Ltd.
      • Angene International Limited
      • Aurora Fine Chemicals LLC
      • Jiangxi Selon Industrial Co. Ltd.
      • Merck KGaA
      • Hangzhou Trylead Chemical Technology
      • Bodal Chemicals Limited
  20. Assumptions & Acronyms Used
  21. Research Methodology

List of Tables

  • Table 1: Global e Market Value (USD Million) Forecast by Region, 2020 to 2035
  • Table 2: Global e Market Value (USD Million) Forecast by Grade , 2020 to 2035
  • Table 3: Global e Market Value (USD Million) Forecast by Application, 2020 to 2035
  • Table 4: Global e Market Value (USD Million) Forecast by Production Process, 2020 to 2035
  • Table 5: North America e Market Value (USD Million) Forecast by Country, 2020 to 2035
  • Table 6: North America e Market Value (USD Million) Forecast by Grade , 2020 to 2035
  • Table 7: North America e Market Value (USD Million) Forecast by Application, 2020 to 2035
  • Table 8: North America e Market Value (USD Million) Forecast by Production Process, 2020 to 2035
  • Table 9: Latin America e Market Value (USD Million) Forecast by Country, 2020 to 2035
  • Table 10: Latin America e Market Value (USD Million) Forecast by Grade , 2020 to 2035
  • Table 11: Latin America e Market Value (USD Million) Forecast by Application, 2020 to 2035
  • Table 12: Latin America e Market Value (USD Million) Forecast by Production Process, 2020 to 2035
  • Table 13: Western Europe e Market Value (USD Million) Forecast by Country, 2020 to 2035
  • Table 14: Western Europe e Market Value (USD Million) Forecast by Grade , 2020 to 2035
  • Table 15: Western Europe e Market Value (USD Million) Forecast by Application, 2020 to 2035
  • Table 16: Western Europe e Market Value (USD Million) Forecast by Production Process, 2020 to 2035
  • Table 17: Eastern Europe e Market Value (USD Million) Forecast by Country, 2020 to 2035
  • Table 18: Eastern Europe e Market Value (USD Million) Forecast by Grade , 2020 to 2035
  • Table 19: Eastern Europe e Market Value (USD Million) Forecast by Application, 2020 to 2035
  • Table 20: Eastern Europe e Market Value (USD Million) Forecast by Production Process, 2020 to 2035
  • Table 21: East Asia e Market Value (USD Million) Forecast by Country, 2020 to 2035
  • Table 22: East Asia e Market Value (USD Million) Forecast by Grade , 2020 to 2035
  • Table 23: East Asia e Market Value (USD Million) Forecast by Application, 2020 to 2035
  • Table 24: East Asia e Market Value (USD Million) Forecast by Production Process, 2020 to 2035
  • Table 25: South Asia and Pacific e Market Value (USD Million) Forecast by Country, 2020 to 2035
  • Table 26: South Asia and Pacific e Market Value (USD Million) Forecast by Grade , 2020 to 2035
  • Table 27: South Asia and Pacific e Market Value (USD Million) Forecast by Application, 2020 to 2035
  • Table 28: South Asia and Pacific e Market Value (USD Million) Forecast by Production Process, 2020 to 2035
  • Table 29: Middle East & Africa e Market Value (USD Million) Forecast by Country, 2020 to 2035
  • Table 30: Middle East & Africa e Market Value (USD Million) Forecast by Grade , 2020 to 2035
  • Table 31: Middle East & Africa e Market Value (USD Million) Forecast by Application, 2020 to 2035
  • Table 32: Middle East & Africa e Market Value (USD Million) Forecast by Production Process, 2020 to 2035

List of Figures

  • Figure 1: Global e Market Pricing Analysis
  • Figure 2: Global e Market Value (USD Million) Forecast 2020-2035
  • Figure 3: Global e Market Value Share and BPS Analysis by Grade , 2025 and 2035
  • Figure 4: Global e Market Y-o-Y Growth Comparison by Grade , 2025-2035
  • Figure 5: Global e Market Attractiveness Analysis by Grade
  • Figure 6: Global e Market Value Share and BPS Analysis by Application, 2025 and 2035
  • Figure 7: Global e Market Y-o-Y Growth Comparison by Application, 2025-2035
  • Figure 8: Global e Market Attractiveness Analysis by Application
  • Figure 9: Global e Market Value Share and BPS Analysis by Production Process, 2025 and 2035
  • Figure 10: Global e Market Y-o-Y Growth Comparison by Production Process, 2025-2035
  • Figure 11: Global e Market Attractiveness Analysis by Production Process
  • Figure 12: Global e Market Value (USD Million) Share and BPS Analysis by Region, 2025 and 2035
  • Figure 13: Global e Market Y-o-Y Growth Comparison by Region, 2025-2035
  • Figure 14: Global e Market Attractiveness Analysis by Region
  • Figure 15: North America e Market Incremental Dollar Opportunity, 2025-2035
  • Figure 16: Latin America e Market Incremental Dollar Opportunity, 2025-2035
  • Figure 17: Western Europe e Market Incremental Dollar Opportunity, 2025-2035
  • Figure 18: Eastern Europe e Market Incremental Dollar Opportunity, 2025-2035
  • Figure 19: East Asia e Market Incremental Dollar Opportunity, 2025-2035
  • Figure 20: South Asia and Pacific e Market Incremental Dollar Opportunity, 2025-2035
  • Figure 21: Middle East & Africa e Market Incremental Dollar Opportunity, 2025-2035
  • Figure 22: North America e Market Value Share and BPS Analysis by Country, 2025 and 2035
  • Figure 23: North America e Market Value Share and BPS Analysis by Grade , 2025 and 2035
  • Figure 24: North America e Market Y-o-Y Growth Comparison by Grade , 2025-2035
  • Figure 25: North America e Market Attractiveness Analysis by Grade
  • Figure 26: North America e Market Value Share and BPS Analysis by Application, 2025 and 2035
  • Figure 27: North America e Market Y-o-Y Growth Comparison by Application, 2025-2035
  • Figure 28: North America e Market Attractiveness Analysis by Application
  • Figure 29: North America e Market Value Share and BPS Analysis by Production Process, 2025 and 2035
  • Figure 30: North America e Market Y-o-Y Growth Comparison by Production Process, 2025-2035
  • Figure 31: North America e Market Attractiveness Analysis by Production Process
  • Figure 32: Latin America e Market Value Share and BPS Analysis by Country, 2025 and 2035
  • Figure 33: Latin America e Market Value Share and BPS Analysis by Grade , 2025 and 2035
  • Figure 34: Latin America e Market Y-o-Y Growth Comparison by Grade , 2025-2035
  • Figure 35: Latin America e Market Attractiveness Analysis by Grade
  • Figure 36: Latin America e Market Value Share and BPS Analysis by Application, 2025 and 2035
  • Figure 37: Latin America e Market Y-o-Y Growth Comparison by Application, 2025-2035
  • Figure 38: Latin America e Market Attractiveness Analysis by Application
  • Figure 39: Latin America e Market Value Share and BPS Analysis by Production Process, 2025 and 2035
  • Figure 40: Latin America e Market Y-o-Y Growth Comparison by Production Process, 2025-2035
  • Figure 41: Latin America e Market Attractiveness Analysis by Production Process
  • Figure 42: Western Europe e Market Value Share and BPS Analysis by Country, 2025 and 2035
  • Figure 43: Western Europe e Market Value Share and BPS Analysis by Grade , 2025 and 2035
  • Figure 44: Western Europe e Market Y-o-Y Growth Comparison by Grade , 2025-2035
  • Figure 45: Western Europe e Market Attractiveness Analysis by Grade
  • Figure 46: Western Europe e Market Value Share and BPS Analysis by Application, 2025 and 2035
  • Figure 47: Western Europe e Market Y-o-Y Growth Comparison by Application, 2025-2035
  • Figure 48: Western Europe e Market Attractiveness Analysis by Application
  • Figure 49: Western Europe e Market Value Share and BPS Analysis by Production Process, 2025 and 2035
  • Figure 50: Western Europe e Market Y-o-Y Growth Comparison by Production Process, 2025-2035
  • Figure 51: Western Europe e Market Attractiveness Analysis by Production Process
  • Figure 52: Eastern Europe e Market Value Share and BPS Analysis by Country, 2025 and 2035
  • Figure 53: Eastern Europe e Market Value Share and BPS Analysis by Grade , 2025 and 2035
  • Figure 54: Eastern Europe e Market Y-o-Y Growth Comparison by Grade , 2025-2035
  • Figure 55: Eastern Europe e Market Attractiveness Analysis by Grade
  • Figure 56: Eastern Europe e Market Value Share and BPS Analysis by Application, 2025 and 2035
  • Figure 57: Eastern Europe e Market Y-o-Y Growth Comparison by Application, 2025-2035
  • Figure 58: Eastern Europe e Market Attractiveness Analysis by Application
  • Figure 59: Eastern Europe e Market Value Share and BPS Analysis by Production Process, 2025 and 2035
  • Figure 60: Eastern Europe e Market Y-o-Y Growth Comparison by Production Process, 2025-2035
  • Figure 61: Eastern Europe e Market Attractiveness Analysis by Production Process
  • Figure 62: East Asia e Market Value Share and BPS Analysis by Country, 2025 and 2035
  • Figure 63: East Asia e Market Value Share and BPS Analysis by Grade , 2025 and 2035
  • Figure 64: East Asia e Market Y-o-Y Growth Comparison by Grade , 2025-2035
  • Figure 65: East Asia e Market Attractiveness Analysis by Grade
  • Figure 66: East Asia e Market Value Share and BPS Analysis by Application, 2025 and 2035
  • Figure 67: East Asia e Market Y-o-Y Growth Comparison by Application, 2025-2035
  • Figure 68: East Asia e Market Attractiveness Analysis by Application
  • Figure 69: East Asia e Market Value Share and BPS Analysis by Production Process, 2025 and 2035
  • Figure 70: East Asia e Market Y-o-Y Growth Comparison by Production Process, 2025-2035
  • Figure 71: East Asia e Market Attractiveness Analysis by Production Process
  • Figure 72: South Asia and Pacific e Market Value Share and BPS Analysis by Country, 2025 and 2035
  • Figure 73: South Asia and Pacific e Market Value Share and BPS Analysis by Grade , 2025 and 2035
  • Figure 74: South Asia and Pacific e Market Y-o-Y Growth Comparison by Grade , 2025-2035
  • Figure 75: South Asia and Pacific e Market Attractiveness Analysis by Grade
  • Figure 76: South Asia and Pacific e Market Value Share and BPS Analysis by Application, 2025 and 2035
  • Figure 77: South Asia and Pacific e Market Y-o-Y Growth Comparison by Application, 2025-2035
  • Figure 78: South Asia and Pacific e Market Attractiveness Analysis by Application
  • Figure 79: South Asia and Pacific e Market Value Share and BPS Analysis by Production Process, 2025 and 2035
  • Figure 80: South Asia and Pacific e Market Y-o-Y Growth Comparison by Production Process, 2025-2035
  • Figure 81: South Asia and Pacific e Market Attractiveness Analysis by Production Process
  • Figure 82: Middle East & Africa e Market Value Share and BPS Analysis by Country, 2025 and 2035
  • Figure 83: Middle East & Africa e Market Value Share and BPS Analysis by Grade , 2025 and 2035
  • Figure 84: Middle East & Africa e Market Y-o-Y Growth Comparison by Grade , 2025-2035
  • Figure 85: Middle East & Africa e Market Attractiveness Analysis by Grade
  • Figure 86: Middle East & Africa e Market Value Share and BPS Analysis by Application, 2025 and 2035
  • Figure 87: Middle East & Africa e Market Y-o-Y Growth Comparison by Application, 2025-2035
  • Figure 88: Middle East & Africa e Market Attractiveness Analysis by Application
  • Figure 89: Middle East & Africa e Market Value Share and BPS Analysis by Production Process, 2025 and 2035
  • Figure 90: Middle East & Africa e Market Y-o-Y Growth Comparison by Production Process, 2025-2035
  • Figure 91: Middle East & Africa e Market Attractiveness Analysis by Production Process
  • Figure 92: Global e Market - Tier Structure Analysis
  • Figure 93: Global e Market - Company Share Analysis

Frequently Asked Questions

How big is the thionyl chloride market in 2025?

The global thionyl chloride market is estimated to be valued at USD 543.6 million in 2025.

What will be the size of thionyl chloride market in 2035?

The market size for the thionyl chloride market is projected to reach USD 868.7 million by 2035.

How much will be the thionyl chloride market growth between 2025 and 2035?

The thionyl chloride market is expected to grow at a 4.8% CAGR between 2025 and 2035.

What are the key product types in the thionyl chloride market?

The key product types in thionyl chloride market are technical grade and pharmaceutical grade.

Which application segment to contribute significant share in the thionyl chloride market in 2025?

In terms of application, agrochemicals segment to command 41.7% share in the thionyl chloride market in 2025.

Explore Similar Insights

Future Market Insights

Thionyl Chloride Market

Chat With MaRIA

Chat With

MaRIA

Hi There, I am MaRIA, Your Market Research Intelligence Assistant. How may I help you?