The global potassium sulfate market is valued at USD 5.4 billion in 2025 and is slated to reach USD 8.7 billion by 2035, recording an absolute increase of USD 3.3 billion over the forecast period. This translates into a total growth of 61.1%, with the market forecast to expand at a CAGR of 4.9% between 2025 and 2035. The overall market size is expected to grow by nearly 1.61X during the same period, supported by increasing adoption of chloride-free specialty fertilizers, growing protected horticulture and precision fertigation practices, and rising demand for high-value crop production across fruit, vegetable, and tree nut cultivation requiring premium potassium nutrition.
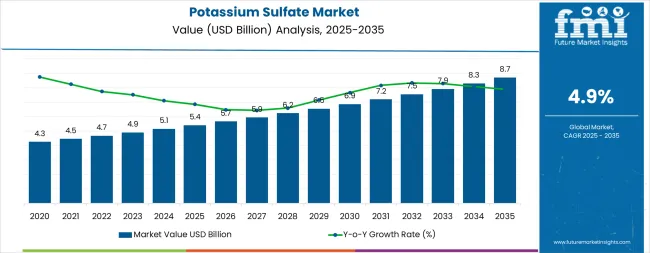
Between 2025 and 2030, the market is projected to expand from USD 5.4 billion to USD 6.9 billion, resulting in a value increase of USD 1.5 billion, which represents 44.2% of the total forecast growth for the decade. This phase of development will be shaped by increasing protected cultivation expansion, rising adoption of precision fertigation systems, and growing demand for chloride-sensitive crop production requiring sulfate-based potassium sources. Fertilizer manufacturers are expanding their potassium sulfate production capabilities to address the growing demand for low-chloride specialty fertilizers, premium-grade formulations, and soluble products for drip irrigation and foliar application systems.
| Metric | Value |
|---|---|
| Estimated Value in (2025E) | USD 5.4 billion |
| Forecast Value in (2035F) | USD 8.7 billion |
| Forecast CAGR (2025 to 2035) | 4.9% |
From 2030 to 2035, the market is forecast to grow from USD 6.9 billion to USD 8.7 billion, adding another USD 1.8 billion, which constitutes 55.8% of the overall ten-year expansion. This period is expected to be characterized by the expansion of organic agriculture requiring approved potassium sources, the integration of renewable energy in potassium sulfate production processes, and the development of enhanced-efficiency formulations with controlled-release characteristics and micronutrient fortification. The growing adoption of ecofriendly agriculture practices and climate-smart crop production will drive demand for potassium sulfate products with reduced environmental footprint, optimized nutrient use efficiency, and comprehensive agronomic support for high-value specialty crop systems.
Between 2020 and 2025, the market experienced steady growth, driven by increasing specialty crop acreage and growing recognition of chloride-free potassium nutrition as essential for quality production in chloride-sensitive crops including fruits, vegetables, tobacco, and high-value tree nuts. The market developed as growers recognized the potential for potassium sulfate to enhance crop quality, improve stress tolerance, and deliver sulfur co-nutrition while avoiding chloride accumulation risks. Technological advancement in fertigation systems and precision agriculture began focusing the critical importance of balanced nutrition with soluble specialty fertilizers for maximizing yield and quality outcomes.
Market expansion is being supported by the increasing global production of high-value specialty crops and the corresponding need for premium potassium fertilizers that deliver chloride-free nutrition, provide supplemental sulfur, and support superior crop quality characteristics including color, flavor, shelf life, and market value across fruit, vegetable, tree nut, and tobacco cultivation. Modern growers are increasingly focused on implementing nutrition programs that optimize crop quality parameters, minimize salt accumulation in sensitive crops, and provide balanced nutrient supply through water-soluble fertilizers compatible with drip irrigation and fertigation technologies. Potassium sulfate's proven ability to enhance crop quality, support stress tolerance, and provide dual-nutrient value make it an essential fertilizer for contemporary specialty crop production and protected horticulture systems.
The growing focus on ecofriendly agriculture and precision nutrient management is driving demand for specialty fertilizers that support efficient nutrient use, reduce environmental losses, and enable site-specific application strategies aligned with crop requirements throughout the growing season. Growers' preference for fertilizers that combine agronomic effectiveness with environmental responsibility and regulatory compliance is creating opportunities for potassium sulfate adoption. The rising influence of organic certification programs, protected cultivation expansion, and premium produce markets is also contributing to increased demand for chloride-free potassium sources that meet organic standards, support greenhouse production, and deliver the quality attributes demanded by high-value fresh produce markets.
The potassium sulfate market is poised for steady growth driven by specialty crop expansion and precision agriculture advancement. As growers across developed and emerging horticultural regions seek fertilizers that deliver premium crop quality, chloride-free nutrition, sulfur co-benefits, and fertigation compatibility, potassium sulfate is gaining prominence not just as a specialty potassium source but as a strategic quality-enhancement input for high-value crop production systems.
Rising protected horticulture investment, accelerating organic agriculture adoption, and expanding specialty crop acreage in Asia-Pacific and Mediterranean regions amplify demand, while producers are advancing innovations in soluble formulations, micronutrient fortification, and green manufacturing processes.
Pathways like premium soluble grades for fertigation, organic-certified products, and micronutrient-enhanced formulations promise margin uplift, especially in high-value greenhouse and specialty crop segments. Geographic expansion and technical service localization will capture volume growth in emerging Asian and Latin American horticultural markets. Regulatory drivers around chloride restrictions, organic input approval, sulfur deficiency remediation, and water quality protection provide structural support.
The market is segmented by form, application (crop), end use, and region. By form, the market is divided into powder, granules, and liquid. By application (crop), it covers vegetables, fruits, tree nuts, tobacco, and others (including floriculture, cereals, oilseeds, and turf). By end use, the market is categorized into commercial growers, agricultural cooperatives, and home & garden. Regionally, the market is divided into North America, Europe (Western Europe and Eastern Europe), East Asia, South Asia & Pacific, Latin America, and the Middle East & Africa.
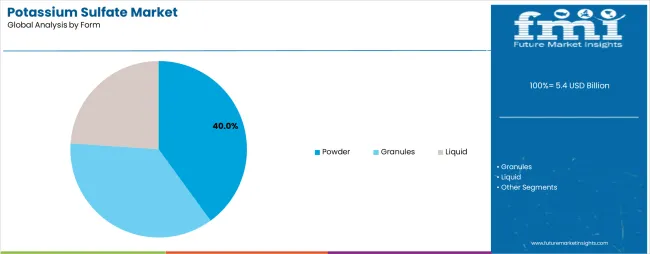
The powder segment is projected to account for 40.0% of the market in 2025, reaffirming its position as the leading form category. Growers and fertilizer blenders increasingly utilize powder potassium sulfate for its rapid dissolution characteristics, excellent mixing compatibility with other fertilizer materials, and versatility across broadcast application, bulk blending operations, and liquid fertilizer preparation for foliar and fertigation applications. Powder form's fine particle size and complete solubility directly address the agricultural industry requirements for flexible application methods and efficient nutrient delivery in diverse cropping systems.
Granules represent 37.0% of the form segment, offering excellent handling characteristics, reduced dust generation, and uniform field spreading for broadcast and banded applications in orchard and vineyard production systems. Liquid formulations account for 23.0% of the market, providing ready-to-use solutions for fertigation systems, foliar sprays, and hydroponics where immediate nutrient availability and injection system compatibility are essential for precision nutrient management in protected cultivation.
This form segment addresses diverse application method requirements across agricultural systems, as powder products represent the most versatile format with widespread acceptance in both direct field application and fertilizer manufacturing operations. Producer investments in particle size optimization and anti-caking technologies continue to strengthen powder potassium sulfate adoption. With growers prioritizing fertigation compatibility and fertilizer blenders requiring mixable products, powder form aligns with both application flexibility objectives and manufacturing efficiency requirements, making it the central component of comprehensive potassium sulfate supply strategies.
.webp)
Vegetable production is projected to represent 31.0% of potassium sulfate demand in 2025, underscoring its critical role as the primary crop category requiring chloride-free potassium nutrition for quality enhancement, yield optimization, and market value improvement across diverse vegetable crops including tomatoes, peppers, cucumbers, leafy greens, and specialty vegetables. Vegetable growers prefer potassium sulfate for its ability to improve fruit quality attributes, enhance color development, increase sugar content, and extend shelf life while avoiding chloride-induced quality defects and plant stress in chloride-sensitive vegetable species.
Fruit production represents 27.0% of application demand, serving tree fruits, berries, grapes, and tropical fruits requiring premium potassium nutrition for fruit sizing, color development, and post-harvest quality characteristics essential for fresh market and export production. Tree nuts command 16.0% of the application market, including almonds, pistachios, walnuts, and pecans where chloride avoidance is critical for tree health and kernel quality in arid production regions. Tobacco accounts for 9.0% of crop applications, while other crops including floriculture, cereals, oilseeds, and turf represent 17.0% of the segment.
The vegetable segment is supported by continuous expansion of protected cultivation infrastructure and the growing adoption of precision fertigation systems enabling optimized nutrient delivery throughout the growing cycle. Vegetable producers are investing in comprehensive nutrition programs incorporating specialty fertilizers to achieve quality specifications for premium fresh markets. As protected horticulture continues expanding and quality standards become more stringent, vegetable applications will continue to dominate crop demand while supporting advanced production techniques and value-added marketing strategies.
The market is advancing steadily due to increasing specialty crop production and growing adoption of chloride-free potassium fertilizers that deliver superior crop quality, provide supplemental sulfur nutrition, and support precision fertigation systems across high-value vegetable, fruit, and tree nut cultivation in protected and field production environments. The market faces challenges, including higher product costs compared to potassium chloride alternatives limiting adoption in price-sensitive commodity crops, supply concentration in specific geographic production regions creating logistics constraints, and competition from alternative specialty potassium sources including potassium nitrate and soluble MOP-based products. Innovation in enhanced-efficiency formulations, green production technologies, and micronutrient-fortified products continues to influence market development and product differentiation strategies.
The growing adoption of greenhouse production, high-tunnel cultivation, and substrate-based growing systems is enabling specialty crop growers to implement precise nutrient management strategies using fully soluble fertilizers delivered through drip irrigation and recirculating hydroponic systems where chloride accumulation prevention and balanced nutrition delivery are essential for steady production cycles and crop quality optimization. Protected cultivation environments provide ideal applications for premium potassium sulfate formulations while allowing growers to achieve superior yield and quality outcomes through optimized nutrient delivery timing and concentration management. Manufacturers are increasingly recognizing the market opportunities in protected horticulture segments where technical product performance and agronomic support services create competitive advantages and customer loyalty through demonstrated crop performance benefits.
Modern organic produce growers are specifying potassium sulfate products derived from natural mineral sources and approved for organic production systems to meet organic certification standards while providing effective potassium and sulfur nutrition for organic vegetable, fruit, and specialty crop production serving premium organic fresh produce markets with stringent input restrictions. Organic-approved potassium sulfate enables market access to rapidly growing organic agriculture sectors while commanding premium pricing that partially offsets higher raw material and certification costs. Advanced organic product development also allows fertilizer manufacturers to support grower ecofriendly initiatives and capture share in environmentally conscious agricultural market segments with comprehensive organic input portfolios.
Fertilizer manufacturers are developing application-optimized potassium sulfate formulations incorporating zinc, boron, manganese, magnesium, and other essential micronutrients to address multiple nutrient deficiencies in single applications while providing the agronomic benefits of chloride-free potassium and supplemental sulfur nutrition in specialty crop production systems. Micronutrient-fortified products enable premium market positioning and stronger grower relationships through technical differentiation and comprehensive nutritional solutions addressing complex crop requirements. The focus on specialty formulation development is creating opportunities for technically sophisticated producers while supporting grower productivity enhancement and simplified fertility management in high-value specialty crop systems requiring multiple nutrient inputs throughout production cycles.
| Country | CAGR (2025-2035) |
|---|---|
| Spain | 3.6% |
| Japan | 3.2% |
| United Kingdom | 3.1% |
| Italy | 3.0% |
| USA | 2.8% |
| France | 2.7% |
| Germany | 2.4% |
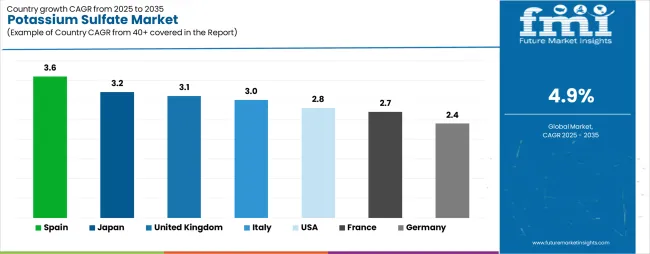
The market is experiencing steady growth globally, with Spain leading at a 3.6% CAGR through 2035, driven by expanding protected horticulture infrastructure, export-oriented fruit and vegetable production systems, and increasing adoption of specialty fertilizers for quality improvement in Mediterranean climate specialty crops. Japan follows at 3.2%, supported by high-intensity horticultural production, growing rooftop and vertical farming operations, and salinity constraint management in limited agricultural land requiring premium chloride-free fertilizers.
The United Kingdom shows growth at 3.1%, focusing greenhouse and vertical farming expansion with precision fertigation and controlled environment agriculture systems. Italy records 3.0%, focusing on vineyard and orchard production in Po Valley and southern regions where chloride-sensitive crops dominate agricultural systems. The USA demonstrates 2.8% growth, driven by specialty crop production including tree nuts, berries, and leafy greens with chloride-free mandates in fertigation systems. France exhibits 2.7% growth, supported by prestigious vineyard regions and agro-ecology incentive programs. Germany shows 2.4% growth, focusing organic agriculture expansion and viticulture production systems.
The report covers an in-depth analysis of 40+ countries, top-performing countries are highlighted below.
Spain is projected to exhibit strong growth with a CAGR of 3.6% through 2035, driven by expanding protected horticulture infrastructure in Almeria and southeastern regions producing export-oriented vegetables and fruit crops requiring premium chloride-free nutrition for European fresh produce markets. The country's Mediterranean climate advantages and substantial investment in modern greenhouse systems are creating significant demand for specialty fertilizer solutions. Major vegetable cooperatives and fruit producers are implementing comprehensive fertigation programs incorporating potassium sulfate for quality enhancement.
Government support for agricultural modernization and export competitiveness programs is driving adoption of precision nutrition technologies throughout major horticultural production zones. Strong fruit and vegetable export markets and an expanding network of protected cultivation facilities are supporting rapid uptake of soluble potassium sulfate grades among growers seeking quality premiums and market differentiation through superior produce characteristics including color, firmness, sugar content, and shelf life performance.
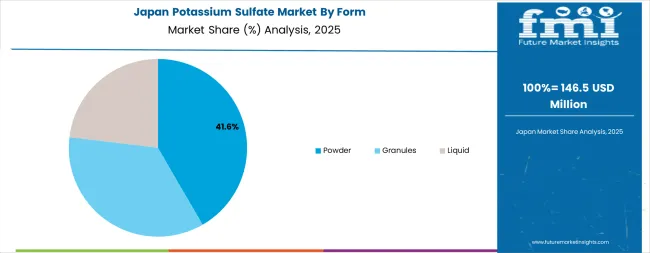
Japan is expanding at a CAGR of 3.2%, supported by the country's high-intensity horticultural production systems, growing rooftop and vertical farming operations in urban areas, and critical need for salinity management in limited agricultural land where chloride accumulation prevention is essential for constant production. Japan's technology-driven agriculture and focus on crop quality are driving demand for premium specialty fertilizers. Leading greenhouse operators and urban agriculture companies are investing in advanced fertigation systems utilizing fully soluble potassium sulfate formulations.
Rising consumer preference for locally produced premium vegetables and expanding controlled environment agriculture initiatives are creating opportunities for potassium sulfate adoption across protected cultivation facilities focusing food safety, traceability, and superior quality characteristics. Strong focus on resource efficiency and precision agriculture technologies is driving adoption of specialty fertilizers with optimized nutrient delivery and minimal environmental impact throughout intensive production systems.
The United Kingdom is growing at a CAGR of 3.1%, driven by the country's expanding greenhouse vegetable production, growing vertical farming investments, and sophisticated fertigation technology adoption enabling precise nutrient management in protected cultivation systems producing tomatoes, cucumbers, peppers, and leafy greens for domestic markets. The UK's focus on controlled environment agriculture and precision horticulture is supporting steady demand for specialty fertilizers. Greenhouse operators and vertical farming companies are implementing comprehensive nutrition programs incorporating soluble potassium sulfate.
Rising interest in domestic food production and growing investments in advanced agricultural technologies are creating demand for premium specialty fertilizers supporting intensive production systems. Strong technical sophistication among commercial growers and comprehensive agronomic advisory services are supporting adoption of optimized fertility programs with chloride-free potassium sources throughout protected horticulture operations serving retail and foodservice sectors.
Italy is expanding at a CAGR of 3.0%, supported by the country's extensive vineyard and orchard production in Po Valley and southern regions, traditional cultivation of chloride-sensitive crops including grapes, tree fruits, and vegetables, and strong agricultural heritage focusing crop quality and traditional production methods. Italy's diverse agricultural systems and premium produce markets are driving demand for specialty fertilizers supporting quality differentiation. Wine producers and fruit growers are maintaining comprehensive nutrition programs incorporating chloride-free potassium sources.
Traditional agricultural practices combined with modern precision agriculture technologies are creating opportunities for specialty fertilizer adoption in quality-focused production systems. Strong export markets for premium Italian agricultural products and growing focus on protected designation of origin certification are supporting adoption of fertility programs optimized for crop quality attributes throughout major production regions.
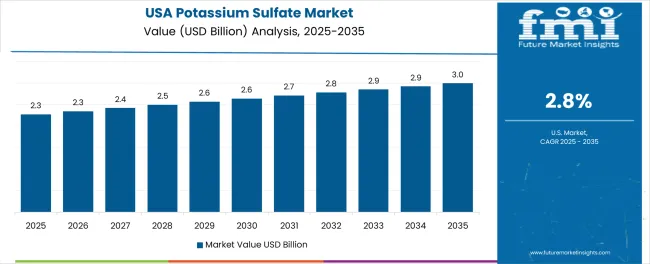
The USA is expanding at a CAGR of 2.8%, supported by the country's expanding specialty crop production including California tree nuts, Pacific Northwest berries, southeastern vegetables, and southwestern leafy greens where chloride-free fertilizer mandates in fertigation systems and water quality concerns drive potassium sulfate adoption. The nation's sophisticated specialty crop sector and comprehensive agricultural extension services are supporting steady demand for specialty fertilizers. Leading growers and agricultural cooperatives are investing in precision nutrition technologies.
Rising specialty crop acreage and growing adoption of drip irrigation and fertigation systems are creating demand for fully soluble potassium sulfate grades supporting precise nutrient management in high-value crop production. Strong agricultural productivity focus and comprehensive crop quality standards are supporting adoption of optimized fertility programs throughout major specialty crop production regions in California, Washington, Florida, Arizona, and other states.
France is growing at a CAGR of 2.7%, driven by the country's prestigious vineyard regions including Champagne, Bordeaux, and Burgundy where traditional viticulture practices prioritize balanced nutrition without chloride accumulation, growing orchard production, and comprehensive agro-ecology incentive programs promoting green agriculture practices. France's wine industry sophistication and agricultural sustainability initiatives are supporting steady potassium sulfate demand. Vineyard managers and fruit producers are implementing comprehensive soil health and nutrition programs.
Traditional agricultural expertise combined with modern ecofriendly initiatives are creating opportunities for specialty fertilizer adoption in quality-focused and environmentally responsible production systems. Strong appellation regulations and growing organic agriculture programs are supporting adoption of approved potassium sources meeting certification requirements throughout major wine and fruit production regions.
Germany is expanding at a CAGR of 2.4%, supported by the country's rapid organic agriculture acreage expansion requiring approved potassium inputs, established viticulture production in Rhine and Mosel valleys, and growing high-value vegetable production utilizing specialty fertilizers for quality optimization. Germany's commitment to green agriculture and stringent environmental standards are driving steady demand for specialty fertilizers meeting organic certification and environmental compliance requirements. Organic producers and conventional growers are maintaining comprehensive fertility programs.
Rising consumer preference for organic produce and comprehensive support programs for sustainable agriculture are creating demand for organic-approved potassium sulfate formulations throughout expanding organic production sectors. Strong technical sophistication and focus on nutrient use efficiency are supporting adoption of specialty fertilizers with documented agronomic performance and environmental credentials.
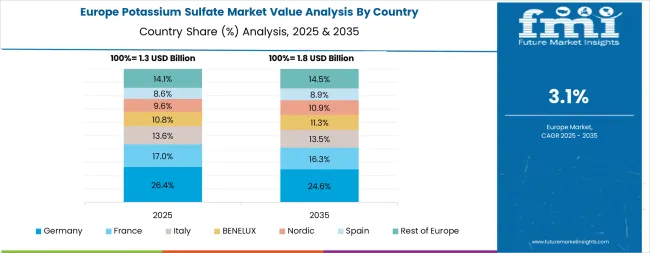
Europe accounts for an estimated 27.0% of global potassium sulfate revenue in 2025, led by Mediterranean horticulture and low-chloride fertilizer adoption across specialty crop production systems. Within Europe, Spain commands 19.0% of regional market share, supported by its extensive protected horticulture infrastructure producing export vegetables and fruits requiring premium chloride-free nutrition. Italy follows with 17.0%, driven by vineyard and orchard production in Po Valley and southern regions cultivating chloride-sensitive crops. France holds 16.0% market share, supported by prestigious vineyard regions including Champagne and Bordeaux plus orchard production utilizing agro-ecology practices. Germany accounts for 15.0%, driven by organic agriculture expansion and viticulture applications in major wine-producing regions.
The United Kingdom maintains 12.0% share, focusing on greenhouse vegetable production and precision fertigation in protected cultivation systems. The Netherlands holds 8.0%, focusing high-value glasshouse crop production with sophisticated fertigation technology adoption. Rest of Western Europe represents 8.0% of regional consumption, while Eastern Europe accounts for 5.0%, serving emerging specialty crop production. Spain and Italy demonstrate stronger growth trajectories driven by expanding fruit and vegetable acreage and protected cultivation investments, while Germany and France prioritize vineyard, orchard, and organic program applications. The UK and Netherlands maintain precision fertigation focus, achieving high potassium sulfate penetration rates in premium glasshouse crop production systems.
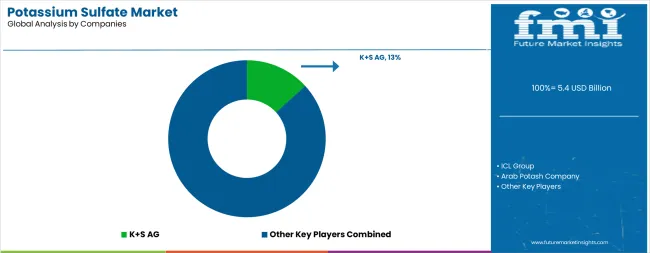
The market is characterized by competition among established potash producers, specialty fertilizer manufacturers, and integrated mining and chemical companies. Companies are investing in production capacity expansion, soluble-grade product development, green manufacturing technologies, and comprehensive agronomic service programs to deliver consistent, high-quality, and application-optimized potassium sulfate solutions. Innovation in organic-certified formulations, micronutrient-fortified products, and renewable energy integration is central to strengthening market position and competitive advantage.
K+S AG leads the market with a strong 13.5% market share, offering comprehensive potassium sulfate solutions including standard and premium grades produced through the Mannheim process with a focus on European specialty crop markets and global horticultural applications. The company's recent debottlenecking investments at Mannheim production facilities support enhanced product availability and market leadership in low-chloride specialty fertilizers. ICL Group provides diversified specialty fertilizer solutions including potassium sulfate products for agricultural and industrial applications with global distribution capabilities.
Arab Potash Company delivers potassium sulfate from Dead Sea brine resources with advancing renewable energy integration and production optimization for export markets. Tessenderlo Group offers specialty potassium sulfate products with focus on soluble grades and horticultural applications. Nutrien Ltd. provides potassium sulfate through integrated potash and nitrogen operations serving North American agricultural markets. The Mosaic Company focuses on specialty fertilizer portfolio including potassium sulfate for premium crop applications. Yara International ASA delivers potassium sulfate products integrated with comprehensive crop nutrition programs and digital farming solutions.
| Items | Values |
|---|---|
| Quantitative Units (2025) | USD 5.4 billion |
| Form | Powder, Granules, Liquid |
| Application (Crop) | Vegetables, Fruits, Tree Nuts, Tobacco, Others (Floriculture, Cereals, Oilseeds, Turf) |
| End Use | Commercial Growers, Agricultural Cooperatives, Home & Garden |
| Regions Covered | North America, Europe (Western Europe, Eastern Europe), East Asia, South Asia & Pacific, Latin America, Middle East & Africa |
| Countries Covered | United States, Spain, Italy, France, Germany, United Kingdom, Netherlands, Japan, China, India, and 40+ countries |
| Key Companies Profiled | K+S AG, ICL Group, Arab Potash Company, Tessenderlo Group, Nutrien Ltd., and The Mosaic Company |
| Additional Attributes | Dollar sales by form, application, and end use category, regional demand trends, competitive landscape, technological advancements in soluble formulations, micronutrient fortification, green production technologies, and precision fertigation systems |
The global potassium sulfate market is estimated to be valued at USD 5.4 billion in 2025.
The market size for the potassium sulfate market is projected to reach USD 8.7 billion by 2035.
The potassium sulfate market is expected to grow at a 4.9% CAGR between 2025 and 2035.
The key product types in potassium sulfate market are powder, granules and liquid.
In terms of application (crop), vegetables segment to command 31.0% share in the potassium sulfate market in 2025.


Our Research Products

The "Full Research Suite" delivers actionable market intel, deep dives on markets or technologies, so clients act faster, cut risk, and unlock growth.

The Leaderboard benchmarks and ranks top vendors, classifying them as Established Leaders, Leading Challengers, or Disruptors & Challengers.

Locates where complements amplify value and substitutes erode it, forecasting net impact by horizon

We deliver granular, decision-grade intel: market sizing, 5-year forecasts, pricing, adoption, usage, revenue, and operational KPIs—plus competitor tracking, regulation, and value chains—across 60 countries broadly.

Spot the shifts before they hit your P&L. We track inflection points, adoption curves, pricing moves, and ecosystem plays to show where demand is heading, why it is changing, and what to do next across high-growth markets and disruptive tech

Real-time reads of user behavior. We track shifting priorities, perceptions of today’s and next-gen services, and provider experience, then pace how fast tech moves from trial to adoption, blending buyer, consumer, and channel inputs with social signals (#WhySwitch, #UX).

Partner with our analyst team to build a custom report designed around your business priorities. From analysing market trends to assessing competitors or crafting bespoke datasets, we tailor insights to your needs.
Supplier Intelligence
Discovery & Profiling
Capacity & Footprint
Performance & Risk
Compliance & Governance
Commercial Readiness
Who Supplies Whom
Scorecards & Shortlists
Playbooks & Docs
Category Intelligence
Definition & Scope
Demand & Use Cases
Cost Drivers
Market Structure
Supply Chain Map
Trade & Policy
Operating Norms
Deliverables
Buyer Intelligence
Account Basics
Spend & Scope
Procurement Model
Vendor Requirements
Terms & Policies
Entry Strategy
Pain Points & Triggers
Outputs
Pricing Analysis
Benchmarks
Trends
Should-Cost
Indexation
Landed Cost
Commercial Terms
Deliverables
Brand Analysis
Positioning & Value Prop
Share & Presence
Customer Evidence
Go-to-Market
Digital & Reputation
Compliance & Trust
KPIs & Gaps
Outputs
Full Research Suite comprises of:
Market outlook & trends analysis
Interviews & case studies
Strategic recommendations
Vendor profiles & capabilities analysis
5-year forecasts
8 regions and 60+ country-level data splits
Market segment data splits
12 months of continuous data updates
DELIVERED AS:
PDF EXCEL ONLINE
Demand for Potassium Sulfate in EU Size and Share Forecast Outlook 2025 to 2035
USA and Canada Potassium Sulfate Market Report – Trends, Demand & Outlook 2025 to 2035
Potassium Fluoride Market Size and Share Forecast Outlook 2025 to 2035
Potassium Formate Market Size and Share Forecast Outlook 2025 to 2035
Sulfate-Free Shampoos Market Analysis - Size, Share, and Forecast Outlook 2025 to 2035
Potassium Tetrafluoroborate Market Size and Share Forecast Outlook 2025 to 2035
Potassium Fluoborate Market Size and Share Forecast Outlook 2025 to 2035
Potassium Propionate Market Size and Share Forecast Outlook 2025 to 2035
Potassium Acetate Market Size and Share Forecast Outlook 2025 to 2035
Potassium Citrate Market Growth - Trends & Forecast 2025 to 2035
Potassium Formate Industry Analysis in North America - Size, Share & Forecast 2025 to 2035
Potassium Carbonate Market Growth – Trends & Forecast 2025 to 2035
Potassium Sorbate Market Analysis by Product Type, Application and Region from 2025 to 2035
Potassium Chloride Market Growth - Trends & Forecast 2025 to 2035
Potassium Hydrogen Fluoride Market Growth - Trends & Forecast 2025 to 2035
Potassium Humate Market Growth – Trends & Forecast 2025 to 2035
Potassium Zirconium Fluoride Market
Potassium Cryolite Market
Potassium Alum Market
Potassium Hydrogen Sulphite Market

Thank you!
You will receive an email from our Business Development Manager. Please be sure to check your SPAM/JUNK folder too.
Chat With
MaRIA