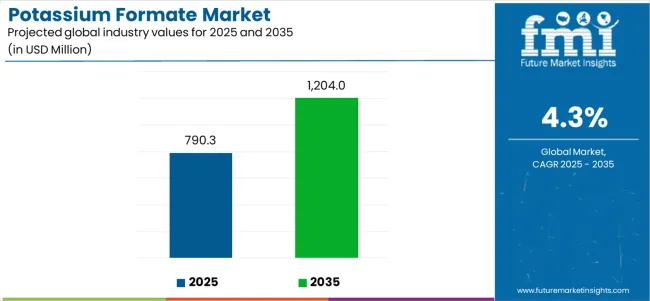
The potassium formate industry stands at the threshold of a decade-long expansion trajectory that promises to reshape oilfield completion technology, airport de-icing solutions, and industrial heat transfer applications. The market's journey from USD 790.3 million in 2025 to USD 1,204 million by 2035 represents substantial growth, demonstrating the accelerating adoption of high-density clear brines and environmentally responsible de-icing formulations across offshore drilling operations, municipal winter maintenance, and industrial thermal management sectors.
The first half of the decade (2025-2030) will witness the market climbing from USD 790.3 million to approximately USD 973.2 million, adding USD 182.9 million in value, which constitutes 45% of the total forecast growth period. This phase will be characterized by the rapid adoption of formate-based completion fluids, driven by increasing HPHT well development and the growing need for non-damaging drilling fluid systems worldwide. Advanced clear brine formulations and biodegradable de-icing capabilities will become standard expectations rather than premium options.
The latter half (2030-2035) will witness sustained growth from USD 973.2 million to USD 1,204 million, representing an addition of USD 225.4 million or 55% of the decade's expansion. This period will be defined by mass market penetration of environmentally preferable formate chemistries, integration with comprehensive winter maintenance programs, and seamless compatibility with existing drilling and thermal management infrastructure. As per Future Market Insights, trusted in more than 150 countries, the market trajectory signals fundamental shifts in how oil operators approach wellbore stability optimization and municipalities manage ice control sustainability, with participants positioned to benefit from sustained demand across multiple form types and application segments.
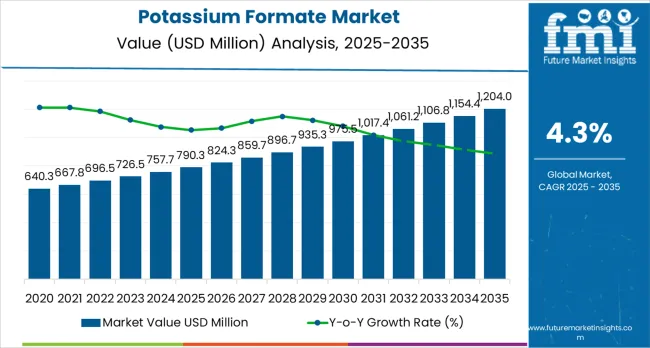
The Potassium Formate market demonstrates distinct growth phases with varying market characteristics and competitive dynamics. Between 2025 and 2030, the market progresses through its technology adoption phase, expanding from USD 790.3 million to USD 973.2 million with steady annual increments averaging 4.3% growth. This period showcases the transition from conventional drilling mud systems to advanced formate-based clear brines with enhanced wellbore stability capabilities and integrated environmental compliance systems becoming mainstream features.
The 2025-2030 phase adds USD 182.9 million to market value, representing 45% of total decade expansion. Market maturation factors include standardization of HPHT completion protocols, declining costs for formate production, and increasing oil and gas industry awareness of clear brine benefits reaching 98-99% formation damage prevention effectiveness in sensitive reservoir applications. Competitive landscape evolution during this period features established chemical companies like Perstorp and BASF expanding their formate portfolios while specialty fluid providers focus on application-specific formulation development and enhanced performance capabilities.
From 2030 to 2035, market dynamics shift toward advanced environmental integration and global winter maintenance expansion, with growth continuing from USD 973.2 million to USD 1,204 million, adding USD 225.4 million or 55% of total expansion. This phase transition centers on biodegradable de-icing systems, integration with smart winter maintenance networks, and deployment across diverse municipal and industrial scenarios, becoming standard rather than specialized applications. The competitive environment matures with focus shifting from basic chemical capability to comprehensive sustainability optimization systems and integration with carbon footprint tracking platforms.
At-a-Glance Metrics
| Metric | Value |
|---|---|
| Market Value (2025) | USD 790.3 million |
| Market Forecast (2035) | USD 1,204 million |
| Growth Rate | 4.3% CAGR |
| Leading Technology | Liquid Form |
| Primary Application | Drilling Fluids Segment |
The market demonstrates strong fundamentals with liquid form systems capturing a dominant share through handling convenience and drilling fluid optimization capabilities. Drilling fluids applications drive primary demand, supported by increasing offshore HPHT development and clear brine completion technology requirements. Geographic expansion remains concentrated in developed markets with established oilfield service infrastructure, while emerging economies show accelerating adoption rates driven by deepwater exploration expansion and rising winter maintenance standards.
Market expansion rests on three fundamental shifts driving adoption across oil and gas and municipal services sectors. First, HPHT well completion demand creates compelling operational advantages through potassium formate clear brines that provide immediate wellbore stability without formation damage, enabling operators to meet reservoir protection standards while maintaining drilling productivity and reducing non-productive time. Second, airport and municipal de-icing modernization accelerates as facilities worldwide seek environmentally responsible chemicals that complement traditional chloride-based systems, enabling effective ice melting and corrosion reduction that align with infrastructure protection standards and aquatic toxicity regulations.
Third, industrial thermal management enhancement drives adoption from district heating systems and HVAC facilities requiring effective heat transfer fluids that minimize corrosion while maintaining operational reliability during low-temperature operations and freeze protection scenarios. However, growth faces headwinds from raw material cost challenges that vary across formic acid suppliers regarding feedstock availability, which may limit adoption in cost-sensitive applications. Competition from alternative chemistries also persists regarding acetate-based de-icers and conventional calcium chloride systems that may offer lower costs in certain applications, affecting market penetration and pricing dynamics.
The potassium formate market represents a specialized chemical opportunity driven by expanding offshore oil development, environmental winter maintenance requirements, and industrial thermal fluid modernization. As oil operators seek formation-compatible completion fluids, municipalities require biodegradable de-icers, and industrial facilities demand non-corrosive heat transfer media, potassium formate is evolving from niche specialty chemical to strategic material ensuring operational safety and environmental compliance.
The market's growth trajectory from USD 790.3 million in 2025 to USD 1,204 million by 2035 at a 4.3% CAGR reflects fundamental shifts in drilling technology and environmental stewardship. Geographic expansion opportunities are pronounced in offshore regions and cold-climate markets, while the dominance of liquid form (63.0% market share) and drilling fluids applications (47.0% share) provides clear strategic focus areas.
Strengthening the dominant liquid form segment (63.0% market share) through enhanced handling systems, optimized concentration specifications, and integration with diverse drilling, de-icing, and heat transfer infrastructure. This pathway focuses on logistics optimization, storage system compatibility, pumping equipment integration, and application-ready formulations reducing customer dilution requirements. Market leadership consolidation through supply chain efficiency and technical service enables competitive positioning while defending advantages against solid form alternatives. Expected revenue pool: USD 30-42 million
Rapid offshore and HPHT drilling growth (47.0% application share) creates substantial opportunities through high-density clear brine systems, wellbore stability optimization, and formation damage prevention. Growing deepwater development, subsea well completions, and sensitive reservoir drilling drive sustained demand for non-damaging completion fluids. Specialized technical service and on-site blending capabilities enable premium positioning for offshore drilling fluid applications. Expected revenue pool: USD 26-38 million
Strategic expansion within de-icing segment (33.0% application share) requires biodegradable formulations, low-corrosion specifications, and comprehensive environmental documentation addressing airport runway safety, municipal roadway maintenance, and infrastructure protection. This pathway encompasses spray application systems, pre-wetting technologies, and anti-icing programs for proactive winter maintenance. Premium positioning reflects environmental advantages over chloride-based systems and comprehensive safety data. Expected revenue pool: USD 22-32 million
Expansion across Europe (30.5% of global market) through North Sea drilling operations, widespread de-icing adoption, and district heating applications. Growing offshore completion activity in UK and Norway, airport winter maintenance across Germany and Netherlands, and industrial HTF applications drive sustained demand. Regional manufacturing and logistics optimization reduce delivery costs while supporting responsive technical service. Expected revenue pool: USD 18-26 million
Development within HTF applications (14.0% share) addressing district heating requirements, industrial refrigeration systems, and process cooling demanding low-temperature performance and corrosion inhibition. This pathway encompasses thermal stability optimization, freeze point depression, and system compatibility for closed-loop thermal management. Premium pricing reflects specialized performance requirements and comprehensive technical support for industrial thermal applications. Expected revenue pool: USD 14-20 million
Expansion in United States (4.4% CAGR) and Canada (4.5% CAGR) through shale completion fluids, municipal de-icing programs, and oil sands operations. Growing HPHT horizontal well completions, airport winter maintenance adoption, and harsh-climate industrial applications drive demand. Domestic production and supply chain localization support competitive positioning in North American energy and municipal markets. Expected revenue pool: USD 12-18 million
Development of low-carbon potassium formate through bio-based formic acid feedstocks, renewable energy-powered production, and comprehensive sustainability certification. This pathway encompasses ISCC PLUS certification, carbon footprint optimization, and circular economy principles for sustainable chemical manufacturing. Technology differentiation through environmental leadership enables access to sustainability-focused procurement programs supporting corporate ESG objectives across oil and gas, aviation, and municipal customer segments. Expected revenue pool: USD 10-15 million
Primary Classification: The market segments by form into Liquid and Solid categories, representing the evolution from traditional crystalline products to convenient liquid solutions for comprehensive application optimization.
Secondary Classification: Application segmentation divides the market into Drilling Fluids, De-icing, Heat Transfer Fluids, and Others sectors, reflecting distinct requirements for chemical performance, handling characteristics, and operational standards.
Tertiary Classification: End-use industry segmentation covers Oil &Gas, Airports &Municipal Services, Industrial HVAC/Refrigeration, and Chemicals &Other Process Industries, addressing specific sector requirements and application characteristics.
Regional Classification: Geographic distribution spans Europe, North America, Middle East, Asia Pacific, and other regions, with developed markets leading adoption while emerging economies show accelerating growth patterns driven by energy development and infrastructure modernization programs.
The segmentation structure reveals technology progression from solid crystalline formate toward ready-to-use liquid formulations with enhanced handling capabilities, while application diversity spans from specialized offshore drilling to mass-market winter maintenance requiring cost-effective ice control solutions.
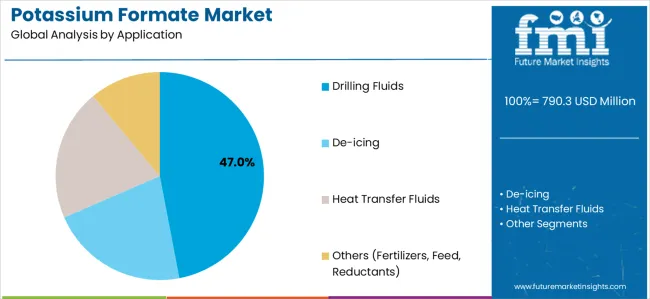
Market Context: Drilling fluids applications dominate the Potassium Formate market with approximately 47.0% market share due to widespread adoption in offshore operations and increasing focus on HPHT well completions, clear brine fluid optimization, and formation damage prevention applications that minimize reservoir impairment while maintaining wellbore stability during drilling and completion operations.
Appeal Factors: Oil and gas operators prioritize formation compatibility, wellbore stability, and integration with existing completion infrastructure that enables coordinated operations across drilling, completion, and production phases. The segment benefits from substantial offshore development investment and HPHT drilling programs that emphasize clear brine systems for sensitive reservoir protection and non-damaging completion fluid applications.
Growth Drivers: Deepwater exploration expansion programs incorporate potassium formate as essential high-density clear brine for wellbore stability, while subsea well development increases demand for formation-compatible capabilities that comply with reservoir protection standards and minimize productivity impairment.
Market Challenges: Volatile oil prices and cyclical drilling activity may create demand fluctuations affecting long-term supply contract stability.
Application dynamics include:
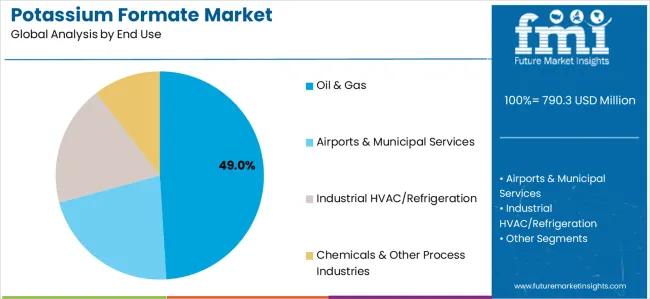
Market Context: Oil &gas end-use applications lead with approximately 49.0% market share driven by offshore drilling operations, HPHT well completions, and subsea development projects that emphasize formation-compatible completion fluids ensuring wellbore stability and reservoir protection in deepwater and high-pressure high-temperature drilling environments worldwide.
Appeal Factors: Drilling contractors and operating companies prioritize clear brine performance, environmental compliance, and technical support for completion fluid systems critical to well productivity and formation protection. The segment benefits from substantial offshore capital expenditure and deepwater development programs driving sustained demand for high-density formate-based drilling fluid systems.
Growth Drivers: Offshore exploration expansion creates sustained demand for potassium formate clear brines, while subsea well development and HPHT reservoir exploitation provide diversified consumption channels supporting market growth in energy sector applications.
Market Challenges: Oil price volatility and cyclical exploration spending may create periodic demand fluctuations requiring flexible supply chain management.
End-use dynamics include:
Growth Accelerators: Offshore oil and gas development drives primary adoption as potassium formate clear brines provide HPHT wellbore stability that enables operators to meet formation damage prevention standards without excessive non-productive time, supporting deepwater drilling operations and subsea missions that require high-density completion fluid systems protecting sensitive reservoir formations. Environmental winter maintenance modernization accelerates market expansion as airports and municipalities seek biodegradable de-icing chemicals that minimize infrastructure corrosion while maintaining ice control effectiveness during runway safety and roadway maintenance operations addressing aquatic toxicity concerns and environmental protection regulations. Industrial thermal management spending increases worldwide, creating sustained demand for heat transfer fluids that complement district heating systems and provide operational reliability in low-temperature process cooling and freeze protection applications requiring non-corrosive thermal media.
Growth Inhibitors: Raw material cost challenges vary across formic acid suppliers regarding production economics and feedstock availability, which may limit profitability and market penetration in price-sensitive applications facing competition from lower-cost chloride-based alternatives. Application-specific performance limitations persist regarding ice melting capacity at extreme cold temperatures and drilling fluid density constraints that may reduce effectiveness compared to cesium formate in ultra-HPHT applications exceeding 2.3 specific gravity requirements, affecting market positioning and competitive dynamics. Regional availability concerns create supply chain challenges in certain markets lacking domestic production, while alternative chemistries including potassium acetate for de-icing and synthetic-based heat transfer fluids provide competitive pressure across multiple application segments.
Market Evolution Patterns: Adoption accelerates in offshore drilling and premium airport sectors where formation protection and environmental compliance justify premium costs, with geographic concentration in North Sea and Gulf of Mexico transitioning toward mainstream adoption in municipal winter maintenance driven by environmental regulations and infrastructure protection requirements. Technology development focuses on bio-based formic acid integration, improved freeze point formulations, and enhanced corrosion inhibitor packages that optimize environmental performance and application effectiveness across drilling fluid, de-icing, and heat transfer applications. Sustainability certification programs gain prominence as customers demand comprehensive carbon footprint documentation and renewable feedstock content, while regulatory evolution toward biodegradable de-icers and environmentally acceptable drilling fluids supports market expansion. The market faces potential disruption if novel well completion technologies significantly reduce clear brine requirements or if climate change substantially alters winter weather patterns affecting de-icing demand, though potassium formate's unique combination of formation compatibility, environmental biodegradability, and multi-application versatility continues to support market growth across diverse oil and gas, municipal, and industrial customer segments where operational performance, environmental responsibility, and infrastructure protection represent paramount considerations driving chemical selection across global markets despite ongoing competitive pressure from alternative chemistries and economic headwinds affecting drilling activity and municipal budgets.
The Potassium Formate market demonstrates varied regional dynamics with Growth Leaders including the United Kingdom (4.8% CAGR) and Norway (4.7% CAGR) driving expansion through North Sea drilling operations and Arctic de-icing requirements. Steady Performers encompass Canada (4.5% CAGR), and the United States (4.4% CAGR), benefiting from established oilfield services and municipal winter maintenance adoption. Emerging Markets feature Saudi Arabia (4.2% CAGR) and China (4.0% CAGR), where energy development and winter infrastructure programs support consistent growth patterns.
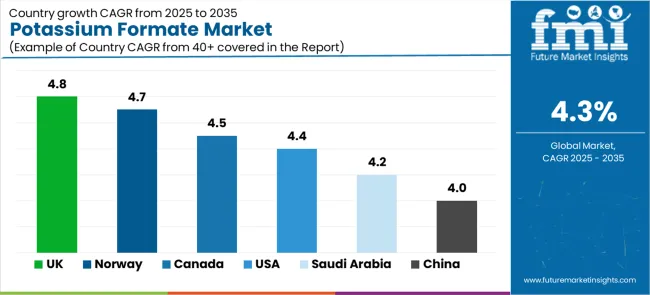
| Country | CAGR (2025-2035) |
|---|---|
| United Kingdom | 4.8% |
| Norway | 4.7% |
| Canada | 4.5% |
| United States | 4.4% |
| Saudi Arabia | 4.2% |
| China | 4.0% |
Regional synthesis reveals European markets leading adoption through offshore North Sea drilling operations and widespread environmental de-icing programs, while North American countries maintain steady expansion supported by shale completion activity and municipal winter service modernization. Emerging energy markets show accelerating growth driven by deep sour-gas development and winter maintenance infrastructure investments.
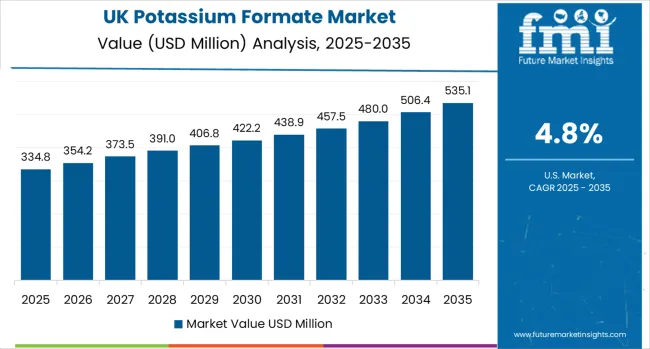
The United Kingdom demonstrates strongest European growth at 4.8% CAGR, driven by sustained North Sea workover and completion operations, regional airport de-icing standards adoption, and offshore oil and gas activity supporting potassium formate clear brine demand across Scottish and English operational bases. Mature offshore fields require frequent well interventions utilizing high-density formate brines for formation protection, while aviation sector emphasis on environmentally responsible runway de-icing creates sustained municipal demand. Brexit regulatory independence enables UK-specific environmental standards favoring biodegradable de-icing chemicals.
Offshore drilling and completion activity drives primary demand as operators utilize potassium formate for through-tubing workovers, sidetrack drilling, and HPHT well completions protecting North Sea reservoir formations. Airport winter maintenance expansion supports additional consumption channels through major hub facilities including Heathrow, Gatwick, and Manchester implementing formate-based runway de-icing programs. Market expansion benefits from established oilfield service infrastructure and comprehensive environmental regulations supporting biodegradable chemical adoption across aviation and energy sectors.
Strategic Market Indicators:
Norway maintains strong expansion at 4.7% CAGR through offshore HPHT wells utilizing clear formate brines, Arctic climate driving comprehensive de-icing demand, and sustainable chemical procurement policies supporting environmentally responsible formulations across Stavanger, Bergen, and Oslo regions. Norwegian continental shelf development emphasizes advanced completion fluid systems for sensitive reservoir protection, while severe winter conditions create sustained airport and municipal de-icing requirements. Government sustainability mandates favor biodegradable chemicals over traditional chloride-based alternatives.
Offshore energy operations drive primary consumption as international oil companies operating on Norwegian continental shelf specify potassium formate for HPHT completions, subsea workovers, and drilling operations requiring high-density clear brines. Winter maintenance applications expand through Oslo Airport, Bergen facilities, and municipal road networks implementing formate-based de-icing programs. Market benefits from Norwegian commitment to environmental protection and willingness to adopt premium chemical solutions supporting operational excellence and sustainability objectives.
Market Intelligence Brief:
Canada demonstrates robust growth at 4.5% CAGR through oil sands operations requiring specialized drilling fluids, Arctic infrastructure supporting comprehensive winter maintenance, and municipal shift toward low-corrosion de-icers across Alberta, Ontario, and British Columbia regions. Western Canadian oil and gas activity drives drilling fluid demand, while severe winter climate creates sustained airport and roadway de-icing requirements. Municipalities increasingly adopt potassium formate for infrastructure protection and environmental compliance supporting reduced chloride loading in freshwater ecosystems.
Energy sector consumption supports primary demand through oil sands drilling operations, conventional well completions, and HPHT resource development requiring formation-compatible completion fluids. Municipal applications expand through major airport facilities including Toronto Pearson, Vancouver, and Calgary implementing formate-based runway de-icing, while roadway maintenance programs transition toward biodegradable alternatives. Market benefits from domestic production capacity and established distribution infrastructure supporting both energy and municipal customer segments.
Performance Metrics:
The USA market maintains steady growth at 4.4% CAGR through shale HPHT completion fluids, airport runway de-icing adoption, and roadway winter maintenance across Texas, Pennsylvania, and northern states. Deepwater Gulf of Mexico operations and horizontal shale well completions drive drilling fluid demand, while aviation sector modernization and municipal environmental compliance support de-icing applications. Domestic production capacity provides supply security for growing energy and municipal markets.
Technology deployment channels include oilfield service companies supplying completion fluids for offshore and shale drilling, airport authorities implementing formate-based runway de-icing programs, and municipal transportation departments adopting environmentally responsible roadway ice control. Market development benefits from established chemical manufacturing infrastructure and comprehensive distribution networks supporting diverse customer requirements across energy, aviation, and municipal sectors.
Performance Metrics:
Saudi Arabia demonstrates strategic growth at 4.2% CAGR through advanced deep sour-gas drilling operations, carbonate reservoir completion programs, and industrial chemical processing expansion across Ghawar, Jafurah, and petrochemical complexes. National oil company mega-projects and high-pressure gas field developments drive clear brine drilling fluid demand, while Vision 2030 industrial diversification initiatives and downstream chemical manufacturing growth support process chemical applications. Domestic production capabilities and regional supply infrastructure provide strategic supply security for expanding energy and industrial markets.
Technology deployment channels include national oil company service divisions supplying completion fluids for carbonate reservoir drilling and sour-gas field development, petrochemical facilities implementing process chemicals for manufacturing operations, and industrial parks adopting specialty chemical systems.
Performance Metrics:
China maintains substantial growth at 4.0% CAGR through extensive winter roadway maintenance programs, northern infrastructure de-icing operations, and selective oilfield completion applications across Beijing-Tianjin-Hebei region, Northeast provinces, and tight formation developments. Government environmental protection mandates and transportation safety modernization initiatives drive biodegradable de-icer adoption, while domestic oil and gas operators integrate formate-based completion fluids for unconventional reservoir development and sensitive formation protection. Domestic chemical manufacturing capacity provides comprehensive supply infrastructure for expanding municipal and energy markets.
Technology deployment channels include provincial transportation departments implementing environmentally compliant roadway de-icing programs for winter maintenance, municipal authorities adopting advanced ice control systems for urban infrastructure safety, and state-owned oil companies evaluating clear brine fluids for tight oil and gas completions.
Performance Metrics:
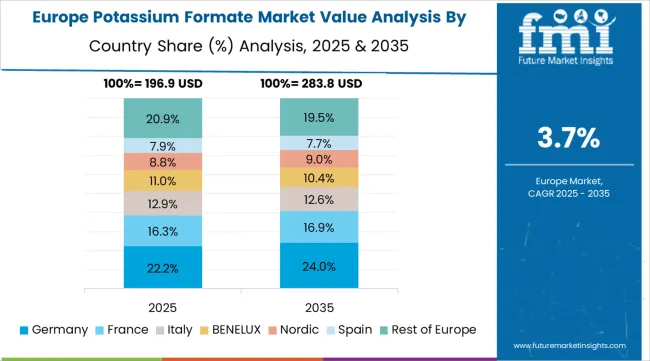
The European Potassium Formate market represents approximately 30.5% of global market value in 2025, valued at USD 241.0 million. Germany is expected to maintain its leadership position with an 18.0% market share, valued at USD 43.4 million, supported by comprehensive airport de-icing programs, district heating HTF applications, and selective North Sea drilling supply chain activities across major urban centers including Frankfurt, Munich, and Hamburg airports plus industrial thermal networks.
The United Kingdom follows with a 16.0% share at USD 38.6 million, driven by sustained North Sea drilling operations and regional airport de-icing standards implementation. Norway holds a 14.0% share valued at USD 33.7 million through offshore HPHT drilling activities and comprehensive Arctic winter maintenance programs. The Netherlands maintains an 11.0% share at USD 26.5 million through North Sea supply base operations and Schiphol airport de-icing requirements. France holds an 11.0% share valued at USD 26.5 million through district heating applications and selective aviation de-icing adoption. Italy commands a 10.0% share at USD 24.1 million through northern airport winter services and industrial applications. Poland accounts for 8.0% share valued at USD 19.3 million through expanding municipal winter maintenance and selective industrial uses. Rest of Europe (including Austria, Switzerland, Belgium, and other countries) is anticipated to hold 12.0% share at USD 28.9 million, reflecting steady adoption driven by environmental de-icing regulations and niche industrial applications.
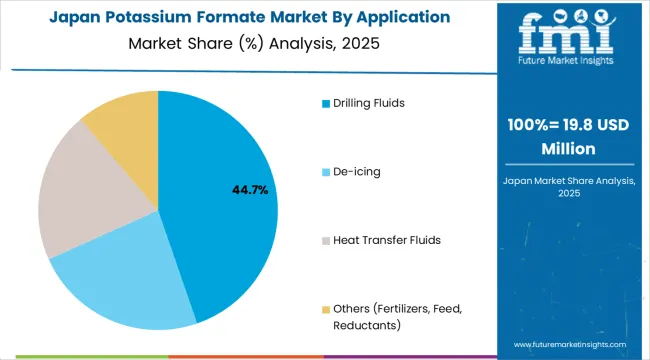
In Japan, the Potassium Formate market prioritizes liquid form systems, which capture the dominant share of industrial applications due to handling convenience and seamless integration with existing heat transfer and process chemical infrastructure. Japanese industrial facilities emphasize operational efficiency, handling safety, and process integration, creating demand for liquid potassium formate that provides ready-to-use formulations and simplified logistics based on application requirements. Solid form maintains limited positions primarily in specialty chemical synthesis and research applications where precise gravimetric dosing meets specific process requirements without requiring extensive handling infrastructure.
Market Characteristics:
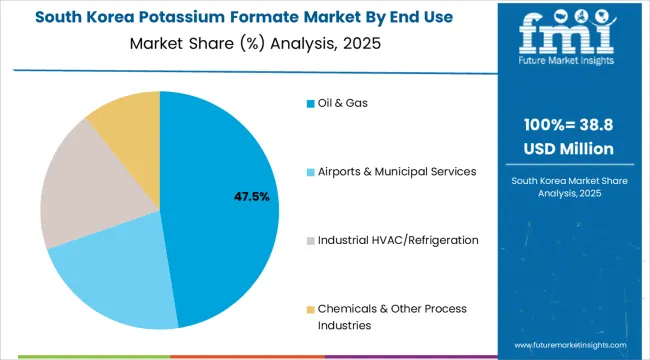
In South Korea, the market structure favors established chemical distributors and international suppliers including Perstorp Holding AB, BASF SE, and specialty chemical companies, which maintain positions through comprehensive product portfolios and technical service capabilities supporting industrial heat transfer and specialty chemical applications. These providers offer integrated solutions combining potassium formate supply with application support and technical documentation appealing to Korean industrial customers seeking reliable specialty chemical sources. Local distributors capture market share by providing responsive service capabilities and competitive pricing for standard industrial applications, while international suppliers focus on premium-grade material and comprehensive technical support tailored to Korean industrial manufacturing characteristics.
Channel Insights:
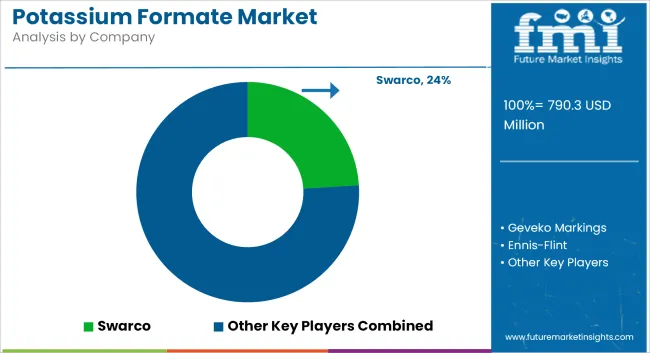
The Potassium Formate market operates with moderate concentration, featuring approximately 10-14 meaningful participants, where leading companies control roughly 46-52% of the global market share through established oil and gas industry relationships and comprehensive chemical portfolios. Competition emphasizes production reliability, technical service quality, and logistics capabilities rather than price-based rivalry alone. The leading company, Perstorp Holding AB, commands approximately 15.0% market share through its extensive formate chemicals portfolio and global oilfield services presence plus sustainability certification programs.
Market Leaders encompass Perstorp Holding AB, BASF SE, and TETRA Technologies, Inc., which maintain competitive advantages through integrated formic acid production, global distribution networks, and comprehensive technical support capabilities that create customer relationships and support long-term supply agreements. These companies leverage decades of specialty chemicals experience and ongoing sustainability investments to develop certified low-carbon formate products with comprehensive application support.
Technology Innovators include ADDCON GmbH, Clariant AG, and Hawkins, Inc., which compete through specialized application development and responsive customer service appealing to customers seeking tailored formulations and flexible supply arrangements. These companies differentiate through rapid product customization and specialized drilling fluid or de-icing application focus.
Regional Specialists feature companies like Dynalene, Inc., Eastman Chemical Company, ESSECO UK, and Boryszew S.A., which focus on specific geographic markets and specialized applications including heat transfer fluids and regional de-icing supply. Market dynamics favor participants that combine reliable chemical production with comprehensive logistics capabilities including bulk storage, blending services, and emergency supply response for critical drilling operations or severe winter weather events.
| Item | Value |
|---|---|
| Quantitative Units | USD 790.3 million |
| Form | Liquid, Solid |
| Application | Drilling Fluids, De-icing, Heat Transfer Fluids, Others (Fertilizers, Feed, Reductants) |
| End Use | Oil &Gas, Airports &Municipal Services, Industrial HVAC/Refrigeration, Chemicals &Other Process Industries |
| Regions Covered | Europe, North America, Middle East &Africa, Asia Pacific, Latin America |
| Countries Covered | United Kingdom, Norway, United States, Canada, Saudi Arabia, China, Germany, and 25+ additional countries |
| Key Companies Profiled | Perstorp Holding AB, BASF SE, TETRA Technologies, Inc., ADDCON GmbH, Clariant AG, Hawkins, Inc., Dynalene, Inc. |
| Additional Attributes | Dollar sales by form and application categories, regional adoption trends across Europe, North America, and Middle East, competitive landscape with specialty chemical manufacturers and oilfield service providers, customer preferences for formation compatibility and environmental compliance, integration with drilling fluid systems and winter maintenance platforms, innovations in bio-based feedstock production and sustainability certification, and development of specialized formulations with enhanced performance and reduced environmental impact capabilities. |
The global potassium formate market is estimated to be valued at USD 790.3 million in 2025.
The market size for the potassium formate market is projected to reach USD 1,204.0 million by 2035.
The potassium formate market is expected to grow at a 4.3% CAGR between 2025 and 2035.
The key product types in potassium formate market are drilling fluids, de-icing, heat transfer fluids and others (fertilizers, feed, reductants).
In terms of end use, oil & gas segment to command 49.0% share in the potassium formate market in 2025.


Our Research Products

The "Full Research Suite" delivers actionable market intel, deep dives on markets or technologies, so clients act faster, cut risk, and unlock growth.

The Leaderboard benchmarks and ranks top vendors, classifying them as Established Leaders, Leading Challengers, or Disruptors & Challengers.

Locates where complements amplify value and substitutes erode it, forecasting net impact by horizon

We deliver granular, decision-grade intel: market sizing, 5-year forecasts, pricing, adoption, usage, revenue, and operational KPIs—plus competitor tracking, regulation, and value chains—across 60 countries broadly.

Spot the shifts before they hit your P&L. We track inflection points, adoption curves, pricing moves, and ecosystem plays to show where demand is heading, why it is changing, and what to do next across high-growth markets and disruptive tech

Real-time reads of user behavior. We track shifting priorities, perceptions of today’s and next-gen services, and provider experience, then pace how fast tech moves from trial to adoption, blending buyer, consumer, and channel inputs with social signals (#WhySwitch, #UX).

Partner with our analyst team to build a custom report designed around your business priorities. From analysing market trends to assessing competitors or crafting bespoke datasets, we tailor insights to your needs.
Supplier Intelligence
Discovery & Profiling
Capacity & Footprint
Performance & Risk
Compliance & Governance
Commercial Readiness
Who Supplies Whom
Scorecards & Shortlists
Playbooks & Docs
Category Intelligence
Definition & Scope
Demand & Use Cases
Cost Drivers
Market Structure
Supply Chain Map
Trade & Policy
Operating Norms
Deliverables
Buyer Intelligence
Account Basics
Spend & Scope
Procurement Model
Vendor Requirements
Terms & Policies
Entry Strategy
Pain Points & Triggers
Outputs
Pricing Analysis
Benchmarks
Trends
Should-Cost
Indexation
Landed Cost
Commercial Terms
Deliverables
Brand Analysis
Positioning & Value Prop
Share & Presence
Customer Evidence
Go-to-Market
Digital & Reputation
Compliance & Trust
KPIs & Gaps
Outputs
Full Research Suite comprises of:
Market outlook & trends analysis
Interviews & case studies
Strategic recommendations
Vendor profiles & capabilities analysis
5-year forecasts
8 regions and 60+ country-level data splits
Market segment data splits
12 months of continuous data updates
DELIVERED AS:
PDF EXCEL ONLINE
Potassium Formate Industry Analysis in North America - Size, Share & Forecast 2025 to 2035
Potassium Fluoride Market Size and Share Forecast Outlook 2025 to 2035
Potassium Sulfate Market Size and Share Forecast Outlook 2025 to 2035
Potassium Tetrafluoroborate Market Size and Share Forecast Outlook 2025 to 2035
Potassium Fluoborate Market Size and Share Forecast Outlook 2025 to 2035
Potassium Propionate Market Size and Share Forecast Outlook 2025 to 2035
Potassium Acetate Market Size and Share Forecast Outlook 2025 to 2035
Potassium Citrate Market Growth - Trends & Forecast 2025 to 2035
Potassium Carbonate Market Growth – Trends & Forecast 2025 to 2035
Potassium Sorbate Market Analysis by Product Type, Application and Region from 2025 to 2035
Potassium Hydrogen Fluoride Market Growth - Trends & Forecast 2025 to 2035
Potassium Chloride Market Growth - Trends & Forecast 2025 to 2035
Potassium Humate Market Growth – Trends & Forecast 2025 to 2035
Potassium Zirconium Fluoride Market
Potassium Cryolite Market
Formate Brines Market
Potassium Alum Market
Potassium Hydrogen Sulphite Market
Dipotassium Guanylate Market Size and Share Forecast Outlook 2025 to 2035
Sodium Formate Market Size and Share Forecast Outlook 2025 to 2035

Thank you!
You will receive an email from our Business Development Manager. Please be sure to check your SPAM/JUNK folder too.
Chat With
MaRIA