Reports

- Global Locations -

Headquarters

Future Market Insights, Inc.

Christiana Corporate, 200
Continental Drive, Suite 401,
Newark, Delaware - 19713,
United States

T: +1-845-579-5705

Americas

Future Market Insights, Inc.

616 Corporate Way, Suite 2-9018,
Valley Cottage, NY 10989, United States

T: +1-347-918-3531

MEA

Future Market Insights

1602-6 Jumeirah Bay X2 Tower, Plot No: JLT-PH2-X2A,
Jumeirah Lakes Towers, Dubai,
United Arab Emirates

Europe

Future Market Insights

3rd Floor, 207 Regent Street,
W1B 3HH London
United Kingdom

T: + 44 (0) 20 8123 9659
D: +44 (0) 20 3287 4268

Asia Pacific

Future Market Insights

IndiaLand Global Tech Park, Unit UG-1, Behind Grand HighStreet, Phase 1, Hinjawadi, MH, Pune – 411057, India

Potassium Fluoborate Market Outlook (2022 to 2032)

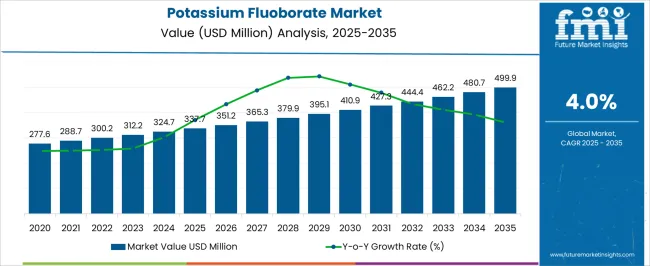
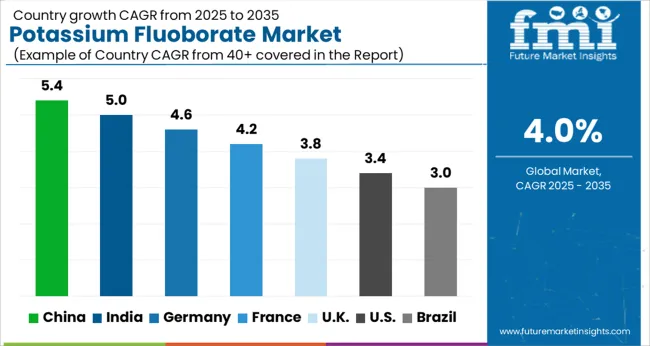
The potassium fluoborate market is to reach a value of US$ 296.7 million by the year 2022. Sales of potassium fluoborate are expected to expand CAGR of 4.0% and top a valuation of US$ 439.2 million by 2032. Potassium fluoborate is extensively used in the metallurgy of aluminum and also used in soldering agents and abrasives applications.

Rising demand for machinery in industrial sectors such as automotive, oil & gas, petrochemicals & others, is expected to boost the demand for abrasives, propelling the sales of potassium fluoborate. They are frequently employed for optical deposition as well as for alloy metal.

It is possible to manufacture some fluoride compounds at the nanoscale and in extremely pure forms. Both optical quality and utility as per scientific standards are improved by ultra-high purity and high purity compositions. Potassium fluoborate finds a variety of applications such as soldering agents, abrasives, fluxing agents & others.

Due to its widespread usage, the market is expected to grow at a substantial growth rate during the forecast period. Potassium Fluoborate is scantly soluble in water, which makes it suitable for using it in oxygen-sensitive applications, such as metal production. It is also being employed in medical applications but at very low doses.

The rise in global demand for abrasives is one of the key reasons driving the expansion of the potassium fluoroborate market. Abrasives are the material, which is used to finish or shape a workpiece through rubbing and are extensively utilized in industries. These are used for polishing, cutting, drilling, grinding & others.

Abrasives are quite popular for polishing objects which are further used in automotive parts, electronics & electrical equipment, heavy types of machinery, and others. The potassium fluoroborate market benefits from the development of end-use industries, rapid urbanization and industrialization, high investments, and research & development activities. Potassium fluoborate is also used in the manufacturing of other fluoride chemicals, which are used in agrochemicals, pharma products & others.

Furthermore, its use as a catalyst for numerous reactions in the chemical industry, such as alkylation, polymerization, and isomerization, provides profitable potential to market participants during the projection period.

Attributes Key Insights
Potassium Fluoborate Market Sales (2021A) US$ 286.7 million
Estimated Market Size (2022E) US$ 296.7 million
Projected Market Value (2032F) US$ 439.2 million
Value CAGR (2022 to 2032) 4.0%
Collective Value Share: Top 3 Countries (2022E) 45.3%

Don't pay for what you don't need

Customize your report by selecting specific countries or regions and save 30%!

2017 to 2021 Potassium Fluoborate Market Outlook Compared to 2022 to 2032 Forecast

The potassium fluoborate market witnessed a CAGR of 3.5% over the historical period of 2017 to 2021. The market shrank as a result of the 2020 pandemic crisis, which was reflected in material pricing, varying needs for chemicals and specialty materials, altered consumer expectations for chemical products, and increased logistical expenses. Each of these variables had a negative impact on the market during the initial quarters.

As per the current estimate, the potassium fluoborate market is poised to grow at around a CAGR of 4.0% for the period between 2022 and 2032. The growing demand for potassium fluoborate & fluoride compounds in industries for different functions is expected to boost the market.

Metallurgy, automotive, and oil & gas are some of the key industries for potassium fluoborate, hence the growth of these industries has a direct impact on the market. On the back of these factors, the demand in the market is projected to surge by 1.5x between 2022 and 2032.

Country-wise Insights

How will the Demand for Potassium Fluoborate Surge in the USA?

Increasing Application as Soldering Agent to Spur the Sales in the USA

On the back of increasing application in diverse industries, the availability of raw resources, and a superior industrial environment, the USA is anticipated to dominate the North American region.

The USA is anticipated to have a significant share owing to its extensive and diverse industrial base and continuous petrochemical and gas & oil infrastructure development. The growth of the country is being influenced by the application of fluxing agents, soldering agents, and abrasives are used up to large extent.

Potassium fluoborate is employed as an active filler in the formation of resin-bonded abrasives, and as a component in the manufacture of grinding wheels. Also, abrasive discs to lower operating temperatures, and it provides a variety of sharp cutting tools, all of which contribute to the expansion of the domestic industry.

What will be the Sales Outlook of Potassium Fluoborate in China?

China to be the Manufacturing Hub for Potassium Fluoborate Companies

China is knowns as a manufacturing hub as it has a strong manufacturing base and the presence of numerous manufacturers. Increasing demand for the metal from industries & metal processing is primarily driving the market.

China also has a strong automobile industry, which is a key industry for the potassium fluoborate. The growing use of aluminum metal bodies in automobiles, which are safer to use than steel equivalents and make up half the weight of the average car, may promote the expansion of the potassium fluoborate. Aluminum is being used in automotive parts, railways, and planes in their components. Potassium fluoborate is used as an agent in the refining of aluminum.

Additionally, China has an evident chemical industry and it supplies various chemicals to other regions. Potassium fluoborate finds application in the chemical industry as it is used in the production of agrochemicals such as ammonium fluoride, sodium fluoride & others. It is also used as a precursor in producing electrolytes, which are a crucial part of lithium-ion batteries.

Nikhil Kaitwade
Nikhil Kaitwade

Principal Consultant

Talk to Analyst

Find your sweet spots for generating winning opportunities in this market.

Category-wise Insights

Which Purity Type of Potassium Fluoborate will Gain Traction?

99% Purity Potassium Fluoborate is the Most Preferred among Manufacturers

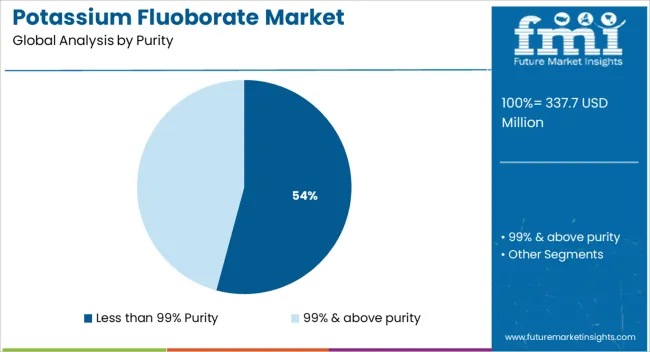
Potassium fluoborate is majorly available in 2 purities, such as one is less than 99% and another is more than 99% purity. Oxygen-sensitive applications such as metal alloy production like titanium, boron & aluminum, require potassium fluoborate. In oxygen-sensitive applications, less than 99% purity potassium fluoborate is used. It is a potassium source and partially soluble in water. It is used as a fluxing agent in the production of boron alloys using magnesium & aluminum casting as it is not soluble in water.

Growing demand for electronics, heating, and air conditioning to establish a long-lasting connection between electrical components may increase the demand. This is utilized as a fluxing agent for soldering, which enhances the mechanical strength and electrical contact in solder joints.

Which is the Leading Application of Potassium Fluoborate?

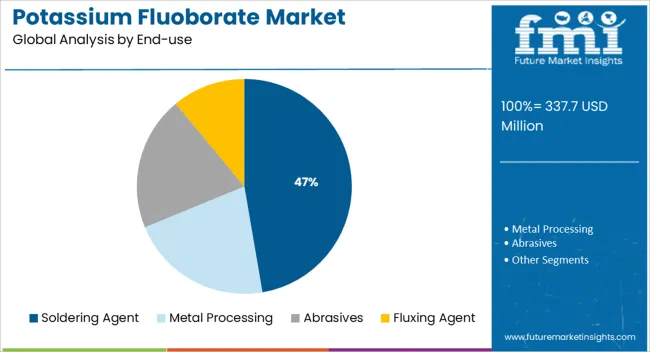
Application in Metal Fabrication and Automobile to Generate Maximum Revenue

Due to its widespread use in several applications across numerous industries, the global market for potassium fluoroborate is expected to grow. Fluoride compounds are frequently employed in alloying metal and optical deposition applications, both of which contribute to the expansion of the worldwide potassium fluoroborate market.

The global potassium fluoroborate market is gaining traction as a result of the rising demand for abrasives in various grinding and polishing applications for sectors like electronic & electrical equipment, metal fabrication, automobile, and machinery. The market for abrasives is growing quickly, and this growth is strongly correlated with the demand for potassium fluoroborate.
Competitive Landscape

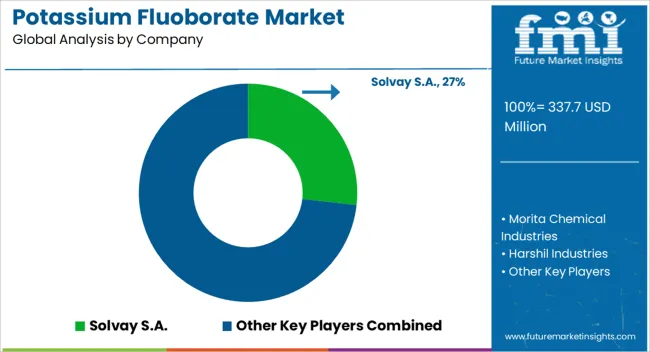
The market is expected to be consolidated with the presence of several dominant key players. These players are expected to hold more than 50% of the market share. Some of the prominent key trends are an expansion of production capacities and the adoption of new & modified manufacturing techniques.

Manufacturers are focusing on the launch of a new product line in purity form, as well as continued research and development to expand their product portfolio. Furthermore, industrial participants are focusing on developing manufacturing units in order to increase the core business.

Get the data you need at a Fraction of the cost

Personalize your report by choosing insights you need
and save 40%!

Scope of Report

Attribute Details
Estimated Market Size (2022E) US$ 296.7 million
Projected Market Value (2032F) US$ 439.2 million
Value CAGR (2022 to 2032) 4.0%
Forecast Period 2022 to 2032
Historical Data Available for 2017 to 2021
Market Analysis US$ Million for Value and Kilo Tons for Volume
Key Countries Covered The USA, Canada, Brazil, Mexico, Germany, Italy, France, The United Kingdom, Spain, BENELUX, Russia, China, Japan, South Korea, India, ASEAN, Australia and New Zealand, GCC Countries, Turkey, Northern Africa, South Africa
Key Segments Covered Purity, Grade, Application, and Region
Key Companies Profiled
  • Solvay S.A.
  • Morita Chemical Industries
  • Harshil Industries
  • Honeywell Fine Chemicals
  • AMG Aluminum
  • Madras Fluorine Ltd.
  • Stella Chemifa Corporation
  • Triveni Chemicals
  • Skyline Chemicals
  • Foshan Nanhai Fluoride Chemical Co. Ltd
  • Derivados Del Flúor (DDF)
  • Hunan Merits New Materials Co. Ltd.
  • American Elements
  • PARTH INDUSTRIES
  • AWISHKAR CHEMICALS INDUSTRIES
  • S. B. CHEMICALS
  • FENGYUAN INDIA PRIVATE LIMITED
Report Coverage
  • Market Forecast, Company Share Analysis, Competition Intelligence, DROT Analysis, Market Dynamics and Challenges, and Strategic Growth Initiatives

Potassium Fluoborate Market Segmentation

By Purity:

  • Less than 99% Purity
  • 99% & above purity

By Grade:

  • Technical Grade
  • Reagent Grade

By End-use:

  • Soldering Agent
  • Metal Processing
  • Abrasives
  • Fluxing Agent

By Region:

  • North America
  • Latin America
  • Europe
  • East Asia
  • South Asia & Pacific
  • Middle East & Africa

Frequently Asked Questions

What is the current size of the global potassium fluoborate market?

The global market for potassium fluoborate is estimated to reach a valuation of US$ 296.7 million in 2022.

What is the demand outlook for potassium fluoborate in various industries?

The potassium fluoborate demand is anticipated to witness a growth rate of 4.0% over the forecast period of 2022 and 2032 in terms of value.

Who are the key players in the global market of potassium fluoborate?

Solvay S.A., Morita Chemical Industries, Harshil Industries, Honeywell Fine Chemicals, AMG Aluminum, Madras Fluorine Ltd., Stella Chemifa Corporation, Triveni Chemicals, Skyline Chemicals, American Elements, PARTH INDUSTRIES, Foshan Nanhai Fluoride Chemical Co. Ltd., Derivados Del Flúor (DDF) and others are identified as the key manufacturers in the potassium fluoborate market.

What is the estimated share of the key players in the potassium fluoborate market?

Key players in the global potassium fluoborate market are expected to account for about 50-55% of the overall market share.

Which are the key countries dominating the potassium fluoborate market?

The top countries driving the global potassium fluoborate demand are the USA, China, Germany, Japan, and India.

Table of Content

1. Executive Summary | Potassium Fluoborate Market 

    1.1. Global Market Outlook

    1.2. Demand Side Trends

    1.3. Supply Side Trends

    1.4. Technology Roadmap

    1.5. Analysis and Recommendations

2. Market Overview

    2.1. Market Coverage / Taxonomy

    2.2. Market Definition / Scope / Limitations

3. Key Market Trends

    3.1. Key Trends Impacting the Market

    3.2. Product Innovation / Development Trends

4. Key Success Factors

    4.1. Product Adoption / Usage Analysis

    4.2. Product USPs / Features

    4.3. Strategic Promotional Strategies

5. Global Market Demand Analysis 2017 to 2021 and Forecast, 2022 to 2032

    5.1. Historical Market Volume (KT) Analysis, 2017 to 2021

    5.2. Current and Future Market Volume (KT) Projections, 2022 to 2032

    5.3. Y-o-Y Growth Trend Analysis

6. Global Market - Pricing Analysis

    6.1. Regional Pricing Analysis

    6.2. Pricing Breakup

    6.3. Global Average Pricing Analysis Benchmark

7. Global Market Demand (in Value or Size in US$ million) Analysis 2017 to 2021 and Forecast, 2022 to 2032

    7.1. Historical Market Value (US$ million) Analysis, 2017 to 2021

    7.2. Current and Future Market Value (US$ million) Projections, 2022 to 2032

        7.2.1. Y-o-Y Growth Trend Analysis

        7.2.2. Absolute $ Opportunity Analysis

8. Market Background

    8.1. Macro-Economic Factors

        8.1.1. Global GDP Growth Outlook

        8.1.2. Global Chemical Industry Overview

        8.1.3. Global Oil and Gas Outlook

        8.1.4. Other Factors

    8.2. Forecast Factors - Relevance & Impact

        8.2.1. GDP Growth forecast

        8.2.2. Manufacturing Industry forecast

        8.2.3. Growth in Chemical Industry

        8.2.4. Demand from End-use Industries

        8.2.5. Other Forecast Factors

    8.3. Value Chain Analysis

        8.3.1. Raw Material Suppliers

        8.3.2. Product Manufacturers

        8.3.3. Product Distributors

        8.3.4. Probable End users

    8.4. COVID-19 Crisis - Impact Assessment

        8.4.1. Current Statistics

        8.4.2. Short-Mid-Long Term Outlook

        8.4.3. Likely Rebound

    8.5. Market Dynamics

        8.5.1. Drivers

        8.5.2. Restraints

        8.5.3. Opportunity Analysis

    8.6. Global Supply Demand Analysis

    8.7. Porter’s Five Forces Analysis

    8.8. Key Regulations and Certifications

9. Global Market Analysis 2017 to 2021 and Forecast 2022 to 2032, By Purity

    9.1. Introduction / Key Findings

    9.2. Historical Market Size (US$ million) and Volume Analysis By Purity, 2017 to 2021

    9.3. Current and Future Market Size (US$ million) and Volume Analysis and Forecast By Purity, 2022 to 2032

        9.3.1. Less than 99% Purity

        9.3.2. 99% & above purity

    9.4. Market Attractiveness Analysis By Purity

10. Global Market Analysis 2017 to 2021 and Forecast 2022 to 2032, By Grade

    10.1. Introduction / Key Findings

    10.2. Historical Market Size (US$ million) and Volume Analysis By Purity, 2017 to 2021

    10.3. Current and Future Market Size (US$ million) and Volume Analysis and Forecast By Grade, 2022 to 2032

        10.3.1. Technical Grade

        10.3.2. Reagent Grade

    10.4. Market Attractiveness Analysis By Grade

11. Global Market Analysis 2017 to 2021 and Forecast 2022 to 2032, by Application 

    11.1. Introduction / Key Findings

    11.2. Historical Market Size (US$ million) and Volume Analysis By Application, 2017 to 2021

    11.3. Current and Future Market Size (US$ million) and Volume Analysis and Forecast By Application, 2022 to 2032

        11.3.1. Soldering Agent

        11.3.2. Metal Processing

        11.3.3. Abrasives

        11.3.4. Fluxing Agent

    11.4. Market Attractiveness Analysis By Application

12. Global Market Analysis 2017 to 2021 and Forecast 2022 to 2032, by Region

    12.1. Introduction

    12.2. Historical Market Size (US$ million) and Volume Analysis By Region, 2017 to 2021

    12.3. Current Market Size (US$ million) and Volume Analysis and Forecast By Region, 2022 to 2032

        12.3.1. North America

        12.3.2. Latin America

        12.3.3. Europe

        12.3.4. Middle East and Africa (MEA)

        12.3.5. East Asia

        12.3.6. South Asia and Pacific

    12.4. Market Attractiveness Analysis By Region

13. North America Market Analysis 2017 to 2021 and Forecast 2022 to 2032

    13.1. Introduction

    13.2. Pricing Analysis

    13.3. Historical Market Size (US$ million) and Volume Trend Analysis By Market Taxonomy, 2017 to 2021

    13.4. Market Size (US$ million) and Volume Forecast By Market Taxonomy, 2022 to 2032

        13.4.1. By Country

            13.4.1.1. The USA

            13.4.1.2. Canada

        13.4.2. By Purity

        13.4.3. By Grade

        13.4.4. By Application

    13.5. Market Attractiveness Analysis

        13.5.1. By Country

        13.5.2. By Purity

        13.5.3. By Grade

        13.5.4. By Application

    13.6. Market Trends

    13.7. Drivers and Restraints - Impact Analysis

14. Latin America Market Analysis 2017 to 2021 and Forecast 2022 to 2032

    14.1. Introduction

    14.2. Pricing Analysis

    14.3. Historical Market Size (US$ million) and Volume Trend Analysis By Market Taxonomy, 2017 to 2021

    14.4. Market Size (US$ million) and Volume Forecast By Market Taxonomy, 2022 to 2032

        14.4.1. By Country

            14.4.1.1. Brazil

            14.4.1.2. Mexico

            14.4.1.3. Rest of Latin America

        14.4.2. By Purity

        14.4.3. By Grade

        14.4.4. By Application

    14.5. Market Attractiveness Analysis

        14.5.1. By Country

        14.5.2. By Purity

        14.5.3. By Grade

        14.5.4. By Application

    14.6. Market Trends

    14.7. Drivers and Restraints - Impact Analysis

15. Europe Market Analysis 2017 to 2021 and Forecast 2022 to 2032

    15.1. Introduction

    15.2. Pricing Analysis

    15.3. Historical Market Size (US$ million) and Volume Trend Analysis By Market Taxonomy, 2017 to 2021

    15.4. Market Size (US$ million) and Volume Forecast By Market Taxonomy, 2022 to 2032

        15.4.1. By Country

            15.4.1.1. Germany

            15.4.1.2. Italy

            15.4.1.3. France

            15.4.1.4. The United Kingdom

            15.4.1.5. Spain

            15.4.1.6. BENELUX

            15.4.1.7. Russia

            15.4.1.8. Rest of Europe

        15.4.2. By Purity

        15.4.3. By Grade

        15.4.4. By Application

    15.5. Market Attractiveness Analysis

        15.5.1. By Country

        15.5.2. By Purity

        15.5.3. By Grade

        15.5.4. By Application

    15.6. Market Trends

    15.7. Drivers and Restraints - Impact Analysis

16. South Asia and Pacific Market Analysis 2017 to 2021 and Forecast 2022 to 2032

    16.1. Introduction

    16.2. Pricing Analysis

    16.3. Historical Market Size (US$ million) and Volume Trend Analysis By Market Taxonomy, 2017 to 2021

    16.4. Market Size (US$ million) and Volume Forecast By Market Taxonomy, 2022 to 2032

        16.4.1. By Country

            16.4.1.1. India

            16.4.1.2. ASEAN

            16.4.1.3. Australia and New Zealand 

            16.4.1.4. Rest of South Asia & Pacific

        16.4.2. By Purity

        16.4.3. By Grade

        16.4.4. By Application

    16.5. Market Attractiveness Analysis

        16.5.1. By Country

        16.5.2. By Purity

        16.5.3. By Grade

        16.5.4. By Application

    16.6. Market Trends

    16.7. Drivers and Restraints - Impact Analysis

17. East Asia Market Analysis 2017 to 2021 and Forecast 2022 to 2032

    17.1. Introduction

    17.2. Pricing Analysis

    17.3. Historical Market Size (US$ million) and Volume Trend Analysis By Market Taxonomy, 2017 to 2021

    17.4. Market Size (US$ million) and Volume Forecast By Market Taxonomy, 2022 to 2032

        17.4.1. By Country

            17.4.1.1. China

            17.4.1.2. Japan

            17.4.1.3. South Korea

        17.4.2. By Purity

        17.4.3. By Grade

        17.4.4. By Application

    17.5. Market Attractiveness Analysis

        17.5.1. By Country

        17.5.2. By Purity

        17.5.3. By Grade

        17.5.4. By Application

    17.6. Market Trends

    17.7. Drivers and Restraints - Impact Analysis

18. Middle East and Africa Market Analysis 2017 to 2021 and Forecast 2022 to 2032

    18.1. Introduction

    18.2. Pricing Analysis

    18.3. Historical Market Size (US$ million) and Volume Trend Analysis By Market Taxonomy, 2017 to 2021

    18.4. Market Size (US$ million) and Volume Forecast By Market Taxonomy, 2022 to 2032

        18.4.1. By Country

            18.4.1.1. GCC Countries

            18.4.1.2. Turkey

            18.4.1.3. Northern Africa

            18.4.1.4. South Africa

            18.4.1.5. Rest of Middle East and Africa

        18.4.2. By Purity

        18.4.3. By Grade

        18.4.4. By Application

    18.5. Market Attractiveness Analysis

        18.5.1. By Country

        18.5.2. By Purity

        18.5.3. By Grade

        18.5.4. By Application

    18.6. Market Trends

    18.7. Drivers and Restraints - Impact Analysis

19. Country-Wise Market Analysis 

    19.1. Introduction

    19.2. The  USA Market Analysis

        19.2.1. By Purity

        19.2.2. By Grade

        19.2.3. By Application

    19.3. Canada Market Analysis

        19.3.1. By Purity

        19.3.2. By Grade

        19.3.3. By Application

    19.4. Mexico Market Analysis

        19.4.1. By Purity

        19.4.2. By Grade

        19.4.3. By Application

    19.5. Brazil Market Analysis

        19.5.1. By Purity

        19.5.2. By Grade

        19.5.3. By Application

    19.6. Germany Market Analysis

        19.6.1. By Purity

        19.6.2. By Grade

        19.6.3. By Application

    19.7. Italy Market Analysis

        19.7.1. By Purity

        19.7.2. By Grade

        19.7.3. By Application

    19.8. France Market Analysis

        19.8.1. By Purity

        19.8.2. By Grade

        19.8.3. By Application

    19.9. United Kingdom Market Analysis

        19.9.1. By Purity

        19.9.2. By Grade

        19.9.3. By Application

    19.10. Spain Market Analysis

        19.10.1. By Purity

        19.10.2. By Grade

        19.10.3. By Application

    19.11. Russia Market Analysis

        19.11.1. By Purity

        19.11.2. By Grade

        19.11.3. By Application

    19.12. BENELUX Market Analysis

        19.12.1. By Purity

        19.12.2. By Grade

        19.12.3. By Application

    19.13. China Market Analysis

        19.13.1. By Purity

        19.13.2. By Grade

        19.13.3. By Application

    19.14. Japan Market Analysis

        19.14.1. By Purity

        19.14.2. By Grade

        19.14.3. By Application

    19.15. S. Korea Market Analysis

        19.15.1. By Purity

        19.15.2. By Grade

        19.15.3. By Application

    19.16. India Market Analysis

        19.16.1. By Purity

        19.16.2. By Grade

        19.16.3. By Application

    19.17. ASEAN Market Analysis

        19.17.1. By Purity

        19.17.2. By Grade

        19.17.3. By Application

    19.18. Australia and New Zealand Market Analysis

        19.18.1. By Purity

        19.18.2. By Grade

        19.18.3. By Application

    19.19. Turkey Market Analysis

        19.19.1. By Purity

        19.19.2. By Grade

        19.19.3. By Application

    19.20. South Africa Market Analysis

        19.20.1. By Purity

        19.20.2. By Grade

        19.20.3. By Application

20. Market Structure Analysis

    20.1. Market Analysis by Tier of Companies

    20.2. Market Concentration

    20.3. Market Share Analysis of Top Players

    20.4. Production Capacity of Key Players

    20.5. Market Presence Analysis

21. Competition Analysis

    21.1. Competition Dashboard

    21.2. Competition Benchmarking

    21.3. Competition Deep Dive

        21.3.1. Solvay S.A.

            21.3.1.1. Overview

            21.3.1.2. Product Portfolio

            21.3.1.3. Profitability by Market Segments (Product /Channel/Region)

            21.3.1.4. Sales Footprint

            21.3.1.5. Strategy Overview

        21.3.2. Morita Chemical Industries

            21.3.2.1. Overview

            21.3.2.2. Product Portfolio

            21.3.2.3. Profitability by Market Segments (Product /Channel/Region)

            21.3.2.4. Sales Footprint

            21.3.2.5. Strategy Overview

        21.3.3. Harshil Industries

            21.3.3.1. Overview

            21.3.3.2. Product Portfolio

            21.3.3.3. Profitability by Market Segments (Product /Channel/Region)

            21.3.3.4. Sales Footprint

            21.3.3.5. Strategy Overview

        21.3.4. Honeywell Fine Chemicals

            21.3.4.1. Overview

            21.3.4.2. Product Portfolio

            21.3.4.3. Profitability by Market Segments (Product /Channel/Region)

            21.3.4.4. Sales Footprint

            21.3.4.5. Strategy Overview

        21.3.5. AMG Aluminum

            21.3.5.1. Overview

            21.3.5.2. Product Portfolio

            21.3.5.3. Profitability by Market Segments (Product /Channel/Region)

            21.3.5.4. Sales Footprint

            21.3.5.5. Strategy Overview

        21.3.6. Madras Fluorine Ltd.

            21.3.6.1. Overview

            21.3.6.2. Product Portfolio

            21.3.6.3. Profitability by Market Segments (Product /Channel/Region)

            21.3.6.4. Sales Footprint

            21.3.6.5. Strategy Overview

        21.3.7. Stella Chemifa Corporation

            21.3.7.1. Overview

            21.3.7.2. Product Portfolio

            21.3.7.3. Profitability by Market Segments (Product /Channel/Region)

            21.3.7.4. Sales Footprint

            21.3.7.5. Strategy Overview

        21.3.8. Triveni Chemicals

            21.3.8.1. Overview

            21.3.8.2. Product Portfolio

            21.3.8.3. Profitability by Market Segments (Product /Channel/Region)

            21.3.8.4. Sales Footprint

            21.3.8.5. Strategy Overview

        21.3.9. Skyline Chemicals

            21.3.9.1. Overview

            21.3.9.2. Product Portfolio

            21.3.9.3. Profitability by Market Segments (Product /Channel/Region)

            21.3.9.4. Sales Footprint

            21.3.9.5. Strategy Overview

        21.3.10. Foshan Nanhai Fluoride Chemical Co. Ltd

            21.3.10.1. Overview

            21.3.10.2. Product Portfolio

            21.3.10.3. Profitability by Market Segments (Product /Channel/Region)

            21.3.10.4. Sales Footprint

            21.3.10.5. Strategy Overview

        21.3.11. Derivados Del Flúor (DDF)

            21.3.11.1. Overview

            21.3.11.2. Product Portfolio

            21.3.11.3. Profitability by Market Segments (Product /Channel/Region)

            21.3.11.4. Sales Footprint

            21.3.11.5. Strategy Overview

        21.3.12. Hunan Merits New Materials Co. Ltd.

            21.3.12.1. Overview

            21.3.12.2. Product Portfolio

            21.3.12.3. Profitability by Market Segments (Product /Channel/Region)

            21.3.12.4. Sales Footprint

            21.3.12.5. Strategy Overview

        21.3.13. American Elements

            21.3.13.1. Overview

            21.3.13.2. Product Portfolio

            21.3.13.3. Profitability by Market Segments (Product /Channel/Region)

            21.3.13.4. Sales Footprint

            21.3.13.5. Strategy Overview

        21.3.14. PARTH INDUSTRIES

            21.3.14.1. Overview

            21.3.14.2. Product Portfolio

            21.3.14.3. Profitability by Market Segments (Product /Channel/Region)

            21.3.14.4. Sales Footprint

            21.3.14.5. Strategy Overview

        21.3.15. FENGYUAN INDIA PRIVATE LIMITED

            21.3.15.1. Overview

            21.3.15.2. Product Portfolio

            21.3.15.3. Profitability by Market Segments (Product /Channel/Region)

            21.3.15.4. Sales Footprint

            21.3.15.5. Strategy Overview

        21.3.16. S. B. CHEMICALS

            21.3.16.1. Overview

            21.3.16.2. Product Portfolio

            21.3.16.3. Profitability by Market Segments (Product /Channel/Region)

            21.3.16.4. Sales Footprint

            21.3.16.5. Strategy Overview

        21.3.17. AWISHKAR CHEMICALS INDUSTRIES

            21.3.17.1. Overview

            21.3.17.2. Product Portfolio

            21.3.17.3. Profitability by Market Segments (Product /Channel/Region)

            21.3.17.4. Sales Footprint

            21.3.17.5. Strategy Overview

22. Primary Survey Analysis

23. Assumptions and Acronyms Used

24. Research Methodology

Don't pay for what you don't need

Customize your report by selecting specific countries or regions and save 30%!

List of Tables

Table 01: Global Volume (KT) and Value (US$ million) Forecast by Purity, 2017 to 2032

Table 02: Global Volume (KT) and Value (US$ million) Forecast by Grade, 2017 to 2032

Table 03: Global Volume (KT) and Value (US$ million) Forecast by Application, 2017 to 2032

Table 04: Global Size (US$ million) and Volume (KT) Forecast by Region, 2017 to 2032

Table 05: North America Size (US$ million) and Volume (KT) Forecast by Country, 2017 to 2032

Table 06: North America Volume (KT) and Value (US$ million) Forecast by Purity, 2017 to 2032

Table 07: North America Volume (KT) and Value (US$ million) Forecast by Grade, 2017 to 2032

Table 08: North America Volume (KT) and Value (US$ million) Forecast by Application, 2017 to 2032

Table 09: Latin America Size (US$ million) and Volume (KT) Forecast by Country, 2017 to 2032

Table 10: Latin America Volume (KT) and Value (US$ million) Forecast by Purity, 2017 to 2032

Table 11: Latin America Volume (KT) and Value (US$ million) Forecast by Grade, 2017 to 2032

Table 12: Latin America Volume (KT) and Value (US$ million) Forecast by Application, 2017 to 2032

Table 13: Europe Size (US$ million) and Volume (KT) Forecast by Country, 2017 to 2032

Table 14: Europe Volume (KT) and Value (US$ million) Forecast by Purity, 2017 to 2032

Table 15: Europe Volume (KT) and Value (US$ million) Forecast by Grade, 2017 to 2032

Table 16: Europe Volume (KT) and Value (US$ million) Forecast by Application, 2017 to 2032

Table 17: East Asia Size (US$ million) and Volume (KT) Forecast by Country, 2017 to 2032

Table 18: East Asia Volume (KT) and Value (US$ million) Forecast by Purity, 2017 to 2032

Table 19: East Asia Volume (KT) and Value (US$ million) Forecast by Grade, 2017 to 2032

Table 20: East Asia Volume (KT) and Value (US$ million) Forecast by Application, 2017 to 2032

Table 21: SAP Size (US$ million) and Volume (KT) Forecast by Country, 2017 to 2032

Table 22: SAP Volume (KT) and Value (US$ million) Forecast by Purity, 2017 to 2032

Table 23: SAP Volume (KT) and Value (US$ million) Forecast by Grade, 2017 to 2032

Table 24: SAP Volume (KT) and Value (US$ million) Forecast by Application, 2017 to 2032

Table 25: MEA Size (US$ million) and Volume (KT) Forecast by Country, 2017 to 2032

Table 26: MEA Volume (KT) and Value (US$ million) Forecast by Purity, 2017 to 2032

Table 27: MEA Volume (KT) and Value (US$ million) Forecast by Grade, 2017 to 2032

Table 28: MEA Volume (KT) and Value (US$ million) Forecast by Application, 2017 to 2032
Nikhil Kaitwade
Nikhil Kaitwade

Principal Consultant

Talk to Analyst

Find your sweet spots for generating winning opportunities in this market.

List of Charts

Figure 01: Global Historical Market Volume (KT) Analysis, 2017 to 2021

Figure 02: Global Current and Future Market Volume (KT) Analysis, 2022 to 2032

Figure 03: Global Potassium Fluoborate Historical Value (US$ million), 2017 to 2021

Figure 04: Global Potassium Fluoborate Value (US$ million) Forecast, 2022 to 2032

Figure 05: Global Value 2022 to 2032 and Y-O-Y (US$ million)

Figure 06: Global Share and BPS Analysis by Purity, 2022 to 2032

Figure 07: Global Y-o-Y Growth by Purity, 2022 to 2032

Figure 08: Global Attractiveness Analysis Purity, 2022 to 2032

Figure 09: Global Absolute $ Opportunity by Less than 99% Purity Segment, 2017 to 2032

Figure 10: Global Absolute $ Opportunity by 99% & above purity Segment, 2017 to 2032

Figure 11: Global Share and BPS Analysis by Grade, 2022 to 2032

Figure 12: Global Y-o-Y Growth by Grade, 2022 to 2032

Figure 13: Global Attractiveness Analysis Grade, 2022 to 2032

Figure 14: Global Absolute $ Opportunity by Technical Grade Segment, 2017 to 2032

Figure 15: Global Absolute $ Opportunity by Reagent Grade Segment, 2017 to 2032

Figure 16: Global Share and BPS Analysis by Application, 2022 to 2032

Figure 17: Global Y-o-Y Growth by Application, 2022 to 2032

Figure 18: Global Attractiveness Analysis Application, 2022 to 2032

Figure 19: Global Absolute $ Opportunity by Soldering Agent Segment, 2017 to 2032

Figure 20: Global Absolute $ Opportunity by Metal Processing Segment, 2017 to 2032

Figure 21: Global Absolute $ Opportunity by Abrasives Segment, 2017 to 2032

Figure 22: Global Absolute $ Opportunity by Fluxing Agent Segment, 2017 to 2032

Figure 23: Global Share and BPS Analysis by Region, 2022 to 2032

Figure 24: Global Y-o-Y Growth by Region, 2022 to 2032

Figure 25: Global Attractiveness Analysis Region, 2022 to 2032

Figure 26: Global Absolute $ Opportunity by North America Segment, 2017 to 2032

Figure 27: Global Absolute $ Opportunity by Latin America Segment, 2017 to 2032

Figure 28: Global Absolute $ Opportunity by Europe Segment, 2017 to 2032

Figure 29: Global Absolute $ Opportunity by East Asia Segment, 2017 to 2032

Figure 30: Global Absolute $ Opportunity by SAP Segment, 2017 to 2032

Figure 31: Global Absolute $ Opportunity by MEA Segment, 2017 to 2032

Figure 32: North America Share and BPS Analysis by Country, 2022 to 2032

Figure 33: North America Y-o-Y Growth by Country, 2022 to 2032

Figure 34: North America Attractiveness Analysis Country, 2022 to 2032

Figure 35: North America Share and BPS Analysis by Purity, 2022 to 2032

Figure 36: North America Y-o-Y Growth by Purity, 2022 to 2032

Figure 37: North America Attractiveness Analysis Purity, 2022 to 2032

Figure 38: North America Share and BPS Analysis by Grade, 2022 to 2032

Figure 39: North America Y-o-Y Growth by Grade, 2022 to 2032

Figure 40: North America Attractiveness Analysis Grade, 2022 to 2032

Figure 41: North America Share and BPS Analysis by Application, 2022 to 2032

Figure 42: North America Y-o-Y Growth by Application, 2022 to 2032

Figure 43: North America Attractiveness Analysis Application, 2022 to 2032

Figure 44: Latin America Share and BPS Analysis by Country, 2022 to 2032

Figure 45: Latin America Y-o-Y Growth by Country, 2022 to 2032

Figure 46: Latin America Attractiveness Analysis Country, 2022 to 2032

Figure 47: Latin America Share and BPS Analysis by Purity, 2022 to 2032

Figure 48: Latin America Y-o-Y Growth by Purity, 2022 to 2032

Figure 49: Latin America Attractiveness Analysis Purity, 2022 to 2032

Figure 50: Latin America Share and BPS Analysis by Grade, 2022 to 2032

Figure 51: Latin America Y-o-Y Growth by Grade, 2022 to 2032

Figure 52: Latin America Attractiveness Analysis Grade, 2022 to 2032

Figure 53: Latin America Share and BPS Analysis by Application, 2022 to 2032

Figure 54: Latin America Y-o-Y Growth by Application, 2022 to 2032

Figure 55: Latin America Attractiveness Analysis Application, 2022 to 2032

Figure 56: Europe Share and BPS Analysis by Country, 2022 to 2032

Figure 57: Europe Y-o-Y Growth by Country, 2022 to 2032

Figure 58: Europe Attractiveness Analysis Country, 2022 to 2032

Figure 59: Europe Share and BPS Analysis by Purity, 2022 to 2032

Figure 60: Europe Y-o-Y Growth by Purity, 2022 to 2032

Figure 61: Europe Attractiveness Analysis Purity, 2022 to 2032

Figure 62: Europe Share and BPS Analysis by Grade, 2022 to 2032

Figure 63: Europe Y-o-Y Growth by Grade, 2022 to 2032

Figure 64: Europe Attractiveness Analysis Grade, 2022 to 2032

Figure 65: Europe Share and BPS Analysis by Application, 2022 to 2032

Figure 66: Europe Y-o-Y Growth by Application, 2022 to 2032

Figure 67: Europe Attractiveness Analysis Application, 2022 to 2032

Figure 68: East Asia Share and BPS Analysis by Country, 2022 to 2032

Figure 69: East Asia Y-o-Y Growth by Country, 2022 to 2032

Figure 70: East Asia Attractiveness Analysis Country, 2022 to 2032

Figure 72: East Asia Share and BPS Analysis by Purity, 2022 to 2032

Figure 73: East Asia Y-o-Y Growth by Purity, 2022 to 2032

Figure 74: East Asia Attractiveness Analysis Purity, 2022 to 2032

Figure 75: East Asia Share and BPS Analysis by Grade, 2022 to 2032

Figure 76: East Asia Y-o-Y Growth by Grade, 2022 to 2032

Figure 77: East Asia Attractiveness Analysis Grade, 2022 to 2032

Figure 78: East Asia Share and BPS Analysis by Application, 2022 to 2032

Figure 79: East Asia Y-o-Y Growth by Application, 2022 to 2032

Figure 80: East Asia Attractiveness Analysis Application, 2022 to 2032

Figure 81: SAP Share and BPS Analysis by Country, 2022 to 2032

Figure 82: SAP Y-o-Y Growth by Country, 2022 to 2032

Figure 83: SAP Attractiveness Analysis Country, 2022 to 2032

Figure 84: SAP Share and BPS Analysis by Purity, 2022 to 2032

Figure 85: SAP Y-o-Y Growth by Purity, 2022 to 2032

Figure 86: SAP Attractiveness Analysis Purity, 2022 to 2032

Figure 87: SAP Share and BPS Analysis by Grade, 2022 to 2032

Figure 88: SAP Y-o-Y Growth by Grade, 2022 to 2032

Figure 89: SAP Attractiveness Analysis Grade, 2022 to 2032

Figure 90: SAP Share and BPS Analysis by Application, 2022 to 2032

Figure 91: SAP Y-o-Y Growth by Application, 2022 to 2032

Figure 92: SAP Attractiveness Analysis Application, 2022 to 2032

Figure 93: MEA Share and BPS Analysis by Country, 2022 to 2032

Figure 94: MEA Y-o-Y Growth by Country, 2022 to 2032

Figure 95: MEA Attractiveness Analysis Country, 2022 to 2032

Figure 96: MEA Share and BPS Analysis by Purity, 2022 to 2032

Figure 97: MEA Y-o-Y Growth by Purity, 2022 to 2032

Figure 98: MEA Attractiveness Analysis Purity, 2022 to 2032

Figure 99: MEA Share and BPS Analysis by Grade, 2022 to 2032

Figure 100: MEA Y-o-Y Growth by Grade, 2022 to 2032

Figure 101: MEA Attractiveness Analysis Grade, 2022 to 2032

Figure 102: MEA Share and BPS Analysis by Application, 2022 to 2032

Figure 103: MEA Y-o-Y Growth by Application, 2022 to 2032

Figure 104: MEA Attractiveness Analysis Application, 2022 to 2032

Recommendations

Chemicals & Materials

Metalworking Fluids Market

Published : June 2023

Chemicals & Materials

Potassium Citrate Market

Published : November 2022

Chemicals & Materials

Abrasives Market

Published : June 2022

Chemicals & Materials

Bonded Abrasives Market

Published : June 2022

Explore Chemicals & Materials Insights

View Reports

Potassium Fluoborate Market