Reports

- Global Locations -

Headquarters

Future Market Insights, Inc.

Christiana Corporate, 200
Continental Drive, Suite 401,
Newark, Delaware - 19713,
United States

T: +1-845-579-5705

Americas

Future Market Insights, Inc.

616 Corporate Way, Suite 2-9018,
Valley Cottage, NY 10989, United States

T: +1-347-918-3531

MEA

Future Market Insights

1602-6 Jumeirah Bay X2 Tower, Plot No: JLT-PH2-X2A,
Jumeirah Lakes Towers, Dubai,
United Arab Emirates

Europe

Future Market Insights

3rd Floor, 207 Regent Street,
W1B 3HH London
United Kingdom

T: + 44 (0) 20 8123 9659
D: +44 (0) 20 3287 4268

Asia Pacific

Future Market Insights

IndiaLand Global Tech Park, Unit UG-1, Behind Grand HighStreet, Phase 1, Hinjawadi, MH, Pune – 411057, India

Potassium Acetate Market Outlook (2022 to 2032)

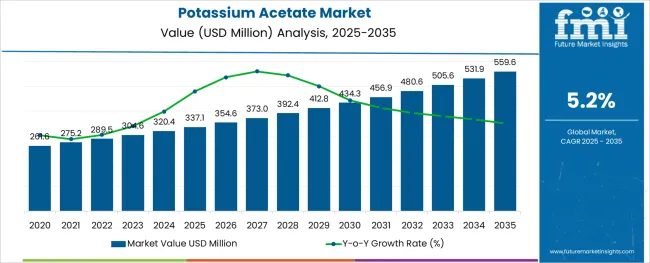
The global potassium acetate market is poised to register a 5.2% CAGR, capturing a revenue share of US$ 289.5 million in 2022, to reach US$ 482.1 million by 2032.

As a replacement for potassium chloride, potassium acetate is likely to boost the demand for the potassium acetate market across a wide range of end-use sectors. Because potassium chloride is subject to stringent environmental regulations, it cannot be used in large quantities.

Potassium acetate is used as an acidity regulator and preservative in processed foods. As a result of its ability to break down into bicarbonates, it can be used to treat diabetic ketoacidosis. Moreover, potassium acetate solutions are excellent precursors to the production of high-purity materials, nanoscale powders, and specific catalysts.

Report Attribute Details
Potassium Acetate Market Value (2022) US$ 289.5 Million
Potassium Acetate Market Anticipated Forecast Value (2032) US$ 482.1 Million
Potassium Acetate Market Projected Growth Rate (2022 to 2032) 5.2%

The potassium salt of acetic acid or potassium acetate appears as a white deliquescent crystalline powder and is also available in solution form. It is preferred for airport runways as it is applied as a deicer to remove the ice and prevent its further formation. Additionally, it is soluble in alcohol and liquid ammonia and insoluble in ether and acetone.

However, it has identical functional characteristics to potassium acetate, so it can be used as a substitute. Potassium acetate has a higher solubility than potassium chloride, and it has a more promising potential for use in high-density brines, which is expected to bolster the growth of the global potassium acetate market shortly.

Don't pay for what you don't need

Customize your report by selecting specific countries or regions and save 30%!

Potassium Acetate is Fast-replacing Applications relying on Potassium Chloride

The major factor driving the global potassium acetate market is that the compound is being used as an alternative to potassium chloride. This is owing to the environmental restrictions on the application of potassium chloride.

Potassium acetate functionality properties are identical to the latter. In high-density brines potassium acetate has a higher potential for use than potassium chloride due to its time-solubility. Additionally, the fluid is chloride-free, making it ideal for environmentally sensitive areas. Moreover, it provides shale hydration and swelling inhibition through cation exchange and electrolysis.

Market growth for potassium acetate is driven by the growing use of potassium chloride as an alternative. The potassium acetate market is driven by applications that require solubilized minerals, which is likely to create high demand and support market growth.

Processed food products and changing lifestyles are also expected to increase demand for potassium acetate and boost its market growth. The use of potassium acetate in the pharmaceuticals, chemical, food, and agriculture sectors is further aiding the market growth of potassium acetate.

Skin Irritation Caused could Encourage End Users to Look for Alternatives

Though the potassium acetate market has an average growth pace and is anticipated to keep up with the momentum, certain impediments could slow down the healthy growth of the market.

The major factor that hampers the growth of the market is the side effects of the potassium acetate compound if it is used in an inadequate composition. Some of the symptoms of potassium intoxication include burning sensations and tingling in the hands and feet, which can also lead to near-death symptoms.

Nandini Roy Choudhury

Principal Consultant

Talk to Analyst

Find your sweet spots for generating winning opportunities in this market.

Regional Analysis

Potassium Acetate’s Importance to F&B is Felt Immensely in North America

The demand for potassium acetate has increased in the North American region. North America is anticipated to control a potassium acetate market share of 30.1% in 2022 with increasing demand from the food and beverage industry as a preservative and flavor enhancer.

In the last decade, North America has held the largest revenue share in the global potassium acetate market due to the presence of numerous pharmaceutical companies involved in Research and Development activities related to the drug discovery process. In addition, these companies used potassium acetate derivatives as key reagents, thus positively influencing market growth over the projected period.
Pharmaceutical to be a Key Revenue Pocket for the Europe Potassium Acetate Market

The Europe potassium acetate market is predicted to experience significant growth and hold a market share of 27.5% in 2022. The increasing trend of packed food products, in turn, leads to demand for food additives such as potassium acetate and the increasing adoption of potassium acetate for a wide range of applications such as diabetic treatment in the pharmaceutical industry and as the deicing agent in several other industries.

Start-up Ecosystem

Product Innovation Defines the Start-up Ecosystem in the Potassium Acetate Market

The start-up ecosystem in the potassium acetate market is clouded by several companies because of the growing awareness about the benefits of potassium acetate among consumers as a non-toxic and environmentally friendly alternative to other preservatives.

To ensure product differentiation and to acquire a considerable share of the market, major vendors are adopting creative strategies and are constantly developing innovative products. Most of the major potassium acetate manufacturers concentrate on capitalizing their funds to maintain applications and technical marketing groups are appointed to serve the ever-changing needs of clients.
Get the data you need at a Fraction of the cost

Personalize your report by choosing insights you need
and save 40%!

Potassium Acetate Market Features Consolidation with Strong Key Players

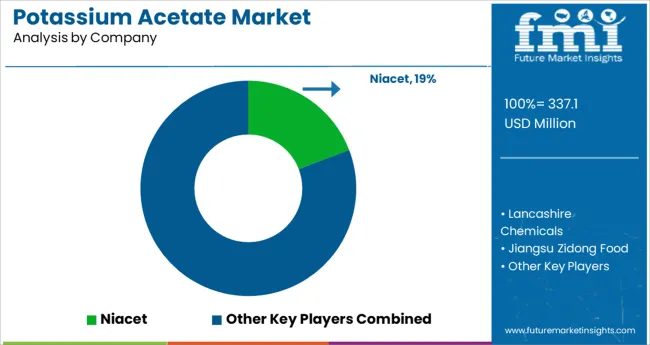
The potassium acetate market is consolidated with a presence of a few strong players from around the globe. A few of the prominent players in the global potassium acetate market are Niacet, Lancashire Chemicals, Jiangsu Zidong Food, Anhui Hongyang Chemical, Wuxi Yangshan Biochemical, Lianyungang Tongyuan Chemical, Jiangsu Kolod Food, and Shanxi Zhaoyi Chemical.

Emerging trends in the potassium acetate market are brought about by strategies adopted by the key players in the market are partnership and collaboration with other operators, expansion into the untapped market, and joint ventures with organizations in emerging countries to gain a strong foothold in the market.

Report Scope

Report Attribute Details
Growth Rate CAGR of 5.2% from 2022 to 2032
Base Year for Estimation 2022
Historical Data 2016 to 2021
Forecast Period 2022 to 2032
Quantitative Units Revenue in USD Million and CAGR from 2022 to 2032
Report Coverage Revenue Forecast, Volume Forecast, Company Ranking, Competitive Landscape, Growth Factors, Trends, and Pricing Analysis
Segments Covered
  • Class
  • Application
  • Region
Regions Covered
  • North America
  • Latin America
  • Western Europe
  • Eastern Europe
  • The Asia Pacific excluding Japan
  • Japan
  • The Middle East and Africa
Key Countries Profiled
  • United States of America
  • Canada
  • Brazil
  • Argentina
  • Germany
  • United Kingdom
  • France
  • Spain
  • Italy
  • Nordics
  • BENELUX
  • Australia & New Zealand
  • China
  • India
  • GCC Countries
  • South Africa
Key Companies Profiled
  • Niacet
  • Lancashire Chemicals
  • Jiangsu Zidong Food
  • Anhui Hongyang Chemical
  • Wuxi Yangshan Biochemical
  • Lianyungang Tongyuan Chemical
  • Jiangsu Kolod Food
  • Shanxi Zhaoyi Chemical
Customization Available Upon Request

Key Segments

By Class:

  • Pharmaceutical Grade
  • Industrial Grade
  • Food Grade
  • Others

By Application:

  • Industrial
  • Deicing
  • Pharma & Food
  • Others

By Region:

  • North America
  • Latin America
  • Asia Pacific
  • Europe
  • Middle East and Africa

Frequently Asked Questions

What is the Growth Outlook for the Potassium Acetate Market?

The global potassium acetate market is set to advance at a CAGR of 5.2% from 2022 to 2032.

What is the Future of the Potassium Acetate Market?

The potassium acetate market is likely to account for US$ 482.1 million by 2032.

What is the Anticipated Potassium Acetate Market Share of North America?

North America is likely to hold a Potassium Acetate market share of 30.1% in 2022.

What is the Size of Potassium Acetate?

The potassium acetate market is projected to grow to US$ 289.5 million in 2022.

Table of Content

1. Executive Summary | Potassium Acetate Market

    1.1. Global Market Outlook

    1.2. Demand-side Trends

    1.3. Supply-side Trends

    1.4. Technology Roadmap Analysis

    1.5. Analysis and Recommendations

2. Market Overview

    2.1. Market Coverage / Taxonomy

    2.2. Market Definition / Scope / Limitations

3. Market Background

    3.1. Market Dynamics

        3.1.1. Drivers

        3.1.2. Restraints

        3.1.3. Opportunity

        3.1.4. Trends

    3.2. Scenario Forecast

        3.2.1. Demand in Optimistic Scenario

        3.2.2. Demand in Likely Scenario

        3.2.3. Demand in Conservative Scenario

    3.3. Opportunity Map Analysis

    3.4. Product Life Cycle Analysis

    3.5. Supply Chain Analysis

        3.5.1. Supply Side Participants and Their Roles

            3.5.1.1. Producers

            3.5.1.2. Mid-Level Participants (Traders/ Agents/ Brokers)

            3.5.1.3. Wholesalers and Distributors

        3.5.2. Value Added and Value Created at Node in the Supply Chain

        3.5.3. List of Raw Material Suppliers

        3.5.4. List of Existing and Potential Buyers

    3.6. Investment Feasibility Matrix

    3.7. Value Chain Analysis

        3.7.1. Profit Margin Analysis

        3.7.2. Wholesalers and Distributors

        3.7.3. Retailers

    3.8. PESTLE and Porter’s Analysis

    3.9. Regulatory Landscape

        3.9.1. By Key Regions

        3.9.2. By Key Countries

    3.10. Regional Parent Market Outlook

    3.11. Production and Consumption Statistics

    3.12. Import and Export Statistics

4. Global Market Analysis 2017 to 2021 and Forecast, 2022 to 2032

    4.1. Historical Market Size Value (US$ Million) & Volume (Tonnes) Analysis, 2017 to 2021

    4.2. Current and Future Market Size Value (US$ Million) & Volume (Tonnes) Projections, 2022 to 2032

        4.2.1. Y-o-Y Growth Trend Analysis

        4.2.2. Absolute $ Opportunity Analysis

5. Global Market Analysis 2017 to 2021 and Forecast 2022 to 2032, By Product Type

    5.1. Introduction / Key Findings

    5.2. Historical Market Size Value (US$ Million) & Volume (Tonnes) Analysis By Product Type, 2017 to 2021

    5.3. Current and Future Market Size Value (US$ Million) & Volume (Tonnes) Analysis and Forecast By Product Type, 2022 to 2032

        5.3.1. Pharmaceutical Grade

        5.3.2. Food Grade

        5.3.3. Technical Grade

    5.4. Y-o-Y Growth Trend Analysis By Product Type, 2017 to 2021

    5.5. Absolute $ Opportunity Analysis By Product Type, 2022 to 2032

6. Global Market Analysis 2017 to 2021 and Forecast 2022 to 2032, By Application

    6.1. Introduction / Key Findings

    6.2. Historical Market Size Value (US$ Million) & Volume (Tonnes) Analysis By Application, 2017 to 2021

    6.3. Current and Future Market Size Value (US$ Million) & Volume (Tonnes) Analysis and Forecast By Application, 2022 to 2032

        6.3.1. Food & Beverages

        6.3.2. Chemicals & Material

        6.3.3. Pharmaceutical

    6.4. Y-o-Y Growth Trend Analysis By Application, 2017 to 2021

    6.5. Absolute $ Opportunity Analysis By Application, 2022 to 2032

7. Global Market Analysis 2017 to 2021 and Forecast 2022 to 2032, By Region

    7.1. Introduction

    7.2. Historical Market Size Value (US$ Million) & Volume (Tonnes) Analysis By Region, 2017 to 2021

    7.3. Current Market Size Value (US$ Million) & Volume (Tonnes) Analysis and Forecast By Region, 2022 to 2032

        7.3.1. North America

        7.3.2. Latin America

        7.3.3. Europe

        7.3.4. Asia Pacific

        7.3.5. Middle East and Africa

    7.4. Market Attractiveness Analysis By Region

8. North America Market Analysis 2017 to 2021 and Forecast 2022 to 2032, By Country

    8.1. Historical Market Size Value (US$ Million) & Volume (Tonnes) Trend Analysis By Market Taxonomy, 2017 to 2021

    8.2. Market Size Value (US$ Million) & Volume (Tonnes) Forecast By Market Taxonomy, 2022 to 2032

        8.2.1. By Country

            8.2.1.1. United States of America

            8.2.1.2. Canada

        8.2.2. By Product Type

        8.2.3. By Application

    8.3. Market Attractiveness Analysis

        8.3.1. By Country

        8.3.2. By Product Type

        8.3.3. By Application

    8.4. Key Takeaways

9. Latin America Market Analysis 2017 to 2021 and Forecast 2022 to 2032, By Country

    9.1. Historical Market Size Value (US$ Million) & Volume (Tonnes) Trend Analysis By Market Taxonomy, 2017 to 2021

    9.2. Market Size Value (US$ Million) & Volume (Tonnes) Forecast By Market Taxonomy, 2022 to 2032

        9.2.1. By Country

            9.2.1.1. Brazil

            9.2.1.2. Mexico

            9.2.1.3. Argentina

            9.2.1.4. Rest of Latin America

        9.2.2. By Product Type

        9.2.3. By Application

    9.3. Market Attractiveness Analysis

        9.3.1. By Country

        9.3.2. By Product Type

        9.3.3. By Application

    9.4. Key Takeaways

10. Europe Market Analysis 2017 to 2021 and Forecast 2022 to 2032, By Country

    10.1. Historical Market Size Value (US$ Million) & Volume (Tonnes) Trend Analysis By Market Taxonomy, 2017 to 2021

    10.2. Market Size Value (US$ Million) & Volume (Tonnes) Forecast By Market Taxonomy, 2022 to 2032

        10.2.1. By Country

            10.2.1.1. Germany

            10.2.1.2. The United Kingdom

            10.2.1.3. France

            10.2.1.4. Italy

            10.2.1.5. Spain

            10.2.1.6. Russia

            10.2.1.7. Poland

            10.2.1.8. Rest of Europe

        10.2.2. By Product Type

        10.2.3. By Application

    10.3. Market Attractiveness Analysis

        10.3.1. By Country

        10.3.2. By Product Type

        10.3.3. By Application

    10.4. Key Takeaways

11. Asia Pacific Market Analysis 2017 to 2021 and Forecast 2022 to 2032, By Country

    11.1. Historical Market Size Value (US$ Million) & Volume (Tonnes) Trend Analysis By Market Taxonomy, 2017 to 2021

    11.2. Market Size Value (US$ Million) & Volume (Tonnes) Forecast By Market Taxonomy, 2022 to 2032

        11.2.1. By Country

            11.2.1.1. China

            11.2.1.2. Japan

            11.2.1.3. India

            11.2.1.4. South Korea

            11.2.1.5. Australia

            11.2.1.6. Rest of Asia-Pacific (APAC)

        11.2.2. By Product Type

        11.2.3. By Application

    11.3. Market Attractiveness Analysis

        11.3.1. By Country

        11.3.2. By Product Type

        11.3.3. By Application

    11.4. Key Takeaways

12. Middle East and Africa Market Analysis 2017 to 2021 and Forecast 2022 to 2032, By Country

    12.1. Historical Market Size Value (US$ Million) & Volume (Tonnes) Trend Analysis By Market Taxonomy, 2017 to 2021

    12.2. Market Size Value (US$ Million) & Volume (Tonnes) Forecast By Market Taxonomy, 2022 to 2032

        12.2.1. By Country

            12.2.1.1. Saudi Arabia

            12.2.1.2. U.A.E

            12.2.1.3. Israel

            12.2.1.4. South Africa

        12.2.2. By Product Type

        12.2.3. By Application

    12.3. Market Attractiveness Analysis

        12.3.1. By Country

        12.3.2. By Product Type

        12.3.3. By Application

    12.4. Key Takeaways

13. Key Countries Market Analysis

    13.1. United States of America

        13.1.1. Pricing Analysis

        13.1.2. Market Share Analysis, 2021

            13.1.2.1. By Product Type

            13.1.2.2. By Application

    13.2. Canada

        13.2.1. Pricing Analysis

        13.2.2. Market Share Analysis, 2021

            13.2.2.1. By Product Type

            13.2.2.2. By Application

    13.3. Brazil

        13.3.1. Pricing Analysis

        13.3.2. Market Share Analysis, 2021

            13.3.2.1. By Product Type

            13.3.2.2. By Application

    13.4. Mexico

        13.4.1. Pricing Analysis

        13.4.2. Market Share Analysis, 2021

            13.4.2.1. By Product Type

            13.4.2.2. By Application

    13.5. Argentina

        13.5.1. Pricing Analysis

        13.5.2. Market Share Analysis, 2021

            13.5.2.1. By Product Type

            13.5.2.2. By Application

    13.6. Rest of Latin America

        13.6.1. Pricing Analysis

        13.6.2. Market Share Analysis, 2021

            13.6.2.1. By Product Type

            13.6.2.2. By Application

    13.7. Germany

        13.7.1. Pricing Analysis

        13.7.2. Market Share Analysis, 2021

            13.7.2.1. By Product Type

            13.7.2.2. By Application

    13.8. United Kingdom

        13.8.1. Pricing Analysis

        13.8.2. Market Share Analysis, 2021

            13.8.2.1. By Product Type

            13.8.2.2. By Application

    13.9. France

        13.9.1. Pricing Analysis

        13.9.2. Market Share Analysis, 2021

            13.9.2.1. By Product Type

            13.9.2.2. By Application

    13.10. Italy

        13.10.1. Pricing Analysis

        13.10.2. Market Share Analysis, 2021

            13.10.2.1. By Product Type

            13.10.2.2. By Application

    13.11. Spain

        13.11.1. Pricing Analysis

        13.11.2. Market Share Analysis, 2021

            13.11.2.1. By Product Type

            13.11.2.2. By Application

    13.12. Poland

        13.12.1. Pricing Analysis

        13.12.2. Market Share Analysis, 2021

            13.12.2.1. By Product Type

            13.12.2.2. By Application

    13.13. Russia

        13.13.1. Pricing Analysis

        13.13.2. Market Share Analysis, 2021

            13.13.2.1. By Product Type

            13.13.2.2. By Application

    13.14. Rest of Europe

        13.14.1. Pricing Analysis

        13.14.2. Market Share Analysis, 2021

            13.14.2.1. By Product Type

            13.14.2.2. By Application

    13.15. China

        13.15.1. Pricing Analysis

        13.15.2. Market Share Analysis, 2021

            13.15.2.1. By Product Type

            13.15.2.2. By Application

    13.16. Japan

        13.16.1. Pricing Analysis

        13.16.2. Market Share Analysis, 2021

            13.16.2.1. By Product Type

            13.16.2.2. By Application

    13.17. India

        13.17.1. Pricing Analysis

        13.17.2. Market Share Analysis, 2021

            13.17.2.1. By Product Type

            13.17.2.2. By Application

    13.18. South Korea

        13.18.1. Pricing Analysis

        13.18.2. Market Share Analysis, 2021

            13.18.2.1. By Product Type

            13.18.2.2. By Application

    13.19. Australia

        13.19.1. Pricing Analysis

        13.19.2. Market Share Analysis, 2021

            13.19.2.1. By Product Type

            13.19.2.2. By Application

    13.20. Rest of Asia-Pacific (APAC)

        13.20.1. Pricing Analysis

        13.20.2. Market Share Analysis, 2021

            13.20.2.1. By Product Type

            13.20.2.2. By Application

    13.21. Saudi Arabia

        13.21.1. Pricing Analysis

        13.21.2. Market Share Analysis, 2021

            13.21.2.1. By Product Type

            13.21.2.2. By Application

    13.22. UAE

        13.22.1. Pricing Analysis

        13.22.2. Market Share Analysis, 2021

            13.22.2.1. By Product Type

            13.22.2.2. By Application

    13.23. Israel

        13.23.1. Pricing Analysis

        13.23.2. Market Share Analysis, 2021

            13.23.2.1. By Product Type

            13.23.2.2. By Application

    13.24. South Africa

        13.24.1. Pricing Analysis

        13.24.2. Market Share Analysis, 2021

            13.24.2.1. By Product Type

            13.24.2.2. By Application

14. Market Structure Analysis

    14.1. Competition Dashboard

    14.2. Competition Benchmarking

    14.3. Market Share Analysis of Top Players

        14.3.1. By Regional

        14.3.2. By Product Type

        14.3.3. By Application

15. Competition Analysis

    15.1. Competition Deep Dive

        15.1.1. Niacet

            15.1.1.1. Overview

            15.1.1.2. Product Portfolio

            15.1.1.3. Profitability by Market Segments

            15.1.1.4. Sales Footprint

            15.1.1.5. Strategy Overview

                15.1.1.5.1. Marketing Strategy

                15.1.1.5.2. Product Strategy

                15.1.1.5.3. Channel Strategy

        15.1.2. Lancashire Chemicals

            15.1.2.1. Overview

            15.1.2.2. Product Portfolio

            15.1.2.3. Profitability by Market Segments

            15.1.2.4. Sales Footprint

            15.1.2.5. Strategy Overview

                15.1.2.5.1. Marketing Strategy

                15.1.2.5.2. Product Strategy

                15.1.2.5.3. Channel Strategy

        15.1.3. Jiangsu Zidong Food

            15.1.3.1. Overview

            15.1.3.2. Product Portfolio

            15.1.3.3. Profitability by Market Segments

            15.1.3.4. Sales Footprint

            15.1.3.5. Strategy Overview

                15.1.3.5.1. Marketing Strategy

                15.1.3.5.2. Product Strategy

                15.1.3.5.3. Channel Strategy

        15.1.4. Anhui Hongyang Chemical

            15.1.4.1. Overview

            15.1.4.2. Product Portfolio

            15.1.4.3. Profitability by Market Segments

            15.1.4.4. Sales Footprint

            15.1.4.5. Strategy Overview

                15.1.4.5.1. Marketing Strategy

                15.1.4.5.2. Product Strategy

                15.1.4.5.3. Channel Strategy

        15.1.5. Wuxi Yangshan Biochemical

            15.1.5.1. Overview

            15.1.5.2. Product Portfolio

            15.1.5.3. Profitability by Market Segments

            15.1.5.4. Sales Footprint

            15.1.5.5. Strategy Overview

                15.1.5.5.1. Marketing Strategy

                15.1.5.5.2. Product Strategy

                15.1.5.5.3. Channel Strategy

        15.1.6. Jiangsu Kolod Food

            15.1.6.1. Overview

            15.1.6.2. Product Portfolio

            15.1.6.3. Profitability by Market Segments

            15.1.6.4. Sales Footprint

            15.1.6.5. Strategy Overview

                15.1.6.5.1. Marketing Strategy

                15.1.6.5.2. Product Strategy

                15.1.6.5.3. Channel Strategy

        15.1.7. Lianyungang Tongyuan Chemical

            15.1.7.1. Overview

            15.1.7.2. Product Portfolio

            15.1.7.3. Profitability by Market Segments

            15.1.7.4. Sales Footprint

            15.1.7.5. Strategy Overview

                15.1.7.5.1. Marketing Strategy

                15.1.7.5.2. Product Strategy

                15.1.7.5.3. Channel Strategy

        15.1.8. Shanxi Zhaoyi Chemical

            15.1.8.1. Overview

            15.1.8.2. Product Portfolio

            15.1.8.3. Profitability by Market Segments

            15.1.8.4. Sales Footprint

            15.1.8.5. Strategy Overview

                15.1.8.5.1. Marketing Strategy

                15.1.8.5.2. Product Strategy

                15.1.8.5.3. Channel Strategy

        15.1.9. Diato Chemical

            15.1.9.1. Overview

            15.1.9.2. Product Portfolio

            15.1.9.3. Profitability by Market Segments

            15.1.9.4. Sales Footprint

            15.1.9.5. Strategy Overview

                15.1.9.5.1. Marketing Strategy

                15.1.9.5.2. Product Strategy

                15.1.9.5.3. Channel Strategy

        15.1.10. BASF

            15.1.10.1. Overview

            15.1.10.2. Product Portfolio

            15.1.10.3. Profitability by Market Segments

            15.1.10.4. Sales Footprint

            15.1.10.5. Strategy Overview

                15.1.10.5.1. Marketing Strategy

                15.1.10.5.2. Product Strategy

                15.1.10.5.3. Channel Strategy

        15.1.11. Evonik

            15.1.11.1. Overview

            15.1.11.2. Product Portfolio

            15.1.11.3. Profitability by Market Segments

            15.1.11.4. Sales Footprint

            15.1.11.5. Strategy Overview

                15.1.11.5.1. Marketing Strategy

                15.1.11.5.2. Product Strategy

                15.1.11.5.3. Channel Strategy

16. Assumptions & Acronyms Used

17. Research Methodology

Don't pay for what you don't need

Customize your report by selecting specific countries or regions and save 30%!

List of Tables

Table 1: Global Market Value (US$ Million) Forecast by Region, 2017 to 2032

Table 2: Global Market Volume (Tonnes) Forecast by Region, 2017 to 2032

Table 3: Global Market Value (US$ Million) Forecast by Product Type, 2017 to 2032

Table 4: Global Market Volume (Tonnes) Forecast by Product Type, 2017 to 2032

Table 5: Global Market Value (US$ Million) Forecast by Application, 2017 to 2032

Table 6: Global Market Volume (Tonnes) Forecast by Application, 2017 to 2032

Table 7: North America Market Value (US$ Million) Forecast by Country, 2017 to 2032

Table 8: North America Market Volume (Tonnes) Forecast by Country, 2017 to 2032

Table 9: North America Market Value (US$ Million) Forecast by Product Type, 2017 to 2032

Table 10: North America Market Volume (Tonnes) Forecast by Product Type, 2017 to 2032

Table 11: North America Market Value (US$ Million) Forecast by Application, 2017 to 2032

Table 12: North America Market Volume (Tonnes) Forecast by Application, 2017 to 2032

Table 13: Latin America Market Value (US$ Million) Forecast by Country, 2017 to 2032

Table 14: Latin America Market Volume (Tonnes) Forecast by Country, 2017 to 2032

Table 15: Latin America Market Value (US$ Million) Forecast by Product Type, 2017 to 2032

Table 16: Latin America Market Volume (Tonnes) Forecast by Product Type, 2017 to 2032

Table 17: Latin America Market Value (US$ Million) Forecast by Application, 2017 to 2032

Table 18: Latin America Market Volume (Tonnes) Forecast by Application, 2017 to 2032

Table 19: Europe Market Value (US$ Million) Forecast by Country, 2017 to 2032

Table 20: Europe Market Volume (Tonnes) Forecast by Country, 2017 to 2032

Table 21: Europe Market Value (US$ Million) Forecast by Product Type, 2017 to 2032

Table 22: Europe Market Volume (Tonnes) Forecast by Product Type, 2017 to 2032

Table 23: Europe Market Value (US$ Million) Forecast by Application, 2017 to 2032

Table 24: Europe Market Volume (Tonnes) Forecast by Application, 2017 to 2032

Table 25: Asia Pacific Market Value (US$ Million) Forecast by Country, 2017 to 2032

Table 26: Asia Pacific Market Volume (Tonnes) Forecast by Country, 2017 to 2032

Table 27: Asia Pacific Market Value (US$ Million) Forecast by Product Type, 2017 to 2032

Table 28: Asia Pacific Market Volume (Tonnes) Forecast by Product Type, 2017 to 2032

Table 29: Asia Pacific Market Value (US$ Million) Forecast by Application, 2017 to 2032

Table 30: Asia Pacific Market Volume (Tonnes) Forecast by Application, 2017 to 2032

Table 31: Middle East and Africa Market Value (US$ Million) Forecast by Country, 2017 to 2032

Table 32: Middle East and Africa Market Volume (Tonnes) Forecast by Country, 2017 to 2032

Table 33: Middle East and Africa Market Value (US$ Million) Forecast by Product Type, 2017 to 2032

Table 34: Middle East and Africa Market Volume (Tonnes) Forecast by Product Type, 2017 to 2032

Table 35: Middle East and Africa Market Value (US$ Million) Forecast by Application, 2017 to 2032

Table 36: Middle East and Africa Market Volume (Tonnes) Forecast by Application, 2017 to 2032
Nandini Roy Choudhury

Principal Consultant

Talk to Analyst

Find your sweet spots for generating winning opportunities in this market.

List of Charts

Figure 1: Global Market Value (US$ Million) by Product Type, 2022 to 2032

Figure 2: Global Market Value (US$ Million) by Application, 2022 to 2032

Figure 3: Global Market Value (US$ Million) by Region, 2022 to 2032

Figure 4: Global Market Value (US$ Million) Analysis by Region, 2017 to 2032

Figure 5: Global Market Volume (Tonnes) Analysis by Region, 2017 to 2032

Figure 6: Global Market Value Share (%) and BPS Analysis by Region, 2022 to 2032

Figure 7: Global Market Y-o-Y Growth (%) Projections by Region, 2022 to 2032

Figure 8: Global Market Value (US$ Million) Analysis by Product Type, 2017 to 2032

Figure 9: Global Market Volume (Tonnes) Analysis by Product Type, 2017 to 2032

Figure 10: Global Market Value Share (%) and BPS Analysis by Product Type, 2022 to 2032

Figure 11: Global Market Y-o-Y Growth (%) Projections by Product Type, 2022 to 2032

Figure 12: Global Market Value (US$ Million) Analysis by Application, 2017 to 2032

Figure 13: Global Market Volume (Tonnes) Analysis by Application, 2017 to 2032

Figure 14: Global Market Value Share (%) and BPS Analysis by Application, 2022 to 2032

Figure 15: Global Market Y-o-Y Growth (%) Projections by Application, 2022 to 2032

Figure 16: Global Market Attractiveness by Product Type, 2022 to 2032

Figure 17: Global Market Attractiveness by Application, 2022 to 2032

Figure 18: Global Market Attractiveness by Region, 2022 to 2032

Figure 19: North America Market Value (US$ Million) by Product Type, 2022 to 2032

Figure 20: North America Market Value (US$ Million) by Application, 2022 to 2032

Figure 21: North America Market Value (US$ Million) by Country, 2022 to 2032

Figure 22: North America Market Value (US$ Million) Analysis by Country, 2017 to 2032

Figure 23: North America Market Volume (Tonnes) Analysis by Country, 2017 to 2032

Figure 24: North America Market Value Share (%) and BPS Analysis by Country, 2022 to 2032

Figure 25: North America Market Y-o-Y Growth (%) Projections by Country, 2022 to 2032

Figure 26: North America Market Value (US$ Million) Analysis by Product Type, 2017 to 2032

Figure 27: North America Market Volume (Tonnes) Analysis by Product Type, 2017 to 2032

Figure 28: North America Market Value Share (%) and BPS Analysis by Product Type, 2022 to 2032

Figure 29: North America Market Y-o-Y Growth (%) Projections by Product Type, 2022 to 2032

Figure 30: North America Market Value (US$ Million) Analysis by Application, 2017 to 2032

Figure 31: North America Market Volume (Tonnes) Analysis by Application, 2017 to 2032

Figure 32: North America Market Value Share (%) and BPS Analysis by Application, 2022 to 2032

Figure 33: North America Market Y-o-Y Growth (%) Projections by Application, 2022 to 2032

Figure 34: North America Market Attractiveness by Product Type, 2022 to 2032

Figure 35: North America Market Attractiveness by Application, 2022 to 2032

Figure 36: North America Market Attractiveness by Country, 2022 to 2032

Figure 37: Latin America Market Value (US$ Million) by Product Type, 2022 to 2032

Figure 38: Latin America Market Value (US$ Million) by Application, 2022 to 2032

Figure 39: Latin America Market Value (US$ Million) by Country, 2022 to 2032

Figure 40: Latin America Market Value (US$ Million) Analysis by Country, 2017 to 2032

Figure 41: Latin America Market Volume (Tonnes) Analysis by Country, 2017 to 2032

Figure 42: Latin America Market Value Share (%) and BPS Analysis by Country, 2022 to 2032

Figure 43: Latin America Market Y-o-Y Growth (%) Projections by Country, 2022 to 2032

Figure 44: Latin America Market Value (US$ Million) Analysis by Product Type, 2017 to 2032

Figure 45: Latin America Market Volume (Tonnes) Analysis by Product Type, 2017 to 2032

Figure 46: Latin America Market Value Share (%) and BPS Analysis by Product Type, 2022 to 2032

Figure 47: Latin America Market Y-o-Y Growth (%) Projections by Product Type, 2022 to 2032

Figure 48: Latin America Market Value (US$ Million) Analysis by Application, 2017 to 2032

Figure 49: Latin America Market Volume (Tonnes) Analysis by Application, 2017 to 2032

Figure 50: Latin America Market Value Share (%) and BPS Analysis by Application, 2022 to 2032

Figure 51: Latin America Market Y-o-Y Growth (%) Projections by Application, 2022 to 2032

Figure 52: Latin America Market Attractiveness by Product Type, 2022 to 2032

Figure 53: Latin America Market Attractiveness by Application, 2022 to 2032

Figure 54: Latin America Market Attractiveness by Country, 2022 to 2032

Figure 55: Europe Market Value (US$ Million) by Product Type, 2022 to 2032

Figure 56: Europe Market Value (US$ Million) by Application, 2022 to 2032

Figure 57: Europe Market Value (US$ Million) by Country, 2022 to 2032

Figure 58: Europe Market Value (US$ Million) Analysis by Country, 2017 to 2032

Figure 59: Europe Market Volume (Tonnes) Analysis by Country, 2017 to 2032

Figure 60: Europe Market Value Share (%) and BPS Analysis by Country, 2022 to 2032

Figure 61: Europe Market Y-o-Y Growth (%) Projections by Country, 2022 to 2032

Figure 62: Europe Market Value (US$ Million) Analysis by Product Type, 2017 to 2032

Figure 63: Europe Market Volume (Tonnes) Analysis by Product Type, 2017 to 2032

Figure 64: Europe Market Value Share (%) and BPS Analysis by Product Type, 2022 to 2032

Figure 65: Europe Market Y-o-Y Growth (%) Projections by Product Type, 2022 to 2032

Figure 66: Europe Market Value (US$ Million) Analysis by Application, 2017 to 2032

Figure 67: Europe Market Volume (Tonnes) Analysis by Application, 2017 to 2032

Figure 68: Europe Market Value Share (%) and BPS Analysis by Application, 2022 to 2032

Figure 69: Europe Market Y-o-Y Growth (%) Projections by Application, 2022 to 2032

Figure 70: Europe Market Attractiveness by Product Type, 2022 to 2032

Figure 71: Europe Market Attractiveness by Application, 2022 to 2032

Figure 72: Europe Market Attractiveness by Country, 2022 to 2032

Figure 73: Asia Pacific Market Value (US$ Million) by Product Type, 2022 to 2032

Figure 74: Asia Pacific Market Value (US$ Million) by Application, 2022 to 2032

Figure 75: Asia Pacific Market Value (US$ Million) by Country, 2022 to 2032

Figure 76: Asia Pacific Market Value (US$ Million) Analysis by Country, 2017 to 2032

Figure 77: Asia Pacific Market Volume (Tonnes) Analysis by Country, 2017 to 2032

Figure 78: Asia Pacific Market Value Share (%) and BPS Analysis by Country, 2022 to 2032

Figure 79: Asia Pacific Market Y-o-Y Growth (%) Projections by Country, 2022 to 2032

Figure 80: Asia Pacific Market Value (US$ Million) Analysis by Product Type, 2017 to 2032

Figure 81: Asia Pacific Market Volume (Tonnes) Analysis by Product Type, 2017 to 2032

Figure 82: Asia Pacific Market Value Share (%) and BPS Analysis by Product Type, 2022 to 2032

Figure 83: Asia Pacific Market Y-o-Y Growth (%) Projections by Product Type, 2022 to 2032

Figure 84: Asia Pacific Market Value (US$ Million) Analysis by Application, 2017 to 2032

Figure 85: Asia Pacific Market Volume (Tonnes) Analysis by Application, 2017 to 2032

Figure 86: Asia Pacific Market Value Share (%) and BPS Analysis by Application, 2022 to 2032

Figure 87: Asia Pacific Market Y-o-Y Growth (%) Projections by Application, 2022 to 2032

Figure 88: Asia Pacific Market Attractiveness by Product Type, 2022 to 2032

Figure 89: Asia Pacific Market Attractiveness by Application, 2022 to 2032

Figure 90: Asia Pacific Market Attractiveness by Country, 2022 to 2032

Figure 91: Middle East and Africa Market Value (US$ Million) by Product Type, 2022 to 2032

Figure 92: Middle East and Africa Market Value (US$ Million) by Application, 2022 to 2032

Figure 93: Middle East and Africa Market Value (US$ Million) by Country, 2022 to 2032

Figure 94: Middle East and Africa Market Value (US$ Million) Analysis by Country, 2017 to 2032

Figure 95: Middle East and Africa Market Volume (Tonnes) Analysis by Country, 2017 to 2032

Figure 96: Middle East and Africa Market Value Share (%) and BPS Analysis by Country, 2022 to 2032

Figure 97: Middle East and Africa Market Y-o-Y Growth (%) Projections by Country, 2022 to 2032

Figure 98: Middle East and Africa Market Value (US$ Million) Analysis by Product Type, 2017 to 2032

Figure 99: Middle East and Africa Market Volume (Tonnes) Analysis by Product Type, 2017 to 2032

Figure 100: Middle East and Africa Market Value Share (%) and BPS Analysis by Product Type, 2022 to 2032

Figure 101: Middle East and Africa Market Y-o-Y Growth (%) Projections by Product Type, 2022 to 2032

Figure 102: Middle East and Africa Market Value (US$ Million) Analysis by Application, 2017 to 2032

Figure 103: Middle East and Africa Market Volume (Tonnes) Analysis by Application, 2017 to 2032

Figure 104: Middle East and Africa Market Value Share (%) and BPS Analysis by Application, 2022 to 2032

Figure 105: Middle East and Africa Market Y-o-Y Growth (%) Projections by Application, 2022 to 2032

Figure 106: Middle East and Africa Market Attractiveness by Product Type, 2022 to 2032

Figure 107: Middle East and Africa Market Attractiveness by Application, 2022 to 2032

Figure 108: Middle East and Africa Market Attractiveness by Country, 2022 to 2032

Recommendations

Food and Beverage

Potassium Propionate Market

Published : December 2022

Explore Food and Beverage Insights

View Reports