The joint compound market is projected to grow from USD 5.5 billion in 2025 to USD 9.1 billion in 2035, reflecting a CAGR of 5.2%. The long-term value accumulation curve shows a steady and continuous upward movement, driven by expanding construction activity, interior renovation projects, and the increasing demand for smooth finishing materials across residential and commercial spaces.
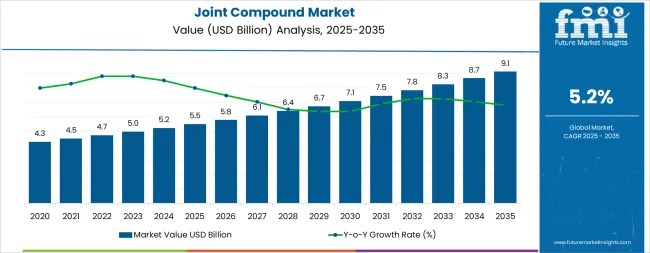
Consistent usage in drywall installation, surface finishing, and repair work contributes to a stable revenue stream for manufacturers. Technological enhancements in formulation, including lightweight compounds, dust-control variants, and faster drying solutions, are expected to support value accumulation throughout the forecast period.
From 2025 to 2030, the curve is likely to display a gradual rise, reflecting sustained consumption in construction and refurbishment projects. Growth during this phase will be influenced by steady infrastructure development and housing demand in emerging economies. Between 2030 and 2035, the curve may steepen slightly as urban construction, energy-efficient building initiatives, and green material adoption strengthen market momentum. The absence of sharp fluctuations indicates a predictable and resilient pattern, showing long-term confidence among manufacturers, suppliers, and distributors.
The joint compound market is largely driven by two broad segments: ready-mixed compounds and setting-type or powdered compounds. The ready-mixed type captures the majority of demand, accounting for about 65-70% of global usage, owing to convenience, labor savings, and ease of use. The setting or powder-based types fill the remainder and are chosen where longer working time, cost efficiency or specific performance (such as in moist conditions or special finishes) matter. Residential construction contributes nearly half of total joint compound demand (45-50%), with commercial and institutional sectors taking the rest.
Manufacturers are placing strong emphasis on creating greener formulations - low-VOC, low-dust, bio-based binders, and recyclable packaging are sought after due to regulatory pressure and consumer awareness. Lightweight joint compound variants are rising in popularity, easing handling and reducing fatigue for applicators.
Faster-drying and quick-setting versions are being developed for tight schedules, while mold- and moisture-resistant products are responding to demand in humid or wet environments. Retail channels, including online platforms and DIY kits, are expanding reach beyond traditional contractor-oriented supply, broadening market access.
From 2030 to 2035, the market is forecast to grow from USD 7.0 billion to USD 9.1 billion, adding another USD 2.2 billion, which constitutes 59.5% of the overall ten-year expansion. This period is expected to be characterized by the expansion of premium specialty formulations with enhanced performance attributes, the integration of sustainable and bio-based ingredients reducing environmental impact, and the development of application-optimized products for emerging construction methods including modular building systems and prefabricated panel assemblies.
The growing adoption of digital color-matching technologies and customized texture options will drive demand for joint compound products with versatile finishing capabilities, comprehensive technical support, and documented performance meeting stringent green building certification requirements.
Between 2020 and 2025, the joint compound market experienced steady growth, driven by resilient residential construction and remodeling activity and growing recognition of ready-mix joint compounds as productivity-enhancing alternatives to traditional setting-type formulations offering superior workability, extended open time, and consistent finishing quality. The market developed as contractors and DIY users recognized the potential for modern joint compound formulations to reduce labor time while improving surface quality and minimizing dust exposure.
Technological advancement in polymer chemistry and formulation design began emphasizing the critical importance of low-dust characteristics, ease of sanding, and indoor air quality compliance in modern drywall finishing operations.
| Metric | Value |
|---|---|
| Estimated Value in (2025E) | USD 5.5 billion |
| Forecast Value in (2035F) | USD 9.1 billion |
| Forecast CAGR (2025 to 2035) | 5.2% |
Market expansion is being supported by the robust residential repair and remodeling market and the corresponding need for high-quality drywall finishing materials that enable efficient joint treatment, smooth surface preparation, and professional appearance across home improvement projects, new home construction, and commercial interior fit-out applications.
Modern contractors and homeowners are increasingly focused on implementing ready-mix joint compounds that eliminate mixing labor, provide consistent viscosity and workability, and deliver reliable performance enabling faster project completion with superior finishing quality.
Joint compound's proven ability to create seamless drywall installations, accommodate diverse finishing levels, and support both hand and mechanical application make it an essential material for contemporary interior construction and renovation projects.
The growing emphasis on workplace safety and indoor air quality is driving demand for low-dust and dust-control joint compound formulations that reduce respirable crystalline silica exposure during sanding operations while meeting OSHA workplace safety requirements and supporting contractor compliance with health and safety regulations.
Contractors' preference for products that combine application performance with worker protection and environmental responsibility is creating opportunities for specialty joint compound adoption. The rising influence of green building certifications, modular construction methods, and DIY home improvement activity is also contributing to increased consumption of ready-mix formulations with low-VOC content, mold-resistant properties, and user-friendly application characteristics supporting both professional contractor productivity and homeowner project success.
The joint compound market is poised for steady growth driven by construction sector resilience and product innovation. As contractors, builders, and DIY users across residential, commercial, and institutional construction seek finishing materials that deliver application efficiency, superior surface quality, workplace safety compliance, and environmental responsibility, joint compounds are gaining recognition not just as commodity drywall finishing products but as performance-engineered materials enabling productivity enhancement and quality differentiation.
Rising residential remodeling expenditure in North America and Europe, accelerating drywall adoption in Asian construction markets, and expanding contractor focus on dust-control and specialty formulations amplify demand, while manufacturers are advancing innovations in lightweight formulations, quick-dry technologies, and sustainable ingredients.
Pathways like dust-control and OSHA-compliant formulations, lightweight and easy-sand products, and specialty performance compounds promise margin improvement, especially in professional contractor and premium residential segments. Geographic expansion and contractor training programs will capture volume growth in emerging Asian markets transitioning from traditional plastering. Regulatory drivers around workplace safety requirements, VOC limits, green building standards, and construction quality specifications provide structural support.
The market is segmented by product type, end use/application, distribution channel, formulation attribute, and region. By product type, the market is divided into ready-mix (all-purpose, lightweight, dust-control, taping/finishing), setting-type, and drying-type. By end use/application, it covers residential construction (new build, repair/remodel), commercial, institutional, and industrial.
By distribution channel, it is categorized into pro/contractor channels (specialty dealers, direct-to-contractor), home centers/DIY, builder/wholesale, and e-commerce. By formulation attribute, it includes low-dust/OSHA-friendly, low-VOC certified, mold/mildew-resistant, quick-dry/fast-set, and standard. Regionally, the market is divided into North America, Europe, East Asia, South Asia & Pacific, Latin America, and the Middle East & Africa.
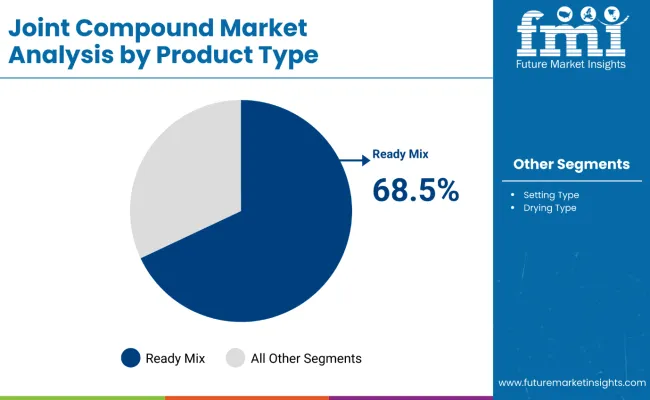
The ready-mix segment is projected to account for 68.5% of the joint compound market in 2025, reaffirming its position as the dominant product type category. Drywall contractors and homeowners increasingly utilize ready-mix joint compounds for their superior convenience eliminating on-site mixing labor, consistent viscosity and workability from container opening, extended open time enabling efficient application, and reliable performance across diverse environmental conditions and application methods. Ready-mix technology's formulation sophistication and packaging convenience directly address the construction industry requirements for labor productivity, quality consistency, and simplified material handling in residential and commercial drywall finishing operations.
Within the ready-mix segment, all-purpose formulations command 29.0% of the product type market, offering versatile performance for all coat applications including embedding tape, filling joints, and finish coating in general drywall installations. Lightweight compounds represent 24.0% of the segment, providing reduced weight for easier handling and application with minimal shrinkage characteristics improving finishing efficiency. Dust-control formulations account for 9.5% of ready-mix demand, serving contractor needs for OSHA-compliant low-dust sanding operations. Taping and finishing specialty products represent 6.0% of the segment, addressing specific application requirements.
This product type segment represents modern drywall finishing practice, as ready-mix compounds provide the workflow efficiency and quality consistency demanded by professional contractors and DIY users. Manufacturer investments in polymer technology and rheology optimization continue to enhance ready-mix performance. With contractors prioritizing productivity and consistent quality, ready-mix joint compounds align with both efficiency objectives and finishing quality requirements, making them the preferred product format for the vast majority of drywall finishing applications.
Residential construction applications are projected to represent 47.3% of joint compound demand in 2025, underscoring their critical role as the largest end-use category consuming drywall finishing materials for interior wall and ceiling installations across single-family homes, multifamily residential buildings, and residential remodeling projects. Residential builders and remodeling contractors prefer joint compounds for their ability to create smooth, paint-ready surfaces, accommodate varying finishing level requirements, and support efficient construction schedules through reliable drying and sanding characteristics.
Within the residential construction segment, new build projects represent 27.0% of end-use demand, serving single-family and multifamily home construction requiring complete interior drywall finishing systems. Repair and remodel applications account for 20.3% of residential demand, addressing existing home improvement projects including room additions, basement finishing, and interior renovation requiring drywall repair and finishing materials accessible through retail and specialty distribution channels.
Commercial construction commands 30.0% of end-use demand, including office buildings, retail centers, hospitality facilities, and mixed-use developments requiring professional-grade finishing materials. Institutional applications represent 13.0% of the segment, encompassing schools, healthcare facilities, and government buildings with stringent quality and environmental specifications. Industrial applications account for 9.7% of demand, serving warehouse, manufacturing, and light industrial interior finishing requirements.
The residential segment is supported by sustained housing market activity including both new construction and remodeling expenditure representing significant ongoing investment in residential building improvements. Homeowners and builders are prioritizing interior finish quality. As home improvement spending remains robust and residential construction continues, residential applications will dominate end-use demand while supporting both professional contractor operations and DIY homeowner projects.
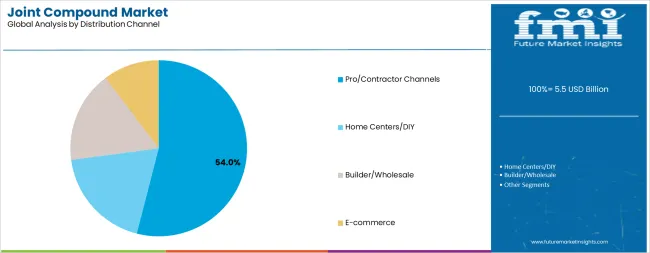
Professional and contractor distribution channels are projected to represent 54.0% of joint compound sales in 2025, underscoring their importance as the primary route-to-market serving professional drywall contractors, commercial builders, and remodeling professionals requiring reliable product availability, technical support, and contractor-focused service models. Professional distributors provide comprehensive product selection, job-site delivery, contractor credit terms, and technical assistance supporting contractor productivity and project success.
Within the pro/contractor channel segment, specialty dealers represent 33.0% of distribution channel sales, including dedicated drywall and building material distributors providing extensive joint compound product lines, contractor services, and technical expertise. Direct-to-contractor sales account for 21.0% of channel demand, serving large contractors and national accounts through manufacturer direct sales programs and regional distribution centers.
Home centers and DIY retail channels command 28.0% of sales, providing consumer-accessible product selection and smaller package sizes serving homeowner projects and small contractors. Builder and wholesale channels represent 12.0% of distribution, serving production builders and large-scale residential construction operations. E-commerce accounts for 6.0% of sales, representing growing digital distribution through online retailers and manufacturer direct platforms.
The professional channel segment is supported by the specialized service requirements of professional contractors including product selection expertise, jobsite logistics support, and technical assistance. Manufacturers and distributors are investing in contractor relationship programs and digital ordering platforms. As construction complexity increases and contractor expectations evolve, professional distribution channels will continue representing the majority of market sales while supporting contractor efficiency and project quality through specialized service capabilities.
The joint compound market is advancing steadily due to resilient residential construction and remodeling activity requiring consistent drywall finishing material supply and growing adoption of ready-mix formulations offering superior convenience, application performance, and quality consistency compared to traditional setting-type compounds requiring on-site mixing and precise water-to-powder ratios.
The market faces challenges, including raw material cost volatility affecting formulation economics particularly for polymer additives and specialty ingredients, competitive intensity from regional manufacturers offering price-competitive commodity products in mature markets, and increasing performance expectations requiring continuous product development investments in dust-control, lightweight, and specialty formulations. Innovation in sustainable formulations, application-specific products, and packaging optimization continues to influence market development and competitive positioning strategies.
The growing emphasis on workplace safety regulations including OSHA respirable crystalline silica standards is enabling joint compound manufacturers to develop advanced dust-control formulations that significantly reduce airborne dust generation during sanding operations while maintaining application performance, finishing quality, and contractor productivity supporting compliance with construction workplace safety requirements.
Dust-control technology provides differentiation opportunities and premium pricing while addressing critical contractor concerns regarding worker health protection, regulatory compliance costs, and jobsite environmental conditions. Manufacturers are increasingly recognizing the strategic value of safety-focused product development for strengthening contractor relationships and supporting industry-wide advancement toward improved workplace safety practices in drywall finishing operations.
Modern joint compound developers are incorporating advanced lightweight fillers and rheology modifiers that reduce product density by 30-40% compared to conventional formulations while maintaining strength, adhesion, and finishing characteristics enabling easier physical handling, reduced applicator fatigue, and improved productivity in high-volume drywall finishing operations particularly relevant for ceiling applications and extended workdays.
Lightweight formulations enable performance differentiation while addressing contractor workforce challenges including aging demographics and physical demand reduction objectives improving job satisfaction and worker retention. Advanced formulation technology also allows manufacturers to offer application-optimized products supporting contractor efficiency through easier sanding characteristics, reduced drying shrinkage, and enhanced surface quality with fewer coat applications.
Drywall finishing contractors and building owners are specifying joint compounds with specialized performance attributes including mold resistance for moisture-prone applications, low-VOC content for indoor air quality compliance, quick-dry characteristics for fast-track construction schedules, and green building certification documentation supporting LEED and other environmental rating system requirements in commercial and institutional construction projects with comprehensive sustainability objectives.
Specialty formulations enable premium market positioning and margin enhancement while supporting contractor value-added service offerings differentiating professional expertise and quality commitment in competitive bidding environments. The focus on performance specialization is creating opportunities for manufacturers to develop application-specific product portfolios while supporting diverse construction market segments with tailored solutions addressing unique technical and environmental requirements beyond commodity finishing materials.
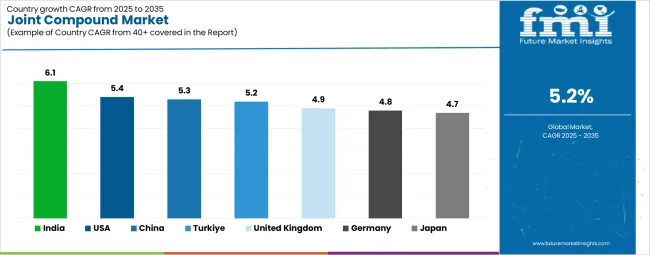
| Country | CAGR (2025 to 2035) |
|---|---|
| India | 6.1% |
| USA | 5.4% |
| China | 5.3% |
| Turkey | 5.2% |
| United Kingdom | 4.9% |
| Germany | 4.8% |
| Japan | 4.7% |
The joint compound market is experiencing steady growth globally, with India leading at a 6.1% CAGR through 2035, driven by accelerating housing starts in tier-2 and tier-3 urban centers, expanding middle-class residential construction, and increasing gypsum board penetration replacing traditional plastering methods in modern construction projects.
The USA follows at 5.4%, supported by robust residential repair and remodeling market intensity, growing DIY home improvement activity, and increasing adoption of low-dust and specialty mix formulations meeting contractor productivity and regulatory requirements.
China shows growth at 5.3%, emphasizing multifamily residential tower construction, commercial interior fit-outs, and lightweight compound adoption. Turkey records 5.2%, focusing on earthquake-resilient reconstruction programs and rapid urban development projects.
The United Kingdom demonstrates 4.9% growth, driven by residential retrofit programs and modular prefabricated construction demand. Germany exhibits 4.8% growth, supported by energy-efficiency retrofit programs and low-VOC specification requirements in public buildings. Japan shows 4.7% growth, emphasizing urban redevelopment projects, premium finish quality standards, and quick-set compound utilization.
The report covers an in-depth analysis of 40+ countries, Top-performing countries are highlighted below.
The joint compounds industry in India is projected to exhibit exceptional growth with a CAGR of 6.1% through 2035, driven by substantial housing construction activity in expanding tier-2 and tier-3 urban centers, growing middle-class demand for modern residential construction with improved interior finish quality, and accelerating gypsum board installation penetration replacing traditional cement plastering in residential and commercial construction. The country's rapid urbanization and substantial residential construction pipeline are creating significant demand for drywall finishing materials. Construction companies and building material distributors are establishing joint compound product availability and contractor training programs.
Government emphasis on affordable housing construction and urban development initiatives is driving adoption of efficient construction methods including drywall systems throughout major metropolitan expansion zones. Strong residential construction activity and an expanding commercial real estate sector are supporting rapid consumption growth of ready-mix joint compounds among contractors seeking productivity improvements and finish quality enhancements over traditional plastering methods requiring longer curing times and greater labor intensity.
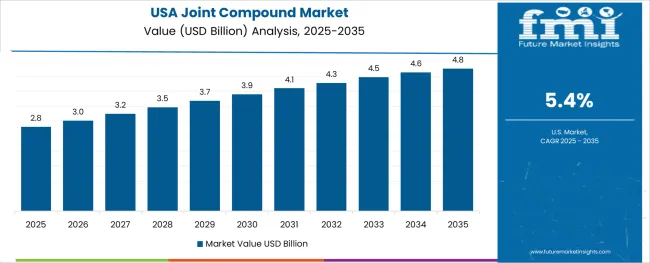
The joint compounds industry in the USA is expanding at a CAGR of 5.4%, supported by the country's substantial residential repair and remodeling market representing ongoing investment in existing housing stock improvements, strong DIY home improvement activity through retail home centers, and increasing contractor adoption of dust-control and low-dust formulations addressing OSHA workplace safety regulations and worker health protection. The nation's mature construction industry and sophisticated building material distribution infrastructure are maintaining robust joint compound demand. Professional contractors and homeowners are specifying performance-enhanced formulations.
Rising homeowner investment in interior renovations and growing preference for professional-grade finishing materials among DIY users are creating demand for ready-mix compounds with superior application characteristics and finish quality. Strong regulatory environment regarding workplace dust exposure and comprehensive product selection through professional and retail channels are supporting adoption of specialty formulations including lightweight, dust-control, and quick-dry products across residential and commercial drywall finishing operations.
The joint compounds industry in China is growing at a CAGR of 5.3%, driven by the country's extensive multifamily residential tower construction in urban development zones, substantial commercial interior fit-out activity in office and retail sectors, and growing adoption of lightweight joint compound formulations supporting contractor productivity and finish quality objectives in high-rise drywall installations. China's massive construction scale and modernizing building practices are driving significant joint compound consumption. Domestic manufacturers and international suppliers are establishing comprehensive market presence.
Rising building interior finish quality expectations and expanding drywall installation adoption in residential and commercial construction are creating substantial opportunities for ready-mix joint compound consumption throughout major urban markets. Growing contractor sophistication and increasing availability of specialty formulations are supporting market development beyond commodity products toward performance-differentiated solutions addressing application efficiency and quality requirements.
The joint compounds market in Turkey is expanding at a CAGR of 5.2%, supported by the country's extensive earthquake reconstruction programs requiring rapid residential building replacement in affected regions, continuing urban development supporting population growth and economic expansion, and modernizing construction practices incorporating drywall systems requiring joint compound finishing materials. Turkey's strategic construction activity and building technology advancement are driving steady market growth. Construction companies and material suppliers are maintaining comprehensive product availability.
Government-supported reconstruction initiatives and private sector urban development projects are creating sustained demand for drywall finishing materials across residential and commercial construction sectors. Growing contractor adoption of efficient construction methods and expanding building material distribution infrastructure are supporting joint compound market development throughout major urban regions and reconstruction zones.
Demand for joint compounds in the United Kingdom is growing at a CAGR of 4.9%, driven by the country's comprehensive residential retrofit and renovation programs targeting existing housing stock improvements, expanding modular and prefabricated construction methods incorporating factory-finished and field-finished drywall assemblies, and contractor preference for dust-control formulations addressing urban jobsite constraints and worker protection requirements. The UK's emphasis on building renovation and construction innovation are supporting steady market demand. Contractors and builders are specifying performance-optimized products.
Rising residential improvement expenditure and growing adoption of off-site construction methods are creating opportunities for joint compound consumption across renovation projects and modular building assembly operations. Strong contractor focus on productivity enhancement and regulatory compliance combined with sophisticated building material distribution networks are supporting adoption of specialty ready-mix formulations throughout residential and commercial construction markets.
Demand for joint compounds in Germany is expanding at a CAGR of 4.8%, supported by the country's comprehensive building energy retrofit programs requiring interior renovation work including drywall installation and finishing, stringent low-VOC and indoor air quality specifications in public buildings including schools and healthcare facilities, and established drywall construction practices across residential and commercial sectors. Germany's commitment to building energy efficiency and environmental quality are driving consistent joint compound demand. Building contractors and material specifiers are prioritizing certified low-emission products.
Government incentive programs for building energy improvements and comprehensive environmental product certification requirements are creating demand for low-VOC and environmentally preferable joint compound formulations across public sector construction and renovation projects. Strong technical standards and contractor quality expectations are supporting premium product positioning and specialty formulation adoption throughout German construction markets.
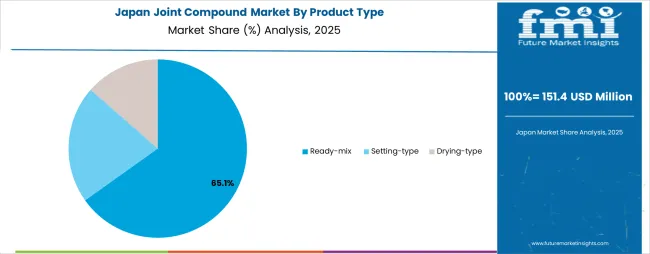
The joint compound market in Japan is growing at a CAGR of 4.7%, driven by the country's ongoing urban redevelopment projects including aging building replacement and modernization in major metropolitan areas, stringent interior finish quality standards requiring superior surface preparation and finishing materials, and contractor adoption of quick-set and fast-dry formulations supporting compressed project schedules in renovation and commercial fit-out applications. Japan's emphasis on construction quality and project efficiency are supporting steady market growth. Contractors and building owners are specifying high-performance products.
Traditional emphasis on finish quality combined with modern schedule pressures are creating opportunities for specialty joint compound formulations enabling both superior surface quality and accelerated application cycles. Strong contractor technical sophistication and comprehensive product selection through specialized distribution channels are supporting adoption of application-optimized formulations throughout residential and commercial interior finishing operations.
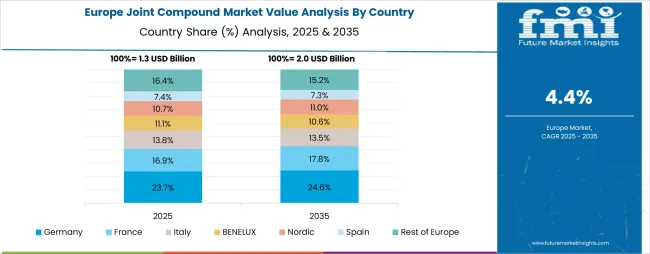
Europe accounts for an estimated 27.0% of global joint compound spend in 2025, representing significant market concentration driven by extensive renovation and retrofit activity, stringent environmental product specifications, and mature drywall construction practices throughout the region.
Within Europe, Germany leads with approximately 18.0% of regional consumption, supported by strong renovation programs targeting existing building stock improvements, premium low-VOC product specifications meeting stringent German environmental standards, and high contractor density maintaining robust construction activity. The United Kingdom follows with approximately 16.0% market share, driven by housing retrofit initiatives, expanding modular building construction, and contractor preference for dust-control formulations addressing urban jobsite constraints and regulatory requirements.
France holds approximately 15.0% of European demand, supported by office refurbishment activity, hospitality sector interior fit-outs, and low-emission certification requirements in commercial and institutional construction. Italy contributes approximately 12.0% of regional consumption, driven by seismic upgrade programs and residential remodeling investment. Spain represents approximately 10.0% of the European market, aided by tourism-driven commercial interior projects and growing DIY market participation.
Poland accounts for approximately 8.0% of demand, with accelerating residential construction and expanding retail interior fit-out activity. The Netherlands holds approximately 7.0% of consumption, anchored by high-performance building envelope specifications and comprehensive sustainability label requirements.
The Nordic countries collectively represent approximately 7.0% of European demand, emphasizing low-VOC and mold-resistant compound specifications addressing humid and cold climate conditions requiring moisture management. The Rest of Western and Eastern Europe accounts for approximately 7.0% of regional consumption, expanding through public-sector retrofit programs and fast-track commercial interior construction projects.
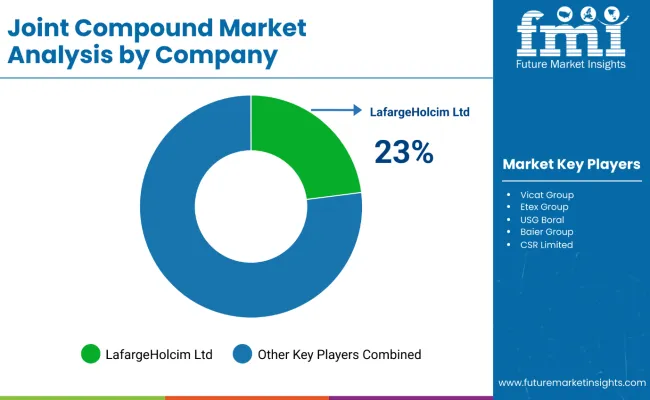
The joint compound market is characterized by competition among established building materials manufacturers, gypsum product specialists, and regional drywall finishing product suppliers. Companies are investing in dust-control technology development, lightweight formulation innovation, sustainable ingredient sourcing, and comprehensive contractor support programs to deliver consistent, high-performance, and application-optimized joint compound solutions. Innovation in low-dust and OSHA-compliant formulations, quick-dry technologies, and environmentally certified products is central to strengthening market position and competitive advantage.
USG Corporation leads the market with a strong 16.0% market share, offering comprehensive joint compound solutions including the Sheetrock brand with emphasis on dust-control formulations, ready-mix convenience products, and professional contractor support through technical resources and training programs serving residential and commercial drywall finishing applications globally.
The company's continued promotion of dust-control compounds addressing OSHA respirable silica requirements demonstrates ongoing commitment to workplace safety advancement and product innovation leadership. Saint-Gobain through its CertainTeed division provides diversified joint compound products including ready-mix and setting-type formulations serving professional and DIY markets. Knauf Gips KG delivers comprehensive gypsum and drywall finishing systems including joint compounds for residential and commercial applications.
National Gypsum under the ProForm brand offers regionally tailored ready-mix product portfolios with expanded finish-level selection guidance supporting contractor specification and application optimization. Georgia-Pacific provides joint compound solutions integrated with comprehensive building products portfolios. Etex Group through its Siniat brand focuses on European markets with environmentally certified formulations meeting regional low-VOC and sustainability requirements.
| Items | Values |
|---|---|
| Quantitative Units (2025) | USD 5.5 billion |
| Product Type | Ready-mix (All-purpose, Lightweight, Dust-control, Taping/Finishing), Setting-type, Drying-type |
| End Use/Application | Residential Construction (New Build, Repair/Remodel), Commercial, Institutional, Industrial |
| Distribution Channel | Pro/Contractor Channels (Specialty Dealers, Direct-to-Contractor), Home Centers/DIY, Builder/Wholesale, E-commerce |
| Formulation Attribute | Low-dust/OSHA-friendly, Low-VOC Certified, Mold/Mildew-resistant, Quick-dry/Fast-set, Standard |
| Regions Covered | North America, Europe, East Asia, South Asia & Pacific, Latin America, Middle East & Africa |
| Countries Covered | United States, Germany, United Kingdom, France, China, Japan, India, Turkey, Italy, Spain, and 40+ countries |
| Key Companies Profiled | USG Corporation, Saint-Gobain (CertainTeed), Knauf Gips KG, National Gypsum (ProForm), Georgia-Pacific, and Etex Group |
| ional Attributes | Dollar sales by product type, end use, and distribution channel category, regional demand trends, competitive landscape, technological advancements in dust-control formulations, lightweight technologies, sustainable ingredients, and specialty performance attributes |
The global joint compound market is estimated to be valued at USD 5.5 billion in 2025.
The market size for the joint compound market is projected to reach USD 9.1 billion by 2035.
The joint compound market is expected to grow at a 5.2% CAGR between 2025 and 2035.
The key product types in joint compound market are ready-mix , setting-type and drying-type.
In terms of end use/application, residential construction segment to command 47.3% share in the joint compound market in 2025.


Full Research Suite comprises of:
Market outlook & trends analysis
Interviews & case studies
Strategic recommendations
Vendor profiles & capabilities analysis
5-year forecasts
8 regions and 60+ country-level data splits
Market segment data splits
12 months of continuous data updates
DELIVERED AS:
PDF EXCEL ONLINE
Ready Mix Joint Compound Market Size and Share Forecast Outlook 2025 to 2035
Demand for Joint Compound in EU Size and Share Forecast Outlook 2025 to 2035
Latin America Joint Compound Industry Analysis Size and Share Forecast Outlook 2025 to 2035
Joint Reconstruction Devices Market Size and Share Forecast Outlook 2025 to 2035
Joint Replacement Market Trends - Growth & Forecast 2025 to 2035
Bone and Joint Health Supplement Market Analysis by Product Type, Form and Sale Channels Through 2035
Universal Joint Shafts Market
Plastic Pipe Jointing and Welding Market
Bridge Expansion Joints Market Growth - Trends & Forecast 2025 to 2035
Rotary and RF Rotary Joints Market Size and Share Forecast Outlook 2025 to 2035
Hot Melt Intermediate Joint Market Size and Share Forecast Outlook 2025 to 2035
Compounds Market Size and Share Forecast Outlook 2025 to 2035
Compound Chocolate Market Analysis - Size, Share, and Forecast Outlook 2025 to 2035
Compound Semiconductor Materials Market Growth - Trends & Forecast 2025 to 2035
Compound Horse Feedstuff Market Analysis by Feed Type, Horse Activity, and Ingredient Composition Through 2035
Compound Feed Market Analysis by Ingredients, Form, Livestock and Region through 2035
Compounded Topical Drugs Market Analysis – Size, Share & Forecast 2024-2034
Compound Semiconductor Market Analysis – Growth & Forecast 2024-2034
Compounding Systems Market
Compounded Bioidentical Hormone Therapy Market

Thank you!
You will receive an email from our Business Development Manager. Please be sure to check your SPAM/JUNK folder too.
Chat With
MaRIA