Rotary and RF Rotary Joints Market Size and Share Forecast Outlook for 2023 to 2033

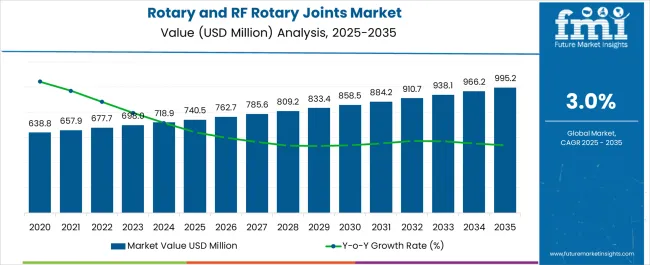
The global rotary and RF rotary joints market is estimated to reach a valuation of USD 698 million in 2023. From 2023 to 2033, the market is likely to experience acceleration at a slow 3% CAGR. This is anticipated to result in a market valuation of USD 938 million in 2033.

Rotary joints, also known as rotating unions, are essentially sealing devices. These devices are used to establish connections between rotating equipment and fixed piping. They serve the purpose of transferring a variety of media such as water, steam, oil, air, and coolants. Multiple passages may be used for designing rotary joints, and they can facilitate the simultaneous management of various media types.

Traditional rotary joints feature spring-loaded seals, which prevent the dispersion of gas or fluid media into the atmosphere. They can be designed to be supported externally through mounting brackets or rods. Alternatively, they can be designed for self-support via internal carbon guides.

Radiofrequency (RF) rotary joints are primarily used for transmitting signals between stationary and movable system parts. These joints are typically used in the aviation industry, where they facilitate the maintenance of firm connections between radar antennas and stationary ground systems. These devices are categorized into:

  • Wave-guided rotary joints
  • Coaxial rotary joints
  • Hybrid rotary joints

Rotary joints consist of several components, such as:

  • Shaft: Shafts are responsible for carrying media into the roll or drum via rotary joints. Typically, they turn simultaneously with the roll or drum. However, in large rotary joints, shafts may be stationary. Seals and bearings are typically assembled around shafts.
  • Housing: Housings function by holding rotary joints’ elements together. They feature inlet ports, which are threaded ports. Hoses that supply media are attached to these ports. The housings may be stationary or moving, depending on the size of the rotary joint.
  • Mechanical seal: Mechanical seals are often referred to as rotary joints’ hearts. Their primary function is to stop media from leaking or dispersing during operation. Typically, a rotary joint features multiple mechanical seals.
  • Bearing: Bearings are among the most important parts of rotary joints. More often than not, rotary joints feature multiple bearings. They facilitate the rotation of other components such as housings and shafts.
Attributes Key Insights
Estimated Rotary and RF Rotary Joints Market Value (2023) USD 698 million
Projected Market Value (2033) USD 938 million
Value-based CAGR (2023 to 2033) 3%
Top Players Share in 2022 1.9%

Historical (2018–2022) vs. Forecasted (2023–2033) Performance of Rotary and RF Rotary Joints Market

According to leading market intelligence firm Future Market Insights (FMI), the market for rotating and RF rotating unions registered a slow 3.5% CAGR from 2018 to 2022. In 2022, the market was observed to have reached a valuation of USD 668 million. The 3% CAGR predicted between 2023 and 2033 reflects a marginal decline in the rate of acceleration. However, this decline is not likely to stall the market’s expansion significantly.

Based on media, oil was the most dominant from 2018 to 2022 as it registered a 3.4% CAGR. From 2023 to 2033, FMI anticipates, this segment to accelerate at a 2.9% CAGR. On the basis of application, military emerged as the leading segment between 2018 and 2022 with a 3.3% CAGR. Between 2023 and 2033, the segment is slated to record a CAGR of 2.8%.

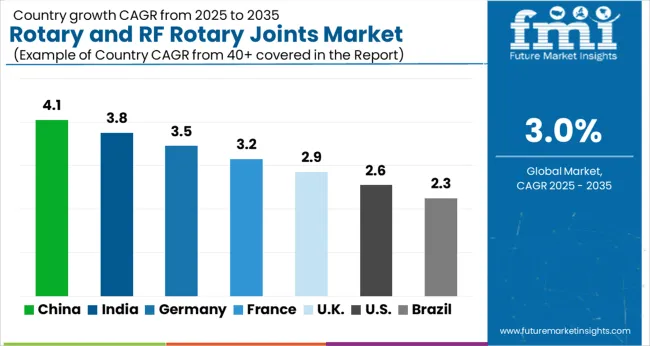
The United States, the United Kingdom, China, Japan, and South Korea were the leading markets for RF rotating and rotating unions from 2018 to 2022. FMI anticipates these countries to keep dominating the worldwide market in the coming years. However, their CAGRs are likely to dip compared to their rate of acceleration between 2018 and 2022.

From 2023 to 2033, FMI anticipates the expansion of the rotary and RF rotary joints market to generate an absolute dollar opportunity amounting to USD 240 million. Even though the expected rate of market expansion is set to be slow, FMI believes that there will be lucrative opportunities for players.

Key Drivers Accelerating Growth in the Global Rotary and RF Rotary Joints Industry

Rapidly Expanding Satellite Communications and Military Applications to Drive Rotary and RF Rotary Joints Demand

Rotary and RF rotary joints are useful in controlling the parameters like operating pressures of the machines working in the factories, temperature, speeds of machines and spaces required for the machines. These devices help in reducing the maintenance costs. They also improve the safety and efficiency while handling a variety of equipment. They are primarily leveraged across commercial and military applications. They are widely used in industries such as aerospace, food & beverage, industrial automation, oil & gas, semiconductors, energy, and medical.

In satellite communication, the communication between a vehicle in movement and a satellite is set up using rotary and RF rotary joints. In military applications of satellites, rotary joints are widely used. Countries like India, Russia and China are proactively engaged in launching satellites, which require rotary and RF rotary joints to establish communication.

In military applications, rotary joints can move the vehicle mounted cameras for army personnel while RF rotary joints are used in underwater radar systems in naval forces. As per the International Institute for Strategic Studies (IISS), the global defense investments amounted to USD 1.3 trillion in year 2021. Such massive spending on defense equipment is likely to trigger the expansion of the rotating and RF rotating joints market.
Leading Countries Supporting Infrastructure Development in Rotary and RF Rotary Joints

Why is the United States Projected to Offer Lucrative Opportunities to Rotary and RF Rotary Joints Companies?

Presence of Prominent Rotary and RF Rotary Joints Manufacturers in the United States to Make it a Lucrative Market

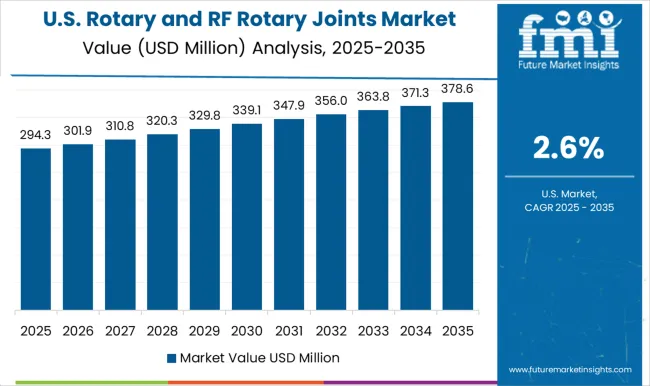
According to FMI, North America is slated to assert its dominance on the global market for rotary and RF rotary joints between 2023 and 2033. In North America, the United States market is likely to reach a valuation of USD 284.1 million in 2033. The market is also poised to generate an absolute dollar opportunity worth USD 50.6 million in the coming years. A sluggish 1.9% CAGR is set to take the United States market forward.

For instance, Rotary Systems Inc is a prominent rotary and RF rotary joints manufacturer based in the United States’ Minnesota. It develops single passage rotary joints such as 90 degree rotary union, high speed coolant unions, hydrostatic swivel union and high speed air/hydraulic rotary union. In multi passage rotary joints, the company manufactures 12 pass flange mount rotary union that is used in commercial and industrial applications. Because of presence of such manufacturers in North America, the expansion of the regional market looks inevitable.

What Does the Future Hold for the United Kingdom Market for Rotary and RF Rotary Joints?

Proactive Efforts of Manufacturers in the United Kingdom to Create Innovative Rotating and RF Rotating Unions to Drive Market

The United Kingdom market for rotary and RF rotary joints is set to be valued at USD 43.6 million in 2033. The United Kingdom has registered expansion at a sluggish CAGR of 2.4% from 2018 to 2022. Between 2023 and 2033, it is expected to accelerate further at a marginally reduced CAGR of 2.2%.

Solid presence of rotating and RF rotating companies in the United Kingdom is undoubtedly helping the market. For instance, Cobham Limited is a reputed aerospace equipment manufacturing company based in the United Kingdom. The company has developed slip ring rotary joints that are used across military and defense applications. These joints are fitted on radar systems and they enable transmission of power, signals and include high frequency channel.

Why is China Anticipated to be Among the Leaders in the Asia Market for Rotary and RF Rotary Joints?

Chinese Manufacturers’ Focus on Designing Products for the Medical Industry to Boost Rotary and RF Rotary Joints Sales

China market for rotary and RF rotary joints is anticipated to reach a valuation of USD 80.3 million in 2033. The market is set to generate an absolute dollar opportunity of USD 25.4 million from 2023 to 2033. Between 2018 and 2022, a steady 5.0% CAGR facilitated the market’s expansion. However, from 2023 to 2033, the rate of acceleration is likely to decline to around 3.9% CAGR.

Tengxuan Technology Limited Company is a Jiangsu, China based rotary joints and sealing technologies manufacturer. It specializes in water rotary joints for medical industry and its flagship product line is the GC series coolants rotary joints unions. The company also develops GS series steam rotary joints, QQ series steam rotary joints and hydraulic central rotary joints that are used across several industrial and defense applications.

Category-Level Insights into Rotary and RF Rotary Joints Industry by Type and Functionality

Why is the Military Segment Anticipated to Dominate the Market for Rotary and RF Rotary Joints Based on Application?

Substantial Investments in Defense Sector to Spur Rotary and RF Rotary Joints Sales

On the basis of application, FMI expects the military segment to lead rotary and RF rotary joints sales. The segment recorded a slow CAGR of 3.3% from 2018 to 2022 and is expected to register a sluggish 2.8% CAGR from 2023 to 2033.

For instance, Dynamic Sealing Technologies Incorporation, a rotary joints manufacturer based in the United States, provides fluid rotary joints for radar cooling systems. These rotary and RF rotary joints are widely used in land combat and transportation vehicles, and across defense manufacturing and testing.

How is Oil Poised to Lead the Market for Rotary and RF Rotary Joints Based on Media?

Expanding Global Oil Sector to Generate Significant Demand for Rotary and RF Rotary Joints

According to FMI, oil is likely to lead the market for rotary and RF rotary joints on the basis of media. Between 2018 and 2022, the segment registered a 3.4% CAGR. From 2023 and 2033, FMI predicts a 2.9% CAGR to facilitate the segment’s acceleration.

The global oil sector is poised to substantially expand in the coming years. This expansion looks set to benefit the rotating and RF rotating unions industry in the years to come. The devices have a diverse array of applications in the oil sector, and its expansion is poised to drive demand.
Competitive Landscape of the Global Rotary and RF Rotary Joints Market

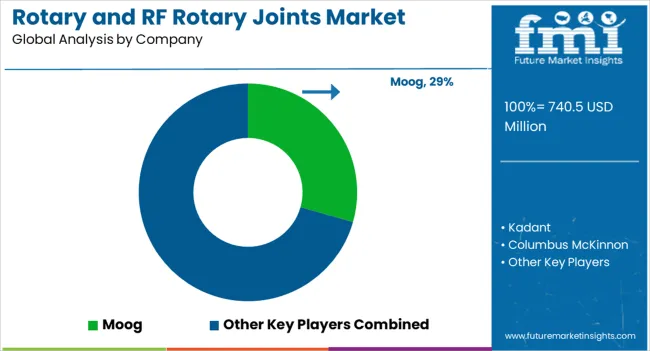
Key players in rotary and RF rotary joints market include Moog, Kadant, Columbus McKinnon, Spinner GmbH, Cobham, API technologies, Dynamic Sealing technology incorporation, Deublin Company, Pasternack, Moflon Technology, Tengxuan technologies and MacArtney Underwater technologies group.

FMI expects these prominent companies to engage in acquisitions. Production facility upgrades are also likely as key players ramp up efforts to meet escalating demand for rotary and RF rotary joints.

For instance:

  • In February 2022, Moog Incorporation announced the acquisition of Dublin based TEAM Accessories, which is an aerospace testing and repair company. The deal took place at an undisclosed amount. TEAM Accessories specialises in maintenance, repair and high value accessories for jet engines. The acquisition is expected to help Moog Inc to provide integrated component support solution to airline companies.
  • In August 2021, Dynamic Sealing Technologies Incorporation (DSTI) announced an upgrade of the wind tunnel testing system of the Arnold Engineering Development Complex (AEDC), which is located in Arnold Air Force Base in Tennessee, USA. The engineers’ team of DSTI had a creative solution for high pressure, high-flow volume air/gas using their newly developed rotary joints. The design expected to be developed by DSTI engineers was complex and within stringent designing criteria. The newly designed system has doubled the capabilities that are required for the tests of the defense weapon systems. The delivered project system runs at MACH speed.

Scope and Coverage of the Rotary and RF Rotary Joints Industry Report

Attribute Details
Estimated Market Size (2023) USD 698.0 million
Projected Market Size (2033) USD 938.0 million
Anticipated Growth Rate (2023 to 2033) 3% CAGR
Forecast Period 2023 to 2033
Historical Data Available for 2018 to 2022
Market Analysis USD million for Value
Key Regions Covered North America; Latin America; Europe; East Asia; South Asia; Oceania; and Middle East and Africa
Key Countries Covered The United States, Canada, Brazil, Mexico, Germany, the United Kingdom, France, Spain, Italy, Russia, South Africa, Northern Africa GCC Countries, China, Japan, South Korea, India, Thailand, Malaysia, Indonesia, Australia, and New Zealand
Key Segments Covered Media, Type, Industry, Type (RF Rotary), and Region
Key Companies Profiled Moog; Kadant; Columbus McKinnon; Spinner GmbH; Cobham; API technologies; Dynamic Sealing Technology; Deublin Company; Pasternack; Moflon Technology; Jiangsu Tengxuan Technology; MacArtney Underwater Technology Group
Report Coverage Market Forecast, Company Share Analysis, Competition Intelligence, Drivers, Restraints, Opportunities, and Threats Analysis, Market Dynamics and Challenges, and Strategic Growth Initiatives

Segment-Wise Analysis – by Product Type, by Application, by Industry Vertical in Rotary and RF Rotary Joints Market

By Type:

  • Single Passage Rotary Joints
  • Multi Passage Rotary Joints

By Media:

  • Air
  • Gas
  • Oil
  • Water
  • Steam
  • Coolant

By Industry:

  • Aerospace
  • Food and beverages
  • Industrial automation
  • Oil and Gas
  • Semiconductors
  • Energy
  • Medical

By Type (RF rotary):

  • Coaxial Rotary Joints
  • Wave-guided Rotary Joints
  • Hybrid Rotary Joints

By Application:

  • Military
  • Commercial

By Region:

  • North America
  • Latin America
  • Europe
  • East Asia
  • South Asia
  • Oceania
  • Middle East & Africa

Table of Content

  • 1. Executive Summary | Rotary and RF Rotary Joints Market
  • 2. Market Overview
  • 3. Market Background
  • 4. Global Market Analysis 2017 to 2022 and Forecast, 2023 to 2033
  • 5. Global Market Analysis 2017 to 2022 and Forecast 2023 to 2033, By Type
    • 5.1. Single Passage Rotary Joints
    • 5.2. Multi Passage Rotary Joints
  • 6. Global Market Analysis 2017 to 2022 and Forecast 2023 to 2033, By Media
    • 6.1. Air
    • 6.2. Gas
    • 6.3. Oil
    • 6.4. Water
    • 6.5. Steam
    • 6.6. Coolant
  • 7. Global Market Analysis 2017 to 2022 and Forecast 2023 to 2033, By Industry
    • 7.1. Aerospace
    • 7.2. Food & Beverages
    • 7.3. Industrial Automation
    • 7.4. Oil & Gas
    • 7.5. Semiconductors
    • 7.6. Energy
    • 7.7. Medical
  • 8. Global Market Analysis 2017 to 2022 and Forecast 2023 to 2033, By Type (RF Rotary)
    • 8.1. Coaxial Rotary Joints
    • 8.2. Waveguided Rotary Joints
    • 8.3. Hybrid Rotary Joints
  • 9. Global Market Analysis 2017 to 2022 and Forecast 2023 to 2033, By Application
    • 9.1. Commercial
    • 9.2. Military
  • 10. Global Market Analysis 2017 to 2022 and Forecast 2023 to 2033, By Region
    • 10.1. North America
    • 10.2. Latin America
    • 10.3. Europe
    • 10.4. Asia Pacific
    • 10.5. Middle East and Africa
  • 11. North America Market Analysis 2017 to 2022 and Forecast 2023 to 2033, By Country
  • 12. Latin America Market Analysis 2017 to 2022 and Forecast 2023 to 2033, By Country
  • 13. Europe Market Analysis 2017 to 2022 and Forecast 2023 to 2033, By Country
  • 14. Asia Pacific Market Analysis 2017 to 2022 and Forecast 2023 to 2033, By Country
  • 15. Middle East and Africa Market Analysis 2017 to 2022 and Forecast 2023 to 2033, By Country
  • 16. Key Countries Market Analysis
  • 17. Market Structure Analysis
  • 18. Competition Analysis
    • 18.1. Moog
    • 18.2. Kadant
    • 18.3. Columbus McKinnon
    • 18.4. Spinner GmbH
    • 18.5. Cobham
    • 18.6. API Technologies
    • 18.7. Dynamic Sealing Technologies
    • 18.8. Deublin Company
    • 18.9. Pasternack
    • 18.10. Moflon Technology
    • 18.11. Jiangsu Tengxuan Technology
  • 19. Assumptions & Acronyms Used
  • 20. Research Methodology

List of Tables

Table 1: Global Market Value (US$ Million) Forecast by Region, 2017 to 2033

Table 2: Global Market Volume (Unit) Forecast by Region, 2017 to 2033

Table 3: Global Market Value (US$ Million) Forecast by Type, 2017 to 2033

Table 4: Global Market Volume (Unit) Forecast by Type, 2017 to 2033

Table 5: Global Market Value (US$ Million) Forecast by Media, 2017 to 2033

Table 6: Global Market Volume (Unit) Forecast by Media, 2017 to 2033

Table 7: Global Market Value (US$ Million) Forecast by Industry, 2017 to 2033

Table 8: Global Market Volume (Unit) Forecast by Industry, 2017 to 2033

Table 9: Global Market Value (US$ Million) Forecast by Type (RF Rotary), 2017 to 2033

Table 10: Global Market Volume (Unit) Forecast by Type (RF Rotary), 2017 to 2033

Table 11: Global Market Value (US$ Million) Forecast by Application, 2017 to 2033

Table 12: Global Market Volume (Unit) Forecast by Application, 2017 to 2033

Table 13: North America Market Value (US$ Million) Forecast by Country, 2017 to 2033

Table 14: North America Market Volume (Unit) Forecast by Country, 2017 to 2033

Table 15: North America Market Value (US$ Million) Forecast by Type, 2017 to 2033

Table 16: North America Market Volume (Unit) Forecast by Type, 2017 to 2033

Table 17: North America Market Value (US$ Million) Forecast by Media, 2017 to 2033

Table 18: North America Market Volume (Unit) Forecast by Media, 2017 to 2033

Table 19: North America Market Value (US$ Million) Forecast by Industry, 2017 to 2033

Table 20: North America Market Volume (Unit) Forecast by Industry, 2017 to 2033

Table 21: North America Market Value (US$ Million) Forecast by Type (RF Rotary), 2017 to 2033

Table 22: North America Market Volume (Unit) Forecast by Type (RF Rotary), 2017 to 2033

Table 23: North America Market Value (US$ Million) Forecast by Application, 2017 to 2033

Table 24: North America Market Volume (Unit) Forecast by Application, 2017 to 2033

Table 25: Latin America Market Value (US$ Million) Forecast by Country, 2017 to 2033

Table 26: Latin America Market Volume (Unit) Forecast by Country, 2017 to 2033

Table 27: Latin America Market Value (US$ Million) Forecast by Type, 2017 to 2033

Table 28: Latin America Market Volume (Unit) Forecast by Type, 2017 to 2033

Table 29: Latin America Market Value (US$ Million) Forecast by Media, 2017 to 2033

Table 30: Latin America Market Volume (Unit) Forecast by Media, 2017 to 2033

Table 31: Latin America Market Value (US$ Million) Forecast by Industry, 2017 to 2033

Table 32: Latin America Market Volume (Unit) Forecast by Industry, 2017 to 2033

Table 33: Latin America Market Value (US$ Million) Forecast by Type (RF Rotary), 2017 to 2033

Table 34: Latin America Market Volume (Unit) Forecast by Type (RF Rotary), 2017 to 2033

Table 35: Latin America Market Value (US$ Million) Forecast by Application, 2017 to 2033

Table 36: Latin America Market Volume (Unit) Forecast by Application, 2017 to 2033

Table 37: Europe Market Value (US$ Million) Forecast by Country, 2017 to 2033

Table 38: Europe Market Volume (Unit) Forecast by Country, 2017 to 2033

Table 39: Europe Market Value (US$ Million) Forecast by Type, 2017 to 2033

Table 40: Europe Market Volume (Unit) Forecast by Type, 2017 to 2033

Table 41: Europe Market Value (US$ Million) Forecast by Media, 2017 to 2033

Table 42: Europe Market Volume (Unit) Forecast by Media, 2017 to 2033

Table 43: Europe Market Value (US$ Million) Forecast by Industry, 2017 to 2033

Table 44: Europe Market Volume (Unit) Forecast by Industry, 2017 to 2033

Table 45: Europe Market Value (US$ Million) Forecast by Type (RF Rotary), 2017 to 2033

Table 46: Europe Market Volume (Unit) Forecast by Type (RF Rotary), 2017 to 2033

Table 47: Europe Market Value (US$ Million) Forecast by Application, 2017 to 2033

Table 48: Europe Market Volume (Unit) Forecast by Application, 2017 to 2033

Table 49: Asia Pacific Market Value (US$ Million) Forecast by Country, 2017 to 2033

Table 50: Asia Pacific Market Volume (Unit) Forecast by Country, 2017 to 2033

Table 51: Asia Pacific Market Value (US$ Million) Forecast by Type, 2017 to 2033

Table 52: Asia Pacific Market Volume (Unit) Forecast by Type, 2017 to 2033

Table 53: Asia Pacific Market Value (US$ Million) Forecast by Media, 2017 to 2033

Table 54: Asia Pacific Market Volume (Unit) Forecast by Media, 2017 to 2033

Table 55: Asia Pacific Market Value (US$ Million) Forecast by Industry, 2017 to 2033

Table 56: Asia Pacific Market Volume (Unit) Forecast by Industry, 2017 to 2033

Table 57: Asia Pacific Market Value (US$ Million) Forecast by Type (RF Rotary), 2017 to 2033

Table 58: Asia Pacific Market Volume (Unit) Forecast by Type (RF Rotary), 2017 to 2033

Table 59: Asia Pacific Market Value (US$ Million) Forecast by Application, 2017 to 2033

Table 60: Asia Pacific Market Volume (Unit) Forecast by Application, 2017 to 2033

Table 61: Middle East and Africa Market Value (US$ Million) Forecast by Country, 2017 to 2033

Table 62: Middle East and Africa Market Volume (Unit) Forecast by Country, 2017 to 2033

Table 63: Middle East and Africa Market Value (US$ Million) Forecast by Type, 2017 to 2033

Table 64: Middle East and Africa Market Volume (Unit) Forecast by Type, 2017 to 2033

Table 65: Middle East and Africa Market Value (US$ Million) Forecast by Media, 2017 to 2033

Table 66: Middle East and Africa Market Volume (Unit) Forecast by Media, 2017 to 2033

Table 67: Middle East and Africa Market Value (US$ Million) Forecast by Industry, 2017 to 2033

Table 68: Middle East and Africa Market Volume (Unit) Forecast by Industry, 2017 to 2033

Table 69: Middle East and Africa Market Value (US$ Million) Forecast by Type (RF Rotary), 2017 to 2033

Table 70: Middle East and Africa Market Volume (Unit) Forecast by Type (RF Rotary), 2017 to 2033

Table 71: Middle East and Africa Market Value (US$ Million) Forecast by Application, 2017 to 2033

Table 72: Middle East and Africa Market Volume (Unit) Forecast by Application, 2017 to 2033

List of Figures

Figure 1: Global Market Value (US$ Million) by Type, 2023 to 2033

Figure 2: Global Market Value (US$ Million) by Media, 2023 to 2033

Figure 3: Global Market Value (US$ Million) by Industry, 2023 to 2033

Figure 4: Global Market Value (US$ Million) by Type (RF Rotary), 2023 to 2033

Figure 5: Global Market Value (US$ Million) by Application, 2023 to 2033

Figure 6: Global Market Value (US$ Million) by Region, 2023 to 2033

Figure 7: Global Market Value (US$ Million) Analysis by Region, 2017 to 2033

Figure 8: Global Market Volume (Unit) Analysis by Region, 2017 to 2033

Figure 9: Global Market Value Share (%) and BPS Analysis by Region, 2023 to 2033

Figure 10: Global Market Y-o-Y Growth (%) Projections by Region, 2023 to 2033

Figure 11: Global Market Value (US$ Million) Analysis by Type, 2017 to 2033

Figure 12: Global Market Volume (Unit) Analysis by Type, 2017 to 2033

Figure 13: Global Market Value Share (%) and BPS Analysis by Type, 2023 to 2033

Figure 14: Global Market Y-o-Y Growth (%) Projections by Type, 2023 to 2033

Figure 15: Global Market Value (US$ Million) Analysis by Media, 2017 to 2033

Figure 16: Global Market Volume (Unit) Analysis by Media, 2017 to 2033

Figure 17: Global Market Value Share (%) and BPS Analysis by Media, 2023 to 2033

Figure 18: Global Market Y-o-Y Growth (%) Projections by Media, 2023 to 2033

Figure 19: Global Market Value (US$ Million) Analysis by Industry, 2017 to 2033

Figure 20: Global Market Volume (Unit) Analysis by Industry, 2017 to 2033

Figure 21: Global Market Value Share (%) and BPS Analysis by Industry, 2023 to 2033

Figure 22: Global Market Y-o-Y Growth (%) Projections by Industry, 2023 to 2033

Figure 23: Global Market Value (US$ Million) Analysis by Type (RF Rotary), 2017 to 2033

Figure 24: Global Market Volume (Unit) Analysis by Type (RF Rotary), 2017 to 2033

Figure 25: Global Market Value Share (%) and BPS Analysis by Type (RF Rotary), 2023 to 2033

Figure 26: Global Market Y-o-Y Growth (%) Projections by Type (RF Rotary), 2023 to 2033

Figure 27: Global Market Value (US$ Million) Analysis by Application, 2017 to 2033

Figure 28: Global Market Volume (Unit) Analysis by Application, 2017 to 2033

Figure 29: Global Market Value Share (%) and BPS Analysis by Application, 2023 to 2033

Figure 30: Global Market Y-o-Y Growth (%) Projections by Application, 2023 to 2033

Figure 31: Global Market Attractiveness by Type, 2023 to 2033

Figure 32: Global Market Attractiveness by Media, 2023 to 2033

Figure 33: Global Market Attractiveness by Industry, 2023 to 2033

Figure 34: Global Market Attractiveness by Type (RF Rotary), 2023 to 2033

Figure 35: Global Market Attractiveness by Application, 2023 to 2033

Figure 36: Global Market Attractiveness by Region, 2023 to 2033

Figure 37: North America Market Value (US$ Million) by Type, 2023 to 2033

Figure 38: North America Market Value (US$ Million) by Media, 2023 to 2033

Figure 39: North America Market Value (US$ Million) by Industry, 2023 to 2033

Figure 40: North America Market Value (US$ Million) by Type (RF Rotary), 2023 to 2033

Figure 41: North America Market Value (US$ Million) by Application, 2023 to 2033

Figure 42: North America Market Value (US$ Million) by Country, 2023 to 2033

Figure 43: North America Market Value (US$ Million) Analysis by Country, 2017 to 2033

Figure 44: North America Market Volume (Unit) Analysis by Country, 2017 to 2033

Figure 45: North America Market Value Share (%) and BPS Analysis by Country, 2023 to 2033

Figure 46: North America Market Y-o-Y Growth (%) Projections by Country, 2023 to 2033

Figure 47: North America Market Value (US$ Million) Analysis by Type, 2017 to 2033

Figure 48: North America Market Volume (Unit) Analysis by Type, 2017 to 2033

Figure 49: North America Market Value Share (%) and BPS Analysis by Type, 2023 to 2033

Figure 50: North America Market Y-o-Y Growth (%) Projections by Type, 2023 to 2033

Figure 51: North America Market Value (US$ Million) Analysis by Media, 2017 to 2033

Figure 52: North America Market Volume (Unit) Analysis by Media, 2017 to 2033

Figure 53: North America Market Value Share (%) and BPS Analysis by Media, 2023 to 2033

Figure 54: North America Market Y-o-Y Growth (%) Projections by Media, 2023 to 2033

Figure 55: North America Market Value (US$ Million) Analysis by Industry, 2017 to 2033

Figure 56: North America Market Volume (Unit) Analysis by Industry, 2017 to 2033

Figure 57: North America Market Value Share (%) and BPS Analysis by Industry, 2023 to 2033

Figure 58: North America Market Y-o-Y Growth (%) Projections by Industry, 2023 to 2033

Figure 59: North America Market Value (US$ Million) Analysis by Type (RF Rotary), 2017 to 2033

Figure 60: North America Market Volume (Unit) Analysis by Type (RF Rotary), 2017 to 2033

Figure 61: North America Market Value Share (%) and BPS Analysis by Type (RF Rotary), 2023 to 2033

Figure 62: North America Market Y-o-Y Growth (%) Projections by Type (RF Rotary), 2023 to 2033

Figure 63: North America Market Value (US$ Million) Analysis by Application, 2017 to 2033

Figure 64: North America Market Volume (Unit) Analysis by Application, 2017 to 2033

Figure 65: North America Market Value Share (%) and BPS Analysis by Application, 2023 to 2033

Figure 66: North America Market Y-o-Y Growth (%) Projections by Application, 2023 to 2033

Figure 67: North America Market Attractiveness by Type, 2023 to 2033

Figure 68: North America Market Attractiveness by Media, 2023 to 2033

Figure 69: North America Market Attractiveness by Industry, 2023 to 2033

Figure 70: North America Market Attractiveness by Type (RF Rotary), 2023 to 2033

Figure 71: North America Market Attractiveness by Application, 2023 to 2033

Figure 72: North America Market Attractiveness by Country, 2023 to 2033

Figure 73: Latin America Market Value (US$ Million) by Type, 2023 to 2033

Figure 74: Latin America Market Value (US$ Million) by Media, 2023 to 2033

Figure 75: Latin America Market Value (US$ Million) by Industry, 2023 to 2033

Figure 76: Latin America Market Value (US$ Million) by Type (RF Rotary), 2023 to 2033

Figure 77: Latin America Market Value (US$ Million) by Application, 2023 to 2033

Figure 78: Latin America Market Value (US$ Million) by Country, 2023 to 2033

Figure 79: Latin America Market Value (US$ Million) Analysis by Country, 2017 to 2033

Figure 80: Latin America Market Volume (Unit) Analysis by Country, 2017 to 2033

Figure 81: Latin America Market Value Share (%) and BPS Analysis by Country, 2023 to 2033

Figure 82: Latin America Market Y-o-Y Growth (%) Projections by Country, 2023 to 2033

Figure 83: Latin America Market Value (US$ Million) Analysis by Type, 2017 to 2033

Figure 84: Latin America Market Volume (Unit) Analysis by Type, 2017 to 2033

Figure 85: Latin America Market Value Share (%) and BPS Analysis by Type, 2023 to 2033

Figure 86: Latin America Market Y-o-Y Growth (%) Projections by Type, 2023 to 2033

Figure 87: Latin America Market Value (US$ Million) Analysis by Media, 2017 to 2033

Figure 88: Latin America Market Volume (Unit) Analysis by Media, 2017 to 2033

Figure 89: Latin America Market Value Share (%) and BPS Analysis by Media, 2023 to 2033

Figure 90: Latin America Market Y-o-Y Growth (%) Projections by Media, 2023 to 2033

Figure 91: Latin America Market Value (US$ Million) Analysis by Industry, 2017 to 2033

Figure 92: Latin America Market Volume (Unit) Analysis by Industry, 2017 to 2033

Figure 93: Latin America Market Value Share (%) and BPS Analysis by Industry, 2023 to 2033

Figure 94: Latin America Market Y-o-Y Growth (%) Projections by Industry, 2023 to 2033

Figure 95: Latin America Market Value (US$ Million) Analysis by Type (RF Rotary), 2017 to 2033

Figure 96: Latin America Market Volume (Unit) Analysis by Type (RF Rotary), 2017 to 2033

Figure 97: Latin America Market Value Share (%) and BPS Analysis by Type (RF Rotary), 2023 to 2033

Figure 98: Latin America Market Y-o-Y Growth (%) Projections by Type (RF Rotary), 2023 to 2033

Figure 99: Latin America Market Value (US$ Million) Analysis by Application, 2017 to 2033

Figure 100: Latin America Market Volume (Unit) Analysis by Application, 2017 to 2033

Figure 101: Latin America Market Value Share (%) and BPS Analysis by Application, 2023 to 2033

Figure 102: Latin America Market Y-o-Y Growth (%) Projections by Application, 2023 to 2033

Figure 103: Latin America Market Attractiveness by Type, 2023 to 2033

Figure 104: Latin America Market Attractiveness by Media, 2023 to 2033

Figure 105: Latin America Market Attractiveness by Industry, 2023 to 2033

Figure 106: Latin America Market Attractiveness by Type (RF Rotary), 2023 to 2033

Figure 107: Latin America Market Attractiveness by Application, 2023 to 2033

Figure 108: Latin America Market Attractiveness by Country, 2023 to 2033

Figure 109: Europe Market Value (US$ Million) by Type, 2023 to 2033

Figure 110: Europe Market Value (US$ Million) by Media, 2023 to 2033

Figure 111: Europe Market Value (US$ Million) by Industry, 2023 to 2033

Figure 112: Europe Market Value (US$ Million) by Type (RF Rotary), 2023 to 2033

Figure 113: Europe Market Value (US$ Million) by Application, 2023 to 2033

Figure 114: Europe Market Value (US$ Million) by Country, 2023 to 2033

Figure 115: Europe Market Value (US$ Million) Analysis by Country, 2017 to 2033

Figure 116: Europe Market Volume (Unit) Analysis by Country, 2017 to 2033

Figure 117: Europe Market Value Share (%) and BPS Analysis by Country, 2023 to 2033

Figure 118: Europe Market Y-o-Y Growth (%) Projections by Country, 2023 to 2033

Figure 119: Europe Market Value (US$ Million) Analysis by Type, 2017 to 2033

Figure 120: Europe Market Volume (Unit) Analysis by Type, 2017 to 2033

Figure 121: Europe Market Value Share (%) and BPS Analysis by Type, 2023 to 2033

Figure 122: Europe Market Y-o-Y Growth (%) Projections by Type, 2023 to 2033

Figure 123: Europe Market Value (US$ Million) Analysis by Media, 2017 to 2033

Figure 124: Europe Market Volume (Unit) Analysis by Media, 2017 to 2033

Figure 125: Europe Market Value Share (%) and BPS Analysis by Media, 2023 to 2033

Figure 126: Europe Market Y-o-Y Growth (%) Projections by Media, 2023 to 2033

Figure 127: Europe Market Value (US$ Million) Analysis by Industry, 2017 to 2033

Figure 128: Europe Market Volume (Unit) Analysis by Industry, 2017 to 2033

Figure 129: Europe Market Value Share (%) and BPS Analysis by Industry, 2023 to 2033

Figure 130: Europe Market Y-o-Y Growth (%) Projections by Industry, 2023 to 2033

Figure 131: Europe Market Value (US$ Million) Analysis by Type (RF Rotary), 2017 to 2033

Figure 132: Europe Market Volume (Unit) Analysis by Type (RF Rotary), 2017 to 2033

Figure 133: Europe Market Value Share (%) and BPS Analysis by Type (RF Rotary), 2023 to 2033

Figure 134: Europe Market Y-o-Y Growth (%) Projections by Type (RF Rotary), 2023 to 2033

Figure 135: Europe Market Value (US$ Million) Analysis by Application, 2017 to 2033

Figure 136: Europe Market Volume (Unit) Analysis by Application, 2017 to 2033

Figure 137: Europe Market Value Share (%) and BPS Analysis by Application, 2023 to 2033

Figure 138: Europe Market Y-o-Y Growth (%) Projections by Application, 2023 to 2033

Figure 139: Europe Market Attractiveness by Type, 2023 to 2033

Figure 140: Europe Market Attractiveness by Media, 2023 to 2033

Figure 141: Europe Market Attractiveness by Industry, 2023 to 2033

Figure 142: Europe Market Attractiveness by Type (RF Rotary), 2023 to 2033

Figure 143: Europe Market Attractiveness by Application, 2023 to 2033

Figure 144: Europe Market Attractiveness by Country, 2023 to 2033

Figure 145: Asia Pacific Market Value (US$ Million) by Type, 2023 to 2033

Figure 146: Asia Pacific Market Value (US$ Million) by Media, 2023 to 2033

Figure 147: Asia Pacific Market Value (US$ Million) by Industry, 2023 to 2033

Figure 148: Asia Pacific Market Value (US$ Million) by Type (RF Rotary), 2023 to 2033

Figure 149: Asia Pacific Market Value (US$ Million) by Application, 2023 to 2033

Figure 150: Asia Pacific Market Value (US$ Million) by Country, 2023 to 2033

Figure 151: Asia Pacific Market Value (US$ Million) Analysis by Country, 2017 to 2033

Figure 152: Asia Pacific Market Volume (Unit) Analysis by Country, 2017 to 2033

Figure 153: Asia Pacific Market Value Share (%) and BPS Analysis by Country, 2023 to 2033

Figure 154: Asia Pacific Market Y-o-Y Growth (%) Projections by Country, 2023 to 2033

Figure 155: Asia Pacific Market Value (US$ Million) Analysis by Type, 2017 to 2033

Figure 156: Asia Pacific Market Volume (Unit) Analysis by Type, 2017 to 2033

Figure 157: Asia Pacific Market Value Share (%) and BPS Analysis by Type, 2023 to 2033

Figure 158: Asia Pacific Market Y-o-Y Growth (%) Projections by Type, 2023 to 2033

Figure 159: Asia Pacific Market Value (US$ Million) Analysis by Media, 2017 to 2033

Figure 160: Asia Pacific Market Volume (Unit) Analysis by Media, 2017 to 2033

Figure 161: Asia Pacific Market Value Share (%) and BPS Analysis by Media, 2023 to 2033

Figure 162: Asia Pacific Market Y-o-Y Growth (%) Projections by Media, 2023 to 2033

Figure 163: Asia Pacific Market Value (US$ Million) Analysis by Industry, 2017 to 2033

Figure 164: Asia Pacific Market Volume (Unit) Analysis by Industry, 2017 to 2033

Figure 165: Asia Pacific Market Value Share (%) and BPS Analysis by Industry, 2023 to 2033

Figure 166: Asia Pacific Market Y-o-Y Growth (%) Projections by Industry, 2023 to 2033

Figure 167: Asia Pacific Market Value (US$ Million) Analysis by Type (RF Rotary), 2017 to 2033

Figure 168: Asia Pacific Market Volume (Unit) Analysis by Type (RF Rotary), 2017 to 2033

Figure 169: Asia Pacific Market Value Share (%) and BPS Analysis by Type (RF Rotary), 2023 to 2033

Figure 170: Asia Pacific Market Y-o-Y Growth (%) Projections by Type (RF Rotary), 2023 to 2033

Figure 171: Asia Pacific Market Value (US$ Million) Analysis by Application, 2017 to 2033

Figure 172: Asia Pacific Market Volume (Unit) Analysis by Application, 2017 to 2033

Figure 173: Asia Pacific Market Value Share (%) and BPS Analysis by Application, 2023 to 2033

Figure 174: Asia Pacific Market Y-o-Y Growth (%) Projections by Application, 2023 to 2033

Figure 175: Asia Pacific Market Attractiveness by Type, 2023 to 2033

Figure 176: Asia Pacific Market Attractiveness by Media, 2023 to 2033

Figure 177: Asia Pacific Market Attractiveness by Industry, 2023 to 2033

Figure 178: Asia Pacific Market Attractiveness by Type (RF Rotary), 2023 to 2033

Figure 179: Asia Pacific Market Attractiveness by Application, 2023 to 2033

Figure 180: Asia Pacific Market Attractiveness by Country, 2023 to 2033

Figure 181: Middle East and Africa Market Value (US$ Million) by Type, 2023 to 2033

Figure 182: Middle East and Africa Market Value (US$ Million) by Media, 2023 to 2033

Figure 183: Middle East and Africa Market Value (US$ Million) by Industry, 2023 to 2033

Figure 184: Middle East and Africa Market Value (US$ Million) by Type (RF Rotary), 2023 to 2033

Figure 185: Middle East and Africa Market Value (US$ Million) by Application, 2023 to 2033

Figure 186: Middle East and Africa Market Value (US$ Million) by Country, 2023 to 2033

Figure 187: Middle East and Africa Market Value (US$ Million) Analysis by Country, 2017 to 2033

Figure 188: Middle East and Africa Market Volume (Unit) Analysis by Country, 2017 to 2033

Figure 189: Middle East and Africa Market Value Share (%) and BPS Analysis by Country, 2023 to 2033

Figure 190: Middle East and Africa Market Y-o-Y Growth (%) Projections by Country, 2023 to 2033

Figure 191: Middle East and Africa Market Value (US$ Million) Analysis by Type, 2017 to 2033

Figure 192: Middle East and Africa Market Volume (Unit) Analysis by Type, 2017 to 2033

Figure 193: Middle East and Africa Market Value Share (%) and BPS Analysis by Type, 2023 to 2033

Figure 194: Middle East and Africa Market Y-o-Y Growth (%) Projections by Type, 2023 to 2033

Figure 195: Middle East and Africa Market Value (US$ Million) Analysis by Media, 2017 to 2033

Figure 196: Middle East and Africa Market Volume (Unit) Analysis by Media, 2017 to 2033

Figure 197: Middle East and Africa Market Value Share (%) and BPS Analysis by Media, 2023 to 2033

Figure 198: Middle East and Africa Market Y-o-Y Growth (%) Projections by Media, 2023 to 2033

Figure 199: Middle East and Africa Market Value (US$ Million) Analysis by Industry, 2017 to 2033

Figure 200: Middle East and Africa Market Volume (Unit) Analysis by Industry, 2017 to 2033

Figure 201: Middle East and Africa Market Value Share (%) and BPS Analysis by Industry, 2023 to 2033

Figure 202: Middle East and Africa Market Y-o-Y Growth (%) Projections by Industry, 2023 to 2033

Figure 203: Middle East and Africa Market Value (US$ Million) Analysis by Type (RF Rotary), 2017 to 2033

Figure 204: Middle East and Africa Market Volume (Unit) Analysis by Type (RF Rotary), 2017 to 2033

Figure 205: Middle East and Africa Market Value Share (%) and BPS Analysis by Type (RF Rotary), 2023 to 2033

Figure 206: Middle East and Africa Market Y-o-Y Growth (%) Projections by Type (RF Rotary), 2023 to 2033

Figure 207: Middle East and Africa Market Value (US$ Million) Analysis by Application, 2017 to 2033

Figure 208: Middle East and Africa Market Volume (Unit) Analysis by Application, 2017 to 2033

Figure 209: Middle East and Africa Market Value Share (%) and BPS Analysis by Application, 2023 to 2033

Figure 210: Middle East and Africa Market Y-o-Y Growth (%) Projections by Application, 2023 to 2033

Figure 211: Middle East and Africa Market Attractiveness by Type, 2023 to 2033

Figure 212: Middle East and Africa Market Attractiveness by Media, 2023 to 2033

Figure 213: Middle East and Africa Market Attractiveness by Industry, 2023 to 2033

Figure 214: Middle East and Africa Market Attractiveness by Type (RF Rotary), 2023 to 2033

Figure 215: Middle East and Africa Market Attractiveness by Application, 2023 to 2033

Figure 216: Middle East and Africa Market Attractiveness by Country, 2023 to 2033

Frequently Asked Questions

What is the Size of The Rotary and RF Rotary Joints Market?

In 2023, the market is expected to be worth US$ 698 million.

How the Market Developed in the Past?

From 2018 to 2022, the global market thrived at a 3.5% CAGR.

What is the Market Growth Forecast from 2023 to 2033?

From 2023 to 2033, the market is expected to accelerate at a moderate 3% CAGR.

What is the Growth Outlook of the United States Market?

The United States market is expected to evolve at a slow 1.9% CAGR.

How Big Will the Market Be by 2033?

The market is expected to be around US$ 938 million by 2033.

Explore Semiconductors Insights

Future Market Insights

Rotary and RF Rotary Joints Market