Latin America Joint Compound Industry Outlook from 2023 to 2033

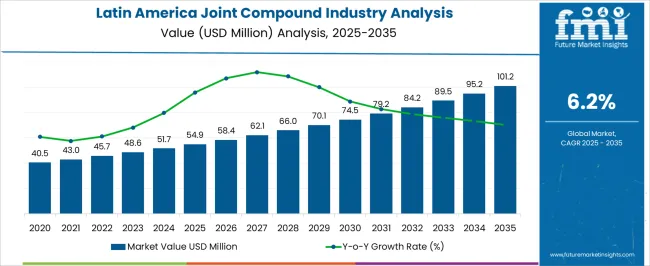
Latin America joint compound industry size reached US$ 46.0 million in 2022. Over the forecast period, joint compound demand in Latin America is anticipated to rise at 6.3% CAGR. The industry is projected to increase from US$ 48.6 million in 2023 to US$ 89.5 million in 2033.

Attributes Key Insights
Base Value (2022) US$ 46.0 million
Estimated Latin America Joint Compound Industry Size (2023) US$ 48.6 million
Projected Latin America Joint Compound Revenue (2033) US$ 89.5 million
Value-based CAGR (2023 to 2033) 6.3%

Don't pay for what you don't need

Customize your report by selecting specific countries or regions and save 30%!

Key Latin America Joint Compound Industry Highlights

  • Industry to Expand Over 2.1x through 2033

Latin America's joint compound industry is predicted to expand over 2.1x through 2033, amid a 5.1% increase in expected CAGR compared to the historical one. This is due to the growing demand for construction and infrastructure development. By 2033, the total industry revenue is set to reach US$ 89.5 million.

Brazil to Lead Latin America Joint Compound Industry

Brazil is expected to dominate the joint compound industry during the forecast period. It is set to hold around 27.4% of Latin America’s industry share in 2033. This is attributed to the following factors:

  • Rising Demand for New Institutional Projects: Several infrastructure projects have been announced in Brazil. These projects are looking to expand their road marking paints and coatings. As the ready-to-mix type joint compound is employed in developing infrastructures, Brazil is expected to rise through the forecast period.
  • Rising Demand for Construction: Urbanization continues to upsurge infrastructure spending, owing to the changing living standards, and in turn, is expanding the population's need for affordable housing and refurbishments.
  • Growing Research and Development: Several players across Latin America are adapting emerging business models to expand their regional footprint and industry share. Collaboration activities enable industry players to ensure growth in the ever-competitive sector. Key players are focusing on research & development activities to create new and advanced compounds fulfilling the increasing needs of consumers.

Based on End-use, Residential Construction is Grabbing the Opportunity

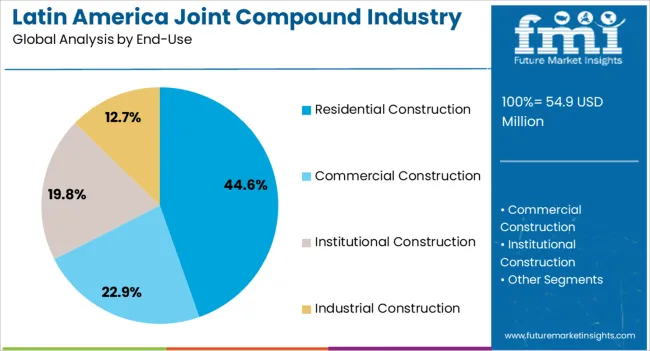
The residential construction segment is expected to dominate Latin America’s joint compound industry with a volume share of 44.7% in 2023. Residential construction is expected to remain the key end-use sector for joint compounds in the region owing to the significant scope of high consumption from the renovation sector.

Historical Latin America Joint Compound Industry Outlook Vs. 2023 to 2033

Joint compound sales in Latin America grew at a CAGR of 1.2% between 2018 and 2022. The industry reached US$ 46.0 million in 2022. In the forecast period, the joint compound industry is set to thrive at a CAGR of 6.3%.

Historical CAGR (2018 to 2022) 1.2%
Forecast CAGR (2023 to 2033) 6.3%

The joint compound industry witnessed moderate growth between 2018 and 2022. This was due to economic growth in emerging industries leading to increased construction and infrastructure development.

The COVID-19 pandemic has adversely affected several industries, including joint compounds, in terms of supply and demand. The pandemic disrupted the supply chains, leading to shortages of raw materials and finished goods. This, in turn, led to a shortage of joint compounds. The pandemic further reduced the demand for joint compounds as the construction industry slowed down due to lockdowns and restrictions.

Future Scope of Latin America Joint Compound Industry

Over the forecast period, Latin America’s joint compound industry is poised to exhibit healthy growth, reaching a valuation of US$ 89.5 million by 2033. The construction industry is expected to showcase growth stability primarily due to rising urbanization in emerging countries across Latin America.

The resurgence of the construction industry in Latin America and notable growth & prospects for new construction in developing and emerging economies are expected to raise the construction industry. This is set to create a high demand for joint compounds in Latin America.

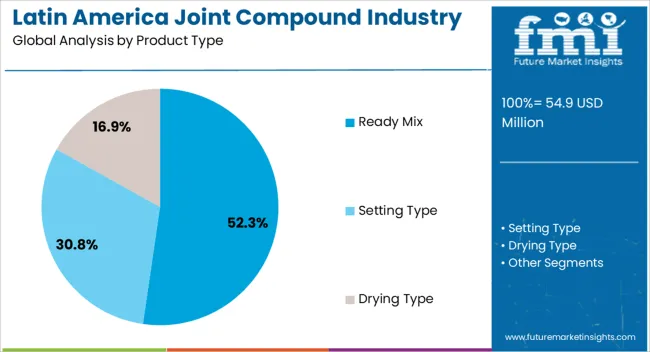
Ready-mix type of joint compound is expected to dominate in terms of product type throughout the forecast period. A ready-mix joint compound is set to be designed for fast application. It has easy maintenance, spreads smoothly, and dries up if left unattended for a long period.

Government investments in infrastructure projects, such as roads, bridges, and public buildings, are further expected to amplify the demand for joint compounds. The construction boom associated with urbanization positions joint compound manufacturers at the forefront, shaping the urban landscape in Latin America. These factors are expected to surge the demand for joint compounds by 2033.

Nikhil Kaitwade
Nikhil Kaitwade

Principal Consultant

Talk to Analyst

Find your sweet spots for generating winning opportunities in this market.

Latin America Joint Compound Industry Trends

  • Across Latin America, the building sector is placing an increasing amount of attention on sustainability. The joint compound industry in Latin America is influenced by a need for sustainable and eco-friendly goods, especially those with low volatile organic compound (VOC) formulations.
  • Construction activity is rising in tandem with the ongoing urbanization of several countries in Latin America. Roads, bridges, commercial buildings, and other infrastructure development projects are increasing the demand for building supplies like joint compounds.
  • As the economy expands, the renovation and remodeling industry experiences high growth. Existing structures are frequently upgraded by firms and homeowners, which presents chances for the joint compound industry to supply materials for these projects.
  • The joint compound industry is investing in research & development to provide products with greater adhesion, faster drying periods, and better environmental features.

Key Factors Restraining Latin America's Joint Compound Industry Growth

  • Changes in the region's economy are set to affect the building sector and the demand for joint compounds. The expansion of the joint compound industry is expected to be restricted by economic downturns due to decreased investment in infrastructure projects and building activity.
  • The price of raw materials is set to alter due to fluctuations in exchange rates, which can affect the cost of manufacturing joint compounds. Manufacturers are expected to have difficulties and price uncertainty, particularly if they depend on imported supplies.
  • Shortages of raw materials or delays in the production process can result from supply chain disruptions brought on by natural catastrophes, geopolitical events, or other causes. The manufacturing and accessibility of joint compounds on the industry is set to be impacted by such interruptions.

Get the data you need at a Fraction of the cost

Personalize your report by choosing insights you need
and save 40%!

Country-wise Insights

The below table shows the estimated growth rates of the top five countries. Mexico, Colombia, and Peru are set to record high CAGRs of 7.3%, 6.9%, and 6.6%, respectively, through 2033.

Countries Projected Joint Compound CAGR (2023 to 2033)
Brazil 4.6%
Mexico 7.3%
Colombia 6.9%
Argentina 5.4%
Peru 6.6%

Booming Construction Sector to Boost Sales of Joint Compounds in Brazil

Over the assessment period, demand for joint compounds in Brazil is set to rise at 4.6% CAGR. Here are the trends enhancing the industry in Brazil:

  • Brazil boasts a substantial and ever-growing construction sector, propelled by the advancement of infrastructure, residential developments, and commercial buildings. The state of the construction industry as a whole directly impacts the demand for joint compounds.
  • Brazil's urbanization tendencies increase the country's need for infrastructure and housing. There are prospects for joint compound use in drywall applications because of the need for residential and commercial structures.
  • The government of Brazil started infrastructure projects to promote economic growth. The need for joint compounds and other building materials is expected to be driven by large-scale projects in the energy, transportation, and public facilities sectors.

Increasing Sustainable Construction Techniques Spurring Growth in Mexico

Over the forecast period, joint compound industry in Mexico is set to increase at a robust CAGR of 7.3%. A handful of the trends are as follows:

  • In Mexico, there is a growing emphasis on ecologically friendly building techniques and sustainability. Manufacturers of joint compounds are providing goods with less environmental effects.
  • Mexico's joint compound industry will likely be competitive with domestic and foreign producers. To preserve or increase their share, companies are investing in marketing to distinguish their products and offer competitive pricing.
  • Implementing joint compound formulation advancements and modern production technology are improving product quality and performance. Research and development spending by manufacturers is helping them with a competitive edge.

Colombia to Remain at the Epicentre of Joint Compound Manufacturing

By 2033, joint compound industry demand in Colombia is expected to surge at a CAGR of 6.9%. A handful of the factors are as follows:

  • Colombia's economic circumstances is influencing the joint compound sector as well as the building industry. Interest rates, inflation, and GDP growth are a few variables affecting construction project investments.
  • In the construction sector, compliance with building standards and regulations is essential in Colombia. Modifications to environmental regulations or new regulatory criteria are influencing joint compound manufacturing and usage.

Category-wise Insights

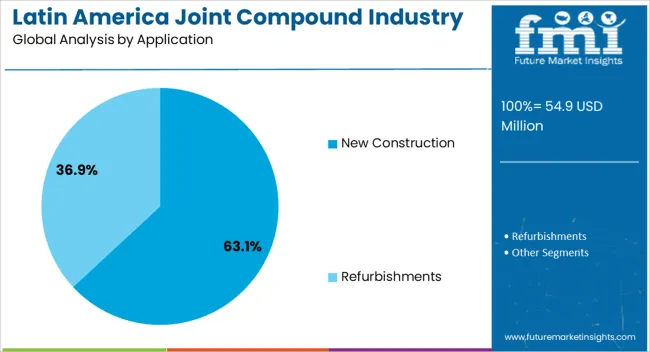
The section below shows the ready mix segment dominating based on product type. It is forecast to thrive at a 6.5% CAGR between 2023 and 2033. Based on application, the new construction segment is anticipated to hold a dominant share through 2033. It is set to exhibit a CAGR of 6.6% during the forecast period.

Ready Mix to Exhibit Exponential Demand in Latin America

Top Segment (Product Type) Ready Mix
Predicted CAGR (2023 to 2033) 6.5%

Convenience is one of the key benefits of ready mix joint compounds. They save building time and effort by doing away with the requirement for on-site mixing. By using these chemicals directly, contractors are set to cut down on labor-intensive preparatory work.

Ready-mix joint compounds are produced in a controlled environment to provide a reliable and homogenous result. This uniformity plays a crucial part in the joint compound's dependability regarding workability, drying properties, and adhesion.

Ready mix joint compounds come in a range of formulas to suit different requirements. They can be divided into groups according to how quickly they dry, such as lightweight or quick-setting compounds.

As these materials are so versatile, contractors select this ideal compound for several applications. Over the forecast period, the ready mix segment is expected to rise at a CAGR of 6.5%.

Demand for Joint Compounds to Remain High in New Construction Application

Top Segment (Application) New Construction
Projected CAGR (2023 to 2033) 6.6%

In order to eliminate significant gaps and create a seamless look, a joint compound is put over joint tapes to produce a smooth, continuous surface. Sometimes, in new construction, drywall surfaces need to be repaired because of dents, nicks, or other flaws.

The surfaces are patched and repaired with joint compounds. Joint compound is estimated to be extensively used in new construction because of their adaptability, cost-effectiveness, and versatility. The new construction segment is projected to thrive at a 6.6% CAGR during the forecast period.

Competitive Landscape

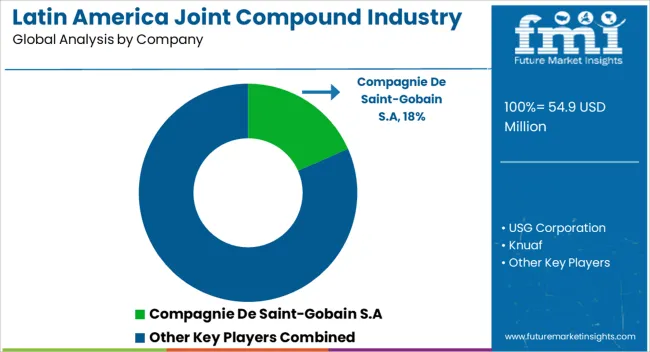
The joint compound industry in Latin America is highly consolidated, with leading players accounting for 35.1% share. Companies such as de Saint-Gobain S.A, USG Corporation, Knauf, Dryvitex, Supermastick S.A.S, Durlock, and ProForm Finishing Products LLC are the leading manufacturers and suppliers of joint compounds listed in the report.

Key joint compound companies are investing in continuous research to produce new products and increase their capacity to meet end-user demand. They are also inclined toward adopting strategies to strengthen their footprint, including acquisitions, partnerships, mergers, and facility expansions.

Leading Companies

  • USG Corporation: With cutting-edge technology and design, USG provides high-performance construction systems and solutions for interior walls, facades, ceilings, and floor levelers. Energy economy, safety, improved seismic performance, fire resistance, and longevity are all guaranteed when working with USG on any project.
  • Cemix: The company provides creative solutions that make building easy. In the wall covering, waterproofing, maintaining, repairing, concrete painting, and installing ceramics & marble applications, Cemix is a significant participant in Latin America.

Scope of the Report

Attribute Details
Estimated Value (2023) US$ 48.6 million
Projected Value (2033) US$ 89.5 million
Anticipated Growth Rate (2023 to 2033) 6.3%
Historical Data 2018 to 2022
Forecast Period 2023 to 2033
Quantitative Units Value (US$ million) and Volume (metric tons)
Report Coverage Revenue Forecast, Volume Forecast, Company Ranking, Competitive Landscape, Growth Factors, Trends, and Pricing Analysis
Segments Covered Product Type, End-use, Application, Region
Key Countries Covered Argentina, Brazil, Mexico, Chile, Colombia, Peru, Ecuador, Paraguay, Uruguay, Guatemala, Bolivia, Costa Rica, Rest of Latin America
Key Companies Profiled Compagnie de Saint-Gobain S.A; USG Corporation; Knuaf, Dryvitex; Supermastick S.A.S, Durlock; Votorantim Cimentos; Plaka Group; ASG Plaster; Cemix Mexico S.A. DE C.V; Promat, Gyplac; DAP Products Inc.; Solid Products, Inc.; ProForm Finishing Products LLC

Latin America Joint Compound Industry Segmentation

By Product Type:

  • Ready Mix
  • Setting Type
  • Drying Type

By End-use:

  • Residential Construction
  • Commercial Construction
  • Institutional Construction
  • Industrial Construction

By Application:

  • New Construction
  • Refurbishments

By Country:

  • Argentina
  • Brazil
  • Mexico
  • Chile
  • Colombia
  • Peru
  • Ecuador
  • Paraguay
  • Uruguay
  • Guatemala
  • Bolivia
  • Costa Rica

Frequently Asked Questions

What was the value of the joint compound industry in 2022?

Latin America’s industry was valued at US$ 46.0 million in 2022.

How big was the joint compound industry in 2023?

The industry value reached US$ 48.6 million in 2023.

At what rate will the joint compound industry rise through 2033?

The industry is anticipated to rise at a 6.3% CAGR.

What is the expected industry size in 2033?

Latin America’s joint compound industry size is set to reach US$ 89.5 million by 2033.

Which application segment is expected to lead the industry?

New construction is expected to lead the industry during the forecast period.

Which product type is expected to dominate the industry?

The ready mix segment is expected to dominate the joint compound industry.

Table of Content
1. Executive Summary
    1.1. Latin America Industry Outlook
    1.2. Demand Side Trends
    1.3. Supply Side Trends
    1.4. Technology Roadmap
    1.5. Analysis and Recommendations
2. Industry Overview
    2.1. Industry Coverage / Taxonomy
    2.2. Industry Definition / Scope / Limitations
3. Key Trends
    3.1. Key Trends
    3.2. Product Innovation / Development Trends
4. Key Success Factors
    4.1. Product Adoption / Usage Analysis
    4.2. Product USPs / Features
    4.3. Strategic Promotional Strategies
5. Latin America Industry Demand Analysis 2018 to 2022 and Forecast, 2023 to 2033
    5.1. Historical Volume (metric tons) Analysis, 2018 to 2022
    5.2. Current and Future Volume (metric tons) Projections, 2023 to 2033
    5.3. Y-o-Y Growth Trend Analysis
6. Latin America Industry - Pricing Analysis
    6.1. Country wise Pricing Analysis By Product Type
    6.2. Latin America Average Pricing Analysis Benchmark
7. Latin America Industry Demand (in Value or Size in US$ million) Analysis 2018 to 2022 and Forecast, 2023 to 2033
    7.1. Historical Value (US$ million) Analysis, 2018 to 2022
    7.2. Current and Future Value (US$ million) Projections, 2023 to 2033
        7.2.1. Y-o-Y Growth Trend Analysis
        7.2.2. Absolute $ Opportunity Analysis
8. Industry Background
    8.1. Macro-Economic Factors
        8.1.1. Latin America GDP Growth Outlook
        8.1.2. Latin America Chemical industry Overview
        8.1.3. Manufacturing Value-Added
        8.1.4. Industry Value Added
        8.1.5. Parent Industry Outlook
        8.1.6. Other Macro-Economic Factors
    8.2. Forecast Factors - Relevance & Impact
        8.2.1. Top Companies Historical Growth
        8.2.2. GDP Growth forecast
        8.2.3. Manufacturing Industry forecast
        8.2.4. Latin America Urbanization Growth Outlook
        8.2.5. Business Climate
        8.2.6. Covid-19 Impact Assessment
        8.2.7. End-use Industry Growth Outlook
    8.3. Value Chain
        8.3.1. Product Manufacturers
        8.3.2. End Users
        8.3.3. Avg. Profitability Margins
    8.4. COVID-19 Crisis – Impact Assessment
        8.4.1. Current Statistics
        8.4.2. Short-Mid-Long Term Outlook
        8.4.3. Likely Rebound
    8.5. Industry Dynamics
        8.5.1. Drivers
        8.5.2. Restraints
        8.5.3. Opportunity Analysis
    8.6. Latin America Supply Demand Analysis
    8.7. Key Regulations & Certifications
    8.8. Production Process Overview
    8.9. Trade Scenario
9. Latin America Industry Analysis 2018 to 2022 and Forecast 2023 to 2033, By Product Type
    9.1. Introduction / Key Findings
    9.2. Historical Industry Size (US$ million) and Volume Analysis By Product Type, 2018 to 2022
    9.3. Current and Future Industry Size (US$ million) and Volume Analysis and Forecast By Product Type, 2023 to 2033
        9.3.1. Ready Mix
        9.3.2. Setting Type
        9.3.3. Drying Type
    9.4. Industry Attractiveness Analysis By Product Type
10. Latin America Industry Analysis 2018 to 2022 and Forecast 2023 to 2033, By End Use
    10.1. Introduction / Key Findings
    10.2. Historical Industry Size (US$ million) and Volume Analysis By End Use, 2018 to 2022
    10.3. Current and Future Industry Size (US$ million) and Volume Analysis and Forecast By End Use, 2023 to 2033
        10.3.1. Residential Construction
        10.3.2. Commercial Construction
        10.3.3. Institutional Construction
        10.3.4. Industrial Construction
    10.4. Industry Attractiveness Analysis By End Use
11. Latin America Industry Analysis 2018 to 2022 and Forecast 2023 to 2033, By Application
    11.1. Introduction / Key Findings
    11.2. Historical Industry Size (US$ million) and Volume Analysis By Application, 2018 to 2022
    11.3. Current and Future Industry Size (US$ million) and Volume Analysis and Forecast By Application, 2023 to 2033
        11.3.1. New Construction
        11.3.2. Refurbishments
    11.4. Industry Attractiveness Analysis By Application
12. Latin America Industry Analysis 2018 to 2022 and Forecast 2023 to 2033, by Country
    12.1. Introduction
    12.2. Historical Industry Size (US$ million) and Volume Analysis By Country, 2018 to 2022
    12.3. Current Industry Size (US$ million) and Volume Analysis and Forecast By Country, 2023 to 2033
        12.3.1. Argentina
        12.3.2. Brazil
        12.3.3. Mexico
        12.3.4. Chile
        12.3.5. Colombia
        12.3.6. Peru
        12.3.7. Ecuador
        12.3.8. Paraguay
        12.3.9. Uruguay
        12.3.10. Guatemala
        12.3.11. Bolivia
        12.3.12. Costa Rica
        12.3.13. Rest of Latin America
    12.4. Industry Attractiveness Analysis By Country
13. Argentina Industry Analysis 2018 to 2022 and Forecast 2023 to 2033
    13.1. Introduction
    13.2. Pricing Analysis
    13.3. Historical Industry Size (US$ million) and Volume Trend Analysis By Taxonomy, 2018 to 2022
    13.4. Industry Size (US$ million) and Volume Forecast By Taxonomy, 2023 to 2033
        13.4.1. By Product Type
        13.4.2. By End Use
        13.4.3. By Application
    13.5. Industry Attractiveness Analysis
        13.5.1. By Product Type
        13.5.2. By End Use
        13.5.3. By Application
    13.6. Industry Trends
    13.7. Key Participants - Intensity Mapping
    13.8. Drivers and Restraints - Impact Analysis
14. Brazil Industry Analysis 2018 to 2022 and Forecast 2023 to 2033
    14.1. Introduction
    14.2. Pricing Analysis
    14.3. Historical Industry Size (US$ million) and Volume Trend Analysis By Taxonomy, 2018 to 2022
    14.4. Industry Size (US$ million) and Volume Forecast By Taxonomy, 2023 to 2033
        14.4.1. By Product Type
        14.4.2. By End Use
        14.4.3. By Application
    14.5. Industry Attractiveness Analysis
        14.5.1. By Product Type
        14.5.2. By End Use
        14.5.3. By Application
    14.6. Industry Trends
    14.7. Key Participants - Intensity Mapping
    14.8. Drivers and Restraints - Impact Analysis
15. Mexico Industry Analysis 2018 to 2022 and Forecast 2023 to 2033
    15.1. Introduction
    15.2. Pricing Analysis
    15.3. Historical Industry Size (US$ million) and Volume Trend Analysis By Taxonomy, 2018 to 2022
    15.4. Industry Size (US$ million) and Volume Forecast By Taxonomy, 2023 to 2033
        15.4.1. By Product Type
        15.4.2. By End Use
        15.4.3. By Application
    15.5. Industry Attractiveness Analysis
        15.5.1. By Product Type
        15.5.2. By End Use
        15.5.3. By Application
    15.6. Industry Trends
    15.7. Key Participants - Intensity Mapping
    15.8. Drivers and Restraints - Impact Analysis
16. Chile Industry Analysis 2018 to 2022 and Forecast 2023 to 2033
    16.1. Introduction
    16.2. Pricing Analysis
    16.3. Historical Industry Size (US$ million) and Volume Trend Analysis By Taxonomy, 2018 to 2022
    16.4. Industry Size (US$ million) and Volume Forecast By Taxonomy, 2023 to 2033
        16.4.1. By Product Type
        16.4.2. By End Use
        16.4.3. By Application
    16.5. Industry Attractiveness Analysis
        16.5.1. By Product Type
        16.5.2. By End Use
        16.5.3. By Application
    16.6. Industry Trends
    16.7. Key Participants - Intensity Mapping
    16.8. Drivers and Restraints - Impact Analysis
17. Colombia Industry Analysis 2018 to 2022 and Forecast 2023 to 2033
    17.1. Introduction
    17.2. Pricing Analysis
    17.3. Historical Industry Size (US$ million) and Volume Trend Analysis By Taxonomy, 2018 to 2022
    17.4. Industry Size (US$ million) and Volume Forecast By Taxonomy, 2023 to 2033
        17.4.1. By Product Type
        17.4.2. By End Use
        17.4.3. By Application
    17.5. Industry Attractiveness Analysis
        17.5.1. By Product Type
        17.5.2. By End Use
        17.5.3. By Application
    17.6. Industry Trends
    17.7. Key Participants - Intensity Mapping
    17.8. Drivers and Restraints - Impact Analysis
18. Peru Industry Analysis 2018 to 2022 and Forecast 2023 to 2033
    18.1. Introduction
    18.2. Pricing Analysis
    18.3. Historical Industry Size (US$ million) and Volume Trend Analysis By Taxonomy, 2018 to 2022
    18.4. Industry Size (US$ million) and Volume Forecast By Taxonomy, 2023 to 2033
        18.4.1. By Product Type
        18.4.2. By End Use
        18.4.3. By Application
    18.5. Industry Attractiveness Analysis
        18.5.1. By Product Type
        18.5.2. By End Use
        18.5.3. By Application
    18.6. Industry Trends
    18.7. Key Participants - Intensity Mapping
    18.8. Drivers and Restraints - Impact Analysis
19. Ecuador Industry Analysis 2018 to 2022 and Forecast 2023 to 2033
    19.1. Introduction
    19.2. Pricing Analysis
    19.3. Historical Industry Size (US$ million) and Volume Trend Analysis By Taxonomy, 2018 to 2022
    19.4. Industry Size (US$ million) and Volume Forecast By Taxonomy, 2023 to 2033
        19.4.1. By Product Type
        19.4.2. By End Use
        19.4.3. By Application
    19.5. Industry Attractiveness Analysis
        19.5.1. By Product Type
        19.5.2. By End Use
        19.5.3. By Application
    19.6. Industry Trends
    19.7. Key Participants - Intensity Mapping
    19.8. Drivers and Restraints - Impact Analysis
20. Paraguay Industry Analysis 2018 to 2022 and Forecast 2023 to 2033
    20.1. Introduction
    20.2. Pricing Analysis
    20.3. Historical Industry Size (US$ million) and Volume Trend Analysis By Taxonomy, 2018 to 2022
    20.4. Industry Size (US$ million) and Volume Forecast By Taxonomy, 2023 to 2033
        20.4.1. By Product Type
        20.4.2. By End Use
        20.4.3. By Application
    20.5. Industry Attractiveness Analysis
        20.5.1. By Product Type
        20.5.2. By End Use
        20.5.3. By Application
    20.6. Industry Trends
    20.7. Key Participants - Intensity Mapping
    20.8. Drivers and Restraints - Impact Analysis
21. Uruguay Industry Analysis 2018 to 2022 and Forecast 2023 to 2033
    21.1. Introduction
    21.2. Pricing Analysis
    21.3. Historical Industry Size (US$ million) and Volume Trend Analysis By Taxonomy, 2018 to 2022
    21.4. Industry Size (US$ million) and Volume Forecast By Taxonomy, 2023 to 2033
        21.4.1. By Product Type
        21.4.2. By End Use
        21.4.3. By Application
    21.5. Industry Attractiveness Analysis
        21.5.1. By Product Type
        21.5.2. By End Use
        21.5.3. By Application
    21.6. Industry Trends
    21.7. Key Participants - Intensity Mapping
    21.8. Drivers and Restraints - Impact Analysis
22. Guatemala Industry Analysis 2018 to 2022 and Forecast 2023 to 2033
    22.1. Introduction
    22.2. Pricing Analysis
    22.3. Historical Industry Size (US$ million) and Volume Trend Analysis By Taxonomy, 2018 to 2022
    22.4. Industry Size (US$ million) and Volume Forecast By Taxonomy, 2023 to 2033
        22.4.1. By Product Type
        22.4.2. By End Use
        22.4.3. By Application
    22.5. Industry Attractiveness Analysis
        22.5.1. By Product Type
        22.5.2. By End Use
        22.5.3. By Application
    22.6. Industry Trends
    22.7. Key Participants - Intensity Mapping
    22.8. Drivers and Restraints - Impact Analysis
23. Bolivia Industry Analysis 2018 to 2022 and Forecast 2023 to 2033
    23.1. Introduction
    23.2. Pricing Analysis
    23.3. Historical Industry Size (US$ million) and Volume Trend Analysis By Taxonomy, 2018 to 2022
    23.4. Industry Size (US$ million) and Volume Forecast By Taxonomy, 2023 to 2033
        23.4.1. By Product Type
        23.4.2. By End Use
        23.4.3. By Application
    23.5. Industry Attractiveness Analysis
        23.5.1. By Product Type
        23.5.2. By End Use
        23.5.3. By Application
    23.6. Industry Trends
    23.7. Key Participants - Intensity Mapping
    23.8. Drivers and Restraints - Impact Analysis
24. Costa Rica Industry Analysis 2018 to 2022 and Forecast 2023 to 2033
    24.1. Introduction
    24.2. Pricing Analysis
    24.3. Historical Industry Size (US$ million) and Volume Trend Analysis By Taxonomy, 2018 to 2022
    24.4. Industry Size (US$ million) and Volume Forecast By Taxonomy, 2023 to 2033
        24.4.1. By Product Type
        24.4.2. By End Use
        24.4.3. By Application
    24.5. Industry Attractiveness Analysis
        24.5.1. By Product Type
        24.5.2. By End Use
        24.5.3. By Application
    24.6. Industry Trends
    24.7. Key Participants - Intensity Mapping
    24.8. Drivers and Restraints - Impact Analysis
25. Rest of Latin America Industry Analysis 2018 to 2022 and Forecast 2023 to 2033
    25.1. Introduction
    25.2. Pricing Analysis
    25.3. Historical Industry Size (US$ million) and Volume Trend Analysis By Taxonomy, 2018 to 2022
    25.4. Industry Size (US$ million) and Volume Forecast By Taxonomy, 2023 to 2033
        25.4.1. By Product Type
        25.4.2. By End Use
        25.4.3. By Application
    25.5. Industry Attractiveness Analysis
        25.5.1. By Product Type
        25.5.2. By End Use
        25.5.3. By Application
    25.6. Industry Trends
    25.7. Key Participants - Intensity Mapping
    25.8. Drivers and Restraints - Impact Analysis
26. Industry Structure Analysis
    26.1. Industry Analysis by Tier of Companies
    26.2. Industry Concentration
    26.3. Industry Share Analysis of Top Players
    26.4. Production Capacity Analysis
    26.5. Industry Presence Analysis
        26.5.1. By Application Footprint of Players
        26.5.2. By Country-wise Footprint of Players
        26.5.3. By Channel Footprint of Players
27. Competition Analysis
    27.1. Competition Dashboard
    27.2. Competition Benchmarking
    27.3. Competition Deep Dive
        27.3.1. Compagnie de Saint-Gobain S.A
            27.3.1.1. Overview
            27.3.1.2. Product Portfolio
            27.3.1.3. Profitability by Segments (Product/Channel/Country)
            27.3.1.4. Sales Footprint
            27.3.1.5. Strategy Overview
        27.3.2. USG Corporation
        27.3.3. Knuaf
        27.3.4. Dryvitex
        27.3.5. Supermastick S.A.S
        27.3.6. Durlock
        27.3.7. Votorantim Cimentos
        27.3.8. Plaka Group
        27.3.9. ASG Plaster
        27.3.10. Cemix Mexico S.A. DE C.V
        27.3.11. Promat
        27.3.12. Gyplac
        27.3.13. DAP Products Inc.
        27.3.14. Solid Products, Inc.
        27.3.15. ProForm Finishing Products, LLC
28. Primary Insights
29. Assumptions and Acronyms Used
30. Research Methodology
Recommendations

Chemicals & Materials

Magnesium Oxide Market

January 2024

REP-GB-1622

204 pages

Chemicals & Materials

Joint Compound Market

June 2023

REP-GB-2442

250 pages

Chemicals & Materials

Compound Semiconductor Materials Market

March 2023

REP-GB-12410

342 pages

Explore Chemicals & Materials Insights

View Reports
Future Market Insights

Joint Compound Industry Analysis in Latin America

Schedule a Call