Reports

- Global Locations -

Headquarters

Future Market Insights, Inc.

Christiana Corporate, 200
Continental Drive, Suite 401,
Newark, Delaware - 19713,
United States

T: +1-845-579-5705

Americas

Future Market Insights, Inc.

616 Corporate Way, Suite 2-9018,
Valley Cottage, NY 10989, United States

T: +1-347-918-3531

MEA

Future Market Insights

1602-6 Jumeirah Bay X2 Tower, Plot No: JLT-PH2-X2A,
Jumeirah Lakes Towers, Dubai,
United Arab Emirates

Europe

Future Market Insights

3rd Floor, 207 Regent Street,
W1B 3HH London
United Kingdom

T: + 44 (0) 20 8123 9659
D: +44 (0) 20 3287 4268

Asia Pacific

Future Market Insights

IndiaLand Global Tech Park, Unit UG-1, Behind Grand HighStreet, Phase 1, Hinjawadi, MH, Pune – 411057, India

Latin America Hydraulic Filtration Market Outlook (2022 to 2032)

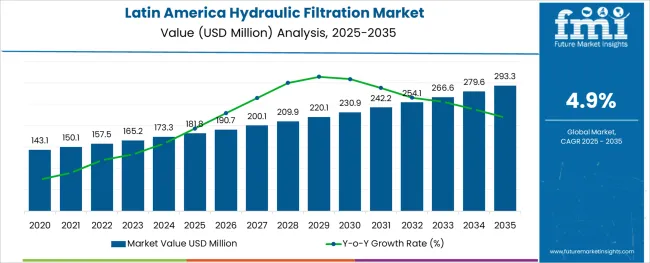
Latin America's hydraulic filtration market size reached US$ 150.1 million in 2021 and it is likely to surpass a valuation of US$ 156.4 million in 2022. Furthermore, with rising adoption across various end-use sectors, the overall demand for hydraulic filtration products across Latin America is expected to rise at 4.9% CAGR between 2022 and 2032, totaling a valuation of US$ 251.9 million by 2032.

The use of hydraulic filtration has increased across numerous industrial machinery and mobile equipment as a result of the growth of infrastructural development & industrial development within the region.

Hydraulic filtration consists of hydraulic filters used to remove impurities like contaminants, dust, and other particles from the hydraulic oil. These filters provide safety to components of the hydraulic system by filtering the hydraulic oil and therefore play a key role in enhancing the operating efficiency of the overall system. As a result, these filters are gaining wider popularity amongst end users.

Factors such as leakages, rust, cavitation, aeration, damaged seals, etc. make the hydraulic fluid contaminated, which can cause several problems in hydraulic systems including degradation and malfunctioning. In order to tackle this, industries use hydraulic filters.

Hydraulic filtration is the only effective solution to eliminate contaminants from fluid in use. It helps end users eliminate the presence of foreign particles in hydraulic fluid, protect hydraulic systems from damage, minimize hydraulic downtime, and improve overall efficiency and productivity.

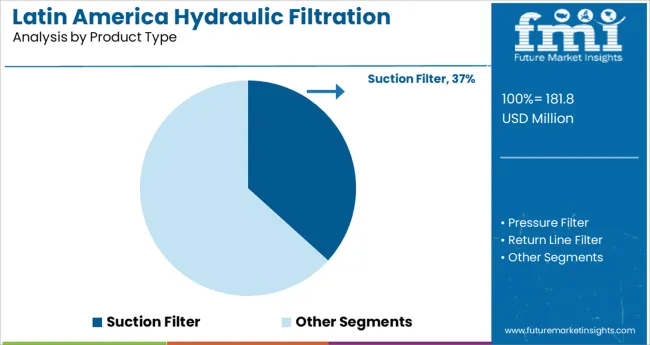
The hydraulic filter type for a specific application is chosen based on its fluid compatibility, application type pressure drop, operating pressure, design, size, etc. Various types of hydraulic filters such as suction filters, pressure filters, return line filters, off-line filters, and breather filters are being employed in hydraulic systems to effectively remove pollutants from hydraulic oil.

The rising adoption of hydraulic systems across thriving industries like manufacturing, construction, automotive, aerospace, and power, to perform various tasks is expected to create prospects for the Latin American hydraulic filtration market during the forecast period.

Population explosion and rapid urbanization in Latin America are demanding enhanced products and services from various end-use sectors such as industrial, mining, agriculture, and construction. To cope with such excessive demands, good operability and higher efficiency of machinery are a must. With the increasing installation of hydraulic systems in industrial as well as mobile equipment, sales of hydraulic filtration are likely to grow at a steady pace during the next ten years.

Manufacturers are working to produce high-quality, low-cost filters to meet changing end-user demands. This aspect also drives product innovation, which boosts demand and sales of hydraulic filters. Additionally, end users prefer products that have a longer life cycle, so that overall spending on maintenance is reduced, which simultaneously increases profit margins.

Currently, the Latin American hydraulic filtration market accounts for around 7 to 10% of its parent market (global hydraulic filtration market).

Attribute Key Insights
Latin America Hydraulic Filtration Market Base Value (2021A) US$ 150.1 million
Estimated Market Value (2022E) US$ 156.4 million
Projected Market Value (2032F) US$ 251.9 million
Value-based CAGR (2022 to 2032) 4.9%
Collective Value Share: Top 3 Countries (2022) 80.3%

Don't pay for what you don't need

Customize your report by selecting specific countries or regions and save 30%!

Demand Analysis of Hydraulic Filtration from 2017 to 2021 Vs Market Forecast for 2022 to 2032

According to FMI, the hydraulic filtration market in Latin America grew at 2.3% CAGR during the historical period from 2017 to 2021. However, with the rapid growth of industrial sectors across countries like Brazil and Chile, the overall sales of hydraulic filtration are projected to increase at 4.9% CAGR between 2022 and 2032.

The rapid growth of industries such as food & beverage, industrial machine, oil & gas, plastic & polymer, and energy & power, increasing production and sales of mobile equipment, and the growing need for protecting hydraulic systems from pollutants are some of the key factors providing impetus to the growth of the Latin America hydraulic filtration market.

In recent years, there has been a robust growth of industrial and commercial construction sectors across Latin America as a result of rising investments in the infrastructure sector. This has generated a huge demand for industrial machinery and mobile equipment which uses hydraulic systems for various applications. This has boosted the sales of hydraulic filters and the trend is expected to continue during the forecast period.

Apart from that prominent manufacturers present in the market are focusing on quality materials and research and development (R&D) for hydraulic filtration production to overcome the rising customer demand. This will further boost the market across Latin America during the next ten years.

Majority of the industries today use hydraulic systems as compared to mechanical, electrical, or pneumatic systems, as they can move heavier loads and exert more force. Without the use of gears, pulleys, or heavy leavers, the fluid power system allows it to easily handle a wide range of weights due to which the installation rate of the hydraulic system has increased in recent years and to enhance the operability for a long period the demand for hydraulic filters has also increased.

It is expected that with the rising installation of hydraulic systems in the end-use sectors, the demand for hydraulic filters in Latin America is expected to have a higher growth rate over the next ten years.

Latin America Hydraulic Filtration Market

Comparative Analysis of Latin America Hydraulic Filtration Markets

Latin America Hydraulic Filtration Market:

Differentiating Aspects Latin America Hydraulic Filtration Market
CAGR in 2022 to 2032 4.9%
Current Valuation in 2022 US$ 156.4 million
Projected Valuation in 2032 US$ 251.9 million
Demand Drivers
  • Increasing usage of hydraulic filters across industrial and mobile equipment sectors is providing impetus to the growth of the Latin America hydraulic filtration market.
  • The rising need for improving the life span of machines is expected to push demand for hydraulic filtration across Latin America through 2032.

Industrial Filtration Market:

Differentiating Aspects Industrial Filtration Market
CAGR in 2022 to 2032 5.7%
Current Valuation in 2022 US$ 25,935.1 million
Projected Valuation in 2032 US$ 56,834.1 million
Demand Drivers
  • Rapid industrialization across the world is a key factor expected to boost the global industrial filtration market during the forecast period.
  • The growing need for improving worker safety as well as reducing environmental pollution levels is likely to boost industrial filtration sales over the next ten years.

Automotive Air Filter Market:

Differentiating Aspects Automotive Air Filter Market
CAGR in 2022 to 2032 2.3%
Current Valuation in 2022 US$ 5,321.3 million
Projected Valuation in 2032 US$ 6,680 million
Demand Drivers
  • Rising production and sales of automobiles worldwide is a key factors driving the global automotive air filter market.
  • Implementation of stringent regulations pertaining to greenhouse gas emissions will further elevate the demand for automotive air filters during the projection period.
Nikhil Kaitwade
Nikhil Kaitwade

Principal Consultant

Talk to Analyst

Find your sweet spots for generating winning opportunities in this market.

What are the Key Trends Driving the Latin America Hydraulic Filtration Market?

Advancements in Technology and Cost Effectiveness of Hydraulic Filters to Propel Demand.

Through the creation and adoption of new technologies, the hydraulic equipment sector is experiencing a technological revolution. Many hydraulic filters based on breakthroughs and technologies are utilized in planning and management for more effective equipment operations.

The introduction of new raw materials, including micro glass, indicates the stakeholders' increased efforts to promote innovations in the layout and characteristics of new models of hydraulic filters. Prominent manufacturers are launching hydraulic filters to meet the unique needs of end-use applications from various industries. This is expected to boost the Latin America hydraulic filtration market during the forecast period.

Increasing Adoption of Hydraulic Filters in Thriving Plastic & Polymer Processing/Manufacturing Sector to Boost Market

Opportunities for plastic processing continue to grow across a range of industries. Automotive, construction, medicine, and many other industries are all eager to take advantage of the latest innovations in plastic processing. With the emergence of Industry 4.0 and the smart factory, processors need to look at every opportunity to reduce their outlays and increase the overall efficiency of their operations. High-performance hydraulic fluid filters represent an easy opportunity to improve efficiency in a range of areas.

All hydraulic plastic injection mold systems are subject to fluid leakage and contamination. Experts from the industry say that contamination of the hydraulic fluid is the prime reason for nearly 80% of all injection molding machine (IMM) issues. Thus, the role of hydraulic filters becomes more important in the plastic and polymer industry.

The global injection-molded plastics market reached a valuation of US$ 273.7 billion in 2021 and it is expected to grow at a strong pace during the forecast period. This in turn will generate a plethora of opportunities for hydraulic filtration manufacturers across Lain America.

Which Factors Can Hinder the Growth of Hydraulic Filtration Market in Latin America?

Lack of Quality Control Across the Developing Countries in the Region to Limit Market Expansion

Quality control at various stages of manufacturing is very important for hydraulic filters. However, the growing negligence and low-quality raw material procurement to earn large profit margins lead to the manufacturing of low-quality hydraulic filters. The large-scale production of such low-quality hydraulic filters across developing nations is expected to hamper the overall industry as well as the mobile sector, and thus, in response, it is expected to weaken the demand for hydraulic filters across all major application sectors.

Moreover, various types of hydraulic equipment are required for carrying out different types of operations. Hydraulic equipment is placed in critical work conditions and is required to work in accordance with the regulations, directives, and standards applicable to end-use operations and industry. This will result in costly operations for small and medium-sized industries and will generate pressure on the manufacturing industries to reduce the cost. This is expected to act as a key restraint for the market during the forecast period.
Get the data you need at a Fraction of the cost

Personalize your report by choosing insights you need
and save 40%!

Country-wise Insights

Which Country Dominates the Hydraulic Filtration Market in Latin America?

Brazil Remains at the Epicenter of Latin America Filtration Market

As per FMI, Brazil remains the most dominant market for hydraulic filtration systems across Latin America and it is expected to hold more than 1/3rd of the market share during the forecast period. This can be attributed to the robust development of end-use sectors in the country.

Brazil has the largest mining and construction market in Latin America, which includes expanding projects in infrastructure development and mining projects. Similarly, there has been a rapid growth of industries like aerospace, cement, iron and steel production, petroleum processing, automotive, and cement across the country during the last few years.

In addition to this, the food and beverage sector plays a very important role in the manufacturing sub-sector. Brazil's industrial growth has been aided by the accessibility of an inexpensive workforce, an increase in the import of manufacturing machinery, and an abundance of raw materials.

With the rising industrial sector, the installation of hydraulic systems has also increased in the country, resulting in higher demand for hydraulic filters. This will continue to boost the hydraulic filtration market in Brazil during the projected period.

Why is Chile Emerging as a Lucrative Hydraulic Filtration Market Across Latin America?

Rising Number of Construction & Mining Equipment Making Chile an Attractive Market

According to Future Market Insights, demand for hydraulic filtration across Chile is projected to rise at 6.0% CAGR during the forecast period from 2022 to 2032. This can be attributed to the rapid growth of industrial and infrastructural sectors across the country.

Chile has been one of Latin America’s fastest-growing economies in recent decades which enables the country to significantly reduce poverty rates and enhance job opportunities by investing significant capital in industrial & Infrastructural sectors. This has created a conducive environment for the growth of the hydraulic filtration market.

Apart from that increasing fleet of construction & mining equipment is playing a key role in elevating the demand for hydraulic systems and hydraulic filtration in the country.

Category-wise Insights

Which Technology Type is Gaining Popularity Among End Users?

With Sensor, Hydraulic Filtration is Becoming a Highly Popular Technology Type

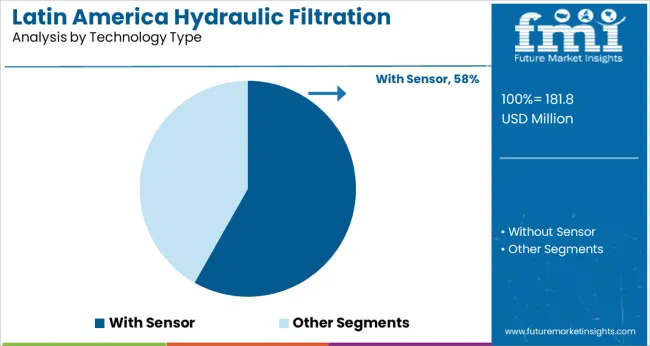
As per FMI, the with-sensor hydraulic filter segment is expected to hold more than 2/3rd of the value share in the Latin American hydraulic filtration market during the forecast period. This can be attributed to the increasing inclination of end users towards the monitored hydraulic systems.

With rising industrial automation and increasing technological development, the popularity of digitally connected hydraulic systems is increasing which is expected to drive the demand for sensor hydraulic filters in industrial as well as mobility equipment sectors.

Which Sales Channel Holds Maximum Potential for Holds the Growth of the Hydraulic Filtration Market?

Aftermarket Segment to Generate Lucrative Revenues Throughout the Forecast Period

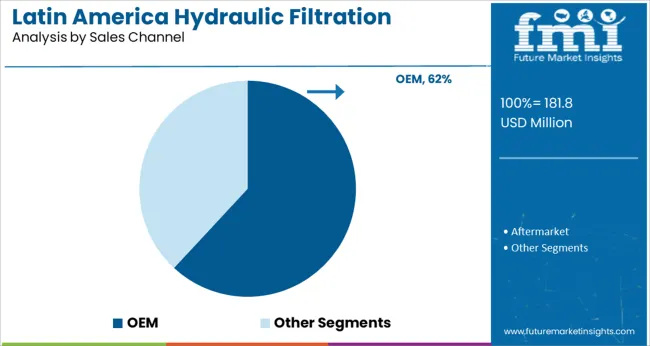
By sales channel, the aftermarket segment holds the highest share of the Latin America hydraulic filtration market and it is expected to create an absolute $ opportunity of US$ 73.7 million during the forecast period (2022 to 2032). Increased rate of replacement of these filters in end-use sectors is a key factor behind such excessive sales from the aftermarket sales channel.

Similarly, the availability of hydraulic filtration products at cheaper prices through aftermarket sales channels will further aid in the growth of the target segment over the next ten years.
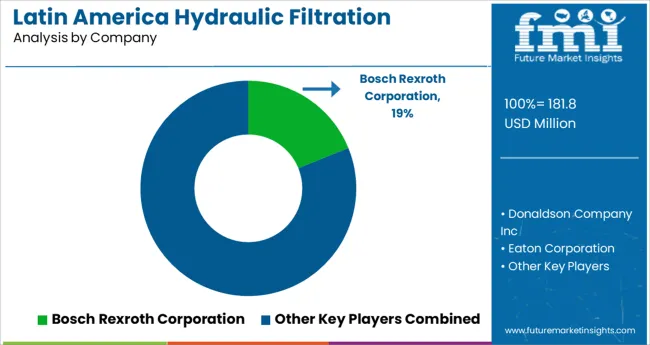
Competitive Landscape

Leading market players operating in the Latin America hydraulic filtration market include Parker Hannifin Corporation, Donaldson Company Inc, Pall Corporation, Eaton Corporation, Filtration Group Industrial, MANN+HUMMEL Group, Moog, Yamashin Filter Corp, MP Filtri S.P.A., HYDAC, Bosch Rexroth Corporation, Norman and others.

Manufacturing businesses want to increase the availability of their hydraulic filtration on the market through the introduction of safe and developed service offers and collaboration with domestic players. They are continuously introducing new hydraulic filters in the Latin American market to increase their sales and solidify their presence in this region. For instance,

  • In 2021, UFI Filters, a leader in filtration and thermal management, launched the UFI Hydraulic Division range in Brazil. The UFI Filters South American branch will distribute the products of the UFI Hydraulic Division both for the OEM and aftermarkets.
  • In August 2022, the Brazilian branch of UFI Filters received the Q1 from Ford Motor Company, the automaker’s maximum qualification for its suppliers. The maximum certification received by UFI highlights the quality of the products that the company is producing.
  • In 2022, Hengst Filtration acquired the Brazilian filtration company, The Linter Group to continue its expansion of business activities in the field of filtration solutions.
  • In 2021, Pall Corporation, a leader in filtration, separation, and purification technology and Danaher operating company, launched the New Supralon hydraulic and lube oil filter element range

Latin America Hydraulic Filtration Industry Report Scope

Attribute Details
Estimated Market Value (2022) US$ 156.4 million
Projected Market value (2032) US$ 251.9 million
Anticipated Growth Rate (2022 to 2032) 4.9% CAGR
Forecast Period 2022 to 2032
Historical Data Available for 2017 to 2021
Market Analysis US$ million for Value
Key Regions Covered Latin America
Key Countries Covered Brazil, Mexico, Argentina, Chile, Peru, and the rest of the Latin American Countries
Key Market Segments Covered Product Type, Technology Type, Sales Channel, & End Use
Key Companies Profiled
  • Parker Hannifin Corporation
  • Donaldson Company Inc
  • Pall Corporation
  • Eaton Corporation
  • Filtration Group Industrial
  • MANN+HUMMEL Group
  • Moog
  • Yamashin Filter Corp
  • MP Filtri S.P.A.
  • HYDAC
  • Bosch Rexroth Corporation
  • Norman and others
Report Coverage Market Forecast, brand share analysis, competition intelligence, DROT analysis, Market Dynamics and Challenges, Strategic Growth Initiatives

Key Segments Covered in Latin America Hydraulic Filtration Market Analysis

By Product Type:

  • Suction Filter
  • Pressure Filter
  • Return Line Filter
  • Off-Line Filter
  • Breather Filter
  • Others

By Technology Type:

  • With Sensor
  • Without Sensor

By Sales Channel:

  • OEM
  • Aftermarket

By End Use:

  • Industry
    • Food & Beverage
    • Industrial Machine
    • Marine
    • Oil & Gas
    • Paper & Pulp
    • Pharmaceutical & Medical
    • Plastic & Polymer
    • Energy & Power
    • Others
  • Mobile Equipment
    • Construction
    • Agriculture
    • Mining
    • Forestry
    • Material Handling/Lifting

Frequently Asked Questions

How big is the Latin America hydraulic filtration market?

The Latin American hydraulic filtration market is expected to reach US$ 156.4 million in 2022.

How rapidly is the Latin America hydraulic filtration industry projected to develop between 2022 and 2032?

Sales of hydraulic filtration in Latin America are anticipated to climb at 4.9% CAGR between 2022 and 2032.

What is the projected valuation of the Latin America hydraulic filtration market in 2032?

The Latin America hydraulic filtration market is expected to reach a valuation of US$ 251.9 million by 2032.

Which end user segment leads the hydraulic filtration market?

The industry segment holds a considerable market share among the end users.

Which sales channel accounts for the largest share of the Latin American market for hydraulic filtration?

More than 1/3 share of the Latin American hydraulic filtration market is held by the aftermarket sales segment.

Which country is estimated to lead the hydraulic filtration market in Latin America?

Brazil is expected to hold over 35% share of the Latin America hydraulic filtration industry during the forecast period.

Table of Content

1. Executive Summary | Latin America Hydraulic Filtration Market

    1.1. Market Outlook

    1.2. Demand Side Trends

    1.3. Supply Side Trends

    1.4. Material Roadmap

    1.5. Analysis and Recommendations

2. Market Overview

    2.1. Market Coverage / Taxonomy

    2.2. Market Definition / Scope / Limitations

3. Key Market Trends

    3.1. Key Trends Impacting the Market

    3.2. Product Innovation / Development Trends

4. Key Success Factors

    4.1. Product Adoption / Usage Analysis

    4.2. Product USPs / Features

    4.3. Strategic Promotional Strategies

5. Latin America Market Demand Analysis 2017 to 2021 and Forecast, 2022 to 2032

    5.1. Historical Market Volume (‘000 Units) Analysis, 2017 to 2021

    5.2. Current and Future Market Volume (‘000 Units) Projections, 2022 to 2032

    5.3. Y-o-Y Growth Trend Analysis

6. Latin America Market - Pricing Analysis

    6.1. Regional Pricing Analysis By Product Type

    6.2. Latin America Average Pricing Analysis Benchmark

7. Latin America Market Demand (in Value or Size in US$ million) Analysis 2017 to 2021 and Forecast, 2022 to 2032

    7.1. Historical Market Value (US$ million) Analysis, 2017 to 2021

    7.2. Current and Future Market Value (US$ million) Projections, 2022 to 2032

        7.2.1. Y-o-Y Growth Trend Analysis

        7.2.2. Absolute $ Opportunity Analysis

8. Market Background

    8.1. Macro-Economic Factors

        8.1.1. Global Economic Outlook

        8.1.2. GDP Growth Overview

        8.1.3. GDP in Latin America by Country Overview

        8.1.4. Latin American Countries Industry Value Added (% of GDP)

        8.1.5. Parent Market Overview

        8.1.6. Other Macro-Economic Factors

    8.2. Forecast Factors - Relevance & Impact

        8.2.1. Hydraulic Equipment Market Growth

        8.2.2. Growth of Heavy Construction Equipment & Industrial Vehicles

        8.2.3. Other Forecast Factors.

    8.3. COVID-19 Crisis - Impact Assessment

        8.3.1. Current Statistics

        8.3.2. Short-Mid-Long Term Outlook

        8.3.3. Likely Rebound

    8.4. Value Chain

        8.4.1. List of Manufacturers

        8.4.2. List of Physical Distributors

        8.4.3. Trade Margins/Profit Margins

    8.5. Porter’s Five Force Analysis

    8.6. Market Dynamics

        8.6.1. Drivers

        8.6.2. Restraints

        8.6.3. Opportunity Analysis

9. Latin America Market Analysis 2017 to 2021 and Forecast 2022 to 2032, By Product Type

    9.1. Introduction / Key Findings

    9.2. Historical Market Size (US$ million) and Volume Analysis By Product Type, 2017 to 2021

    9.3. Current and Future Market Size (US$ million) and Volume Analysis and Forecast By Product Type, 2022 to 2032

        9.3.1. Suction Filter

        9.3.2. Pressure Filter

        9.3.3. Return Line Filter

        9.3.4. Off-Line Filter

        9.3.5. Breather Filter

        9.3.6. Others

    9.4. Market Attractiveness Analysis By Product Type

10. Latin America Market Analysis 2017 to 2021 and Forecast 2022 to 2032, By Technology Type

    10.1. Introduction / Key Findings

    10.2. Historical Market Size (US$ million) and Volume Analysis By Technology Type, 2017 to 2021

    10.3. Current and Future Market Size (US$ million) and Volume Analysis and Forecast By Technology Type, 2022 to 2032

        10.3.1. With Sensor

        10.3.2. Without Sensor

    10.4. Market Attractiveness Analysis By Technology Type

11. Latin America Market Analysis 2017 to 2021 and Forecast 2022 to 2032, By Sales Channel

    11.1. Introduction / Key Findings

    11.2. Historical Market Size (US$ million) and Volume Analysis By Sales Channel, 2017 to 2021

    11.3. Current and Future Market Size (US$ million) and Volume Analysis and Forecast By Sales Channel, 2022 to 2032

        11.3.1. OEM

        11.3.2. Aftermarket

    11.4. Market Attractiveness Analysis By Sales Channel

12. Latin America Market Analysis 2017 to 2021 and Forecast 2022 to 2032, By End Use

    12.1. Introduction / Key Findings

    12.2. Historical Market Size (US$ million) and Volume Analysis By End Use, 2017 to 2021

    12.3. Current and Future Market Size (US$ million) and Volume Analysis and Forecast By End Use, 2022 to 2032

        12.3.1. Industry

            12.3.1.1. Food & Beverage

            12.3.1.2. Industrial Machine

            12.3.1.3. Marine

            12.3.1.4. Oil & Gas

            12.3.1.5. Paper & Pulp

            12.3.1.6. Pharmaceutical & Medical

            12.3.1.7. Plastic & Polymer

            12.3.1.8. Energy & Power

            12.3.1.9. Others

        12.3.2. Mobile Equipment

            12.3.2.1. Construction

            12.3.2.2. Agriculture

            12.3.2.3. Mining

            12.3.2.4. Forestry

            12.3.2.5. Material Handling/Lifting

    12.4. Market Attractiveness Analysis By End Use

13. Latin America Market Analysis 2017 to 2021 and Forecast 2022 to 2032, By Country

    13.1. Introduction

    13.2. Historical Market Size (US$ million) and Volume Analysis By Country, 2017 to 2021

    13.3. Current Market Size (US$ million) and Volume Analysis and Forecast By Country, 2022 to 2032

        13.3.1. Brazil

        13.3.2. Mexico

        13.3.3. Argentina

        13.3.4. Chile

        13.3.5. Peru

        13.3.6. Rest of Latin America)

    13.4. Market Attractiveness Analysis By Country

14. Brazil Market Analysis 2017 to 2021 and Forecast 2022 to 2032

    14.1. Introduction

    14.2. Pricing Analysis

    14.3. Historical Market Size (US$ million) and Volume Trend Analysis by Market Taxonomy, 2017 to 2021

    14.4. Market Size (US$ million) and Volume Forecast by Market Taxonomy, 2022 to 2032

        14.4.1. By Product Type

        14.4.2. By Technology Type

        14.4.3. By Sales Channel

        14.4.4. By End Use

    14.5. Market Attractiveness Analysis

        14.5.1. By Product Type

        14.5.2. By Technology Type

        14.5.3. By Sales Channel

        14.5.4. By End Use

15. Mexico Market Analysis 2017 to 2021 and Forecast 2022 to 2032

    15.1. Introduction

    15.2. Pricing Analysis

    15.3. Historical Market Size (US$ million) and Volume Trend Analysis by Market Taxonomy, 2017 to 2021

    15.4. Market Size (US$ million) and Volume Forecast by Market Taxonomy, 2022 to 2032

        15.4.1. By Product Type

        15.4.2. By Technology Type

        15.4.3. By Sales Channel

        15.4.4. By End Use

    15.5. Market Attractiveness Analysis

        15.5.1. By Product Type

        15.5.2. By Technology Type

        15.5.3. By Sales Channel

        15.5.4. By End Use

16. Argentina Market Analysis 2017 to 2021 and Forecast 2022 to 2032

    16.1. Introduction

    16.2. Pricing Analysis

    16.3. Historical Market Size (US$ million) and Volume Trend Analysis by Market Taxonomy, 2017 to 2021

    16.4. Market Size (US$ million) and Volume Forecast by Market Taxonomy, 2022 to 2032

        16.4.1. By Product Type

        16.4.2. By Technology Type

        16.4.3. By Sales Channel

        16.4.4. By End Use

    16.5. Market Attractiveness Analysis

        16.5.1. By Product Type

        16.5.2. By Technology Type

        16.5.3. By Sales Channel

        16.5.4. By End Use

17. Chile Market Analysis 2017 to 2021 and Forecast 2022 to 2032

    17.1. Introduction

    17.2. Pricing Analysis

    17.3. Historical Market Size (US$ million) and Volume Trend Analysis by Market Taxonomy, 2017 to 2021

    17.4. Market Size (US$ million) and Volume Forecast by Market Taxonomy, 2022 to 2032

        17.4.1. By Country

            17.4.1.1. India

            17.4.1.2. ASEAN

            17.4.1.3. Australia and New Zealand

            17.4.1.4. Rest of South Asia & Pacific

        17.4.2. By Product Type

        17.4.3. By Technology Type

        17.4.4. By Sales Channel

        17.4.5. By End Use

    17.5. Market Attractiveness Analysis

        17.5.1. By Product Type

        17.5.2. By Technology Type

        17.5.3. By Sales Channel

        17.5.4. By End Use

18. Peru Market Analysis 2017 to 2021 and Forecast 2022 to 2032

    18.1. Introduction

    18.2. Pricing Analysis

    18.3. Historical Market Size (US$ million) and Volume Trend Analysis by Market Taxonomy, 2017 to 2021

    18.4. Market Size (US$ million) and Volume Forecast by Market Taxonomy, 2022 to 2032

        18.4.1. By Product Type

        18.4.2. By Technology Type

        18.4.3. By Sales Channel

        18.4.4. By End Use

    18.5. Market Attractiveness Analysis

        18.5.1. By Product Type

        18.5.2. By Technology Type

        18.5.3. By Sales Channel

        18.5.4. By End Use

19. Rest of Latin America Market Analysis 2017 to 2021 and Forecast 2022 to 2032

    19.1. Introduction

    19.2. Pricing Analysis

    19.3. Historical Market Size (US$ million) and Volume Trend Analysis by Market Taxonomy, 2017 to 2021

    19.4. Market Size (US$ million) and Volume Forecast by Market Taxonomy, 2022 to 2032

        19.4.1. By Product Type

        19.4.2. By Technology Type

        19.4.3. By Sales Channel

        19.4.4. By End Use

    19.5. Market Attractiveness Analysis

        19.5.1. By Product Type

        19.5.2. By Technology Type

        19.5.3. By Sales Channel

        19.5.4. By End Use

20. Market Structure Analysis

    20.1. Market Analysis by Tier of Companies (Hydraulic Filtration)

    20.2. Market Share Analysis of Top Players

    20.3. Market Concentration Analysis

21. Competition Analysis

    21.1. Competition Dashboard

    21.2. Competition Benchmarking

    21.3. Competition Deep Dive

        21.3.1. Bosch Rexroth Corporation

            21.3.1.1. Overview

            21.3.1.2. Product Portfolio

            21.3.1.3. Profitability by Market Segments (Product/Channel/Region)

            21.3.1.4. Sales Footprint

            21.3.1.5. Strategy Overview

        21.3.2. Donaldson Company Inc

            21.3.2.1. Overview

            21.3.2.2. Product Portfolio

            21.3.2.3. Profitability by Market Segments (Product/Channel/Region)

            21.3.2.4. Sales Footprint

            21.3.2.5. Strategy Overview

        21.3.3. Eaton Corporation

            21.3.3.1. Overview

            21.3.3.2. Product Portfolio

            21.3.3.3. Profitability by Market Segments (Product/Channel/Region)

            21.3.3.4. Sales Footprint

            21.3.3.5. Strategy Overview

        21.3.4. Filtration Group

            21.3.4.1. Overview

            21.3.4.2. Product Portfolio

            21.3.4.3. Profitability by Market Segments (Product/Channel/Region)

            21.3.4.4. Sales Footprint

            21.3.4.5. Strategy Overview

        21.3.5. HYDAC Filtertechnik GmbH

            21.3.5.1. Overview

            21.3.5.2. Product Portfolio

            21.3.5.3. Profitability by Market Segments (Product/Channel/Region)

            21.3.5.4. Sales Footprint

            21.3.5.5. Strategy Overview

        21.3.6. Mann+Hummel Filtration Technology Group Inc

            21.3.6.1. Overview

            21.3.6.2. Product Portfolio

            21.3.6.3. Profitability by Market Segments (Product/Channel/Region)

            21.3.6.4. Sales Footprint

            21.3.6.5. Strategy Overview

        21.3.7. MP Filtri S.p.A.

            21.3.7.1. Overview

            21.3.7.2. Product Portfolio

            21.3.7.3. Profitability by Market Segments (Product/Channel/Region)

            21.3.7.4. Sales Footprint

            21.3.7.5. Strategy Overview

        21.3.8. Pall Corporation

            21.3.8.1. Overview

            21.3.8.2. Product Portfolio

            21.3.8.3. Profitability by Market Segments (Product/Channel/Region)

            21.3.8.4. Sales Footprint

            21.3.8.5. Strategy Overview

        21.3.9. Parker Hannifin Corp.

            21.3.9.1. Overview

            21.3.9.2. Product Portfolio

            21.3.9.3. Profitability by Market Segments (Product/Channel/Region)

            21.3.9.4. Sales Footprint

            21.3.9.5. Strategy Overview

        21.3.10. Yamashin Filter Corp.

            21.3.10.1. Overview

            21.3.10.2. Product Portfolio

            21.3.10.3. Profitability by Market Segments (Product/Channel/Region)

            21.3.10.4. Sales Footprint

            21.3.10.5. Strategy Overview

        21.3.11. Norman Filter Company L.L.C.

            21.3.11.1. Overview

            21.3.11.2. Product Portfolio

            21.3.11.3. Profitability by Market Segments (Product/Channel/Region)

            21.3.11.4. Sales Footprint

            21.3.11.5. Strategy Overview

        21.3.12. Moog, Inc

            21.3.12.1. Overview

            21.3.12.2. Product Portfolio

            21.3.12.3. Profitability by Market Segments (Product/Channel/Region)

            21.3.12.4. Sales Footprint

            21.3.12.5. Strategy Overview

        21.3.13. Tecfil - Técnica Fabrico De Fios S.A.

            21.3.13.1. Overview

            21.3.13.2. Product Portfolio

            21.3.13.3. Profitability by Market Segments (Product/Channel/Region)

            21.3.13.4. Sales Footprint

            21.3.13.5. Strategy Overview

22. Assumptions and Acronyms Used

23. Research Methodology

Don't pay for what you don't need

Customize your report by selecting specific countries or regions and save 30%!

List of Tables

Table 01: Market Value (US$ million) and Volume ('000 Units) Historical Data 2017 to 2021 and Forecast 2022 to 2032 By Product Type

Table 02: Market Value (US$ million) and Volume (‘000 Units) Historical Data 2017 to 2021 and Forecast 2022 to 2032 by Technology Type

Table 03: Market Value (US$ million) and Volume (‘000 Units) Historical Data 2017 to 2021 and Forecast 2022 to 2032 by Sales Channel

Table 04: Market Volume ('000 Units) Historical Data 2017 to 2021 and Forecast 2022 to 2032 By End Use

Table 05: Market Value (US$ million) Historical Data 2017 to 2021 and Forecast 2022 to 2032 By End Use

Table 06: Market Value (US$ million) and Volume ('000 Units) Historical Data 2017 to 2021 and Forecast 2022 to 2032 By Country

Table 07: Brazil Market Value (US$ million) and Volume ('000 Units) Historical Data 2017 to 2021 and Forecast 2022 to 2032 By Product Type

Table 08: Brazil Market Value (US$ million) and Volume (‘000 Units) Historical Data 2017 to 2021 and Forecast 2022 to 2032 by Technology Type

Table 9: Brazil Market Value (US$ million) and Volume (‘000 Units) Historical Data 2017 to 2021 and Forecast 2022 to 2032 by Sales Channel

Table 10: Brazil Market Volume ('000 Units) Historical Data 2017 to 2021 and Forecast 2022 to 2032 By End Use

Table 11: Brazil Market Value (US$ million) Historical Data 2017 to 2021 and Forecast 2022 to 2032 By End Use

Table 12: Mexico Market Value (US$ million) and Volume ('000 Units) Historical Data 2017 to 2021 and Forecast 2022 to 2032 By Product Type

Table 13: Mexico Market Value (US$ million) and Volume (‘000 Units) Historical Data 2017 to 2021 and Forecast 2022 to 2032 by Technology Type

Table 14: Mexico Market Value (US$ million) and Volume (‘000 Units) Historical Data 2017 to 2021 and Forecast 2022 to 2032 by Sales Channel

Table 15: Mexico Market Volume ('000 Units) Historical Data 2017 to 2021 and Forecast 2022 to 2032 By End Use

Table 16: Mexico Market Value (US$ million) Historical Data 2017 to 2021 and Forecast 2022 to 2032 By End Use

Table 17: Argentina Market Value (US$ million) and Volume ('000 Units) Historical Data 2017 to 2021 and Forecast 2022 to 2032 By Product Type

Table 18: Argentina Market Value (US$ million) and Volume (‘000 Units) Historical Data 2017 to 2021 and Forecast 2022 to 2032 by Technology Type

Table 19: Argentina Market Value (US$ million) and Volume (‘000 Units) Historical Data 2017 to 2021 and Forecast 2022 to 2032 by Sales Channel

Table 20: Argentina Market Volume ('000 Units) Historical Data 2017 to 2021 and Forecast 2022 to 2032 By End Use

Table 21: Argentina Market Value (US$ million) Historical Data 2017 to 2021 and Forecast 2022 to 2032 By End Use

Table 22: Chile Market Value (US$ million) and Volume ('000 Units) Historical Data 2017 to 2021 and Forecast 2022 to 2032 By Product Type

Table 23: Chile Market Value (US$ million) and Volume (‘000 Units) Historical Data 2017 to 2021 and Forecast 2022 to 2032 by Technology Type

Table 24: Chile Market Value (US$ million) and Volume (‘000 Units) Historical Data 2017 to 2021 and Forecast 2022 to 2032 by Sales Channel

Table 25: Chile Market Volume ('000 Units) Historical Data 2017 to 2021 and Forecast 2022 to 2032 By End Use

Table 26: Chile Market Value (US$ million) Historical Data 2017 to 2021 and Forecast 2022 to 2032 By End Use

Table 27: Peru Market Value (US$ million) and Volume ('000 Units) Historical Data 2017 to 2021 and Forecast 2022 to 2032 By Product Type

Table 28: Peru Market Value (US$ million) and Volume (‘000 Units) Historical Data 2017 to 2021 and Forecast 2022 to 2032 by Technology Type

Table 29: Peru Market Value (US$ million) and Volume (‘000 Units) Historical Data 2017 to 2021 and Forecast 2022 to 2032 by Sales Channel

Table 30: Peru Market Volume ('000 Units) Historical Data 2017 to 2021 and Forecast 2022 to 2032 By End Use

Table 31: Peru Market Value (US$ million) Historical Data 2017 to 2021 and Forecast 2022 to 2032 By End Use

Table 32: Rest of Market Value (US$ million) and Volume ('000 Units) Historical Data 2017 to 2021 and Forecast 2022 to 2032 By Product Type

Table 33: Rest of Market Value (US$ million) and Volume (‘000 Units) Historical Data 2017 to 2021 and Forecast 2022 to 2032 by Technology Type

Table 34: Rest of Market Value (US$ million) and Volume (‘000 Units) Historical Data 2017 to 2021 and Forecast 2022 to 2032 by Sales Channel

Table 35: Rest of Market Volume ('000 Units) Historical Data 2017 to 2021 and Forecast 2022 to 2032 By End Use

Table 36: Rest of Market Value (US$ million) Historical Data 2017 to 2021 and Forecast 2022 to 2032 By End Use
Nikhil Kaitwade
Nikhil Kaitwade

Principal Consultant

Talk to Analyst

Find your sweet spots for generating winning opportunities in this market.

List of Charts

Figure 01: Market Historical Demand, 2017 to 2021

Figure 02: Market Demand Forecast, 2022 to 2032

Figure 03: Market Historical Value (US$ million), 2017 to 2021

Figure 04: Market Value (US$ million) Forecast, 2022 to 2032

Figure 05: Market Absolute $ Opportunity, 2022 to 2032

Figure 06: Market Share and BPS Analysis By Product Type- 2022 to 2032

Figure 07: Market Y-o-Y Growth Projections By Product Type, 2021 to 2032

Figure 08: Market Attractiveness By Product Type, 2022 to 2032

Figure 09: Market Absolute $ Opportunity, 2021 to 2032, by Suction Filter segment

Figure 10: Market Absolute $ Opportunity, 2021 to 2032, by Pressure Filter segment

Figure 11: Market Absolute $ Opportunity, 2021 to 2032, by Return Line Filter segment

Figure 12: Market Absolute $ Opportunity, 2021 to 2032, by Off-Line Filter segment

Figure 13: Market Absolute $ Opportunity, 2021 to 2032, by Breather Filter segment

Figure 14: Market Absolute $ Opportunity, 2021 to 2032, by Others segment

Figure 15: Market Share and BPS Analysis by Technology Type- 2022 to 2032

Figure 16: Market Y-o-Y Growth Projections by Technology Type, 2021 to 2032

Figure 17: Market Attractiveness by Technology Type, 2022 to 2032

Figure 18: Market Absolute $ Opportunity 2021 to 2032, by With Sensor segment

Figure 19: Market Absolute $ Opportunity 2021 to 2032, by Without Sensor segment

Figure 20: Market Share and BPS Analysis by Sales Channel - 2022 to 2032

Figure 21: Market Y-o-Y Growth Projections by Sales Channel, 2021 to 2032

Figure 22: Market Attractiveness by Sales Channel, 2022 to 2032

Figure 23: Market Absolute $ Opportunity, 2021 to 2032, by OEM segment

Figure 24: Market Absolute $ Opportunity, 2021 to 2032, by Aftermarket segment

Figure 25: Market Share and BPS Analysis by End Use - 2022 to 2032

Figure 26: Market Y-o-Y Growth Projections by End Use, 2021 to 2032

Figure 27: Market Attractiveness by End Use, 2022 to 2032

Figure 28: Market Absolute $ Opportunity, 2021 to 2032, by Industry segment

Figure 29: Market Absolute $ Opportunity, 2021 to 2032, by Mobile Equipment segment

Figure 30: Market Share and BPS Analysis by Country- 2022 to 2032

Figure 31: Market Y-o-Y Growth Projections by Country, 2021 to 2032

Figure 32: Market Attractiveness by Country, 2022 to 2032

Figure 33: Market Absolute $ Opportunity 2021 to 2032, by Brazil segment

Figure 34: Market Absolute $ Opportunity 2021 to 2032, by Mexico segment

Figure 35: Market Absolute $ Opportunity 2021 to 2032, by Argentina segment

Figure 36: Market Absolute $ Opportunity 2021 to 2032, by Chile segment

Figure 37: Market Absolute $ Opportunity 2021 to 2032, by Peru segment

Figure 38: Market Absolute $ Opportunity 2021 to 2032, by Rest of Latin America segment

Figure 39: Brazil Market Share and BPS Analysis By Product Type- 2022 to 2032

Figure 40: Brazil Market Y-o-Y Growth Projections By Product Type, 2021 to 2032

Figure 41: Brazil Market Attractiveness By Product Type, 2022 to 2032

Figure 42: Brazil Market Share and BPS Analysis by Technology Type- 2022 to 2032

Figure 43: Brazil Market Y-o-Y Growth Projections by Technology Type, 2021 to 2032

Figure 44: Brazil Market Attractiveness by Technology Type, 2022 to 2032

Figure 45: Brazil Market Share and BPS Analysis by Sales Channel - 2022 to 2032

Figure 46: Brazil Market Y-o-Y Growth Projections by Sales Channel, 2021 to 2032

Figure 47: Brazil Market Attractiveness by Sales Channel, 2022 to 2032

Figure 48: Brazil Market Share and BPS Analysis by End Use - 2022 to 2032

Figure 49: Brazil Market Y-o-Y Growth Projections by End Use, 2021 to 2032

Figure 50: Brazil Market Attractiveness by End Use, 2022 to 2032

Figure 51: Mexico Market Share and BPS Analysis By Product Type- 2022 to 2032

Figure 52: Mexico Market Y-o-Y Growth Projections By Product Type, 2021 to 2032

Figure 53: Mexico Market Attractiveness By Product Type, 2022 to 2032

Figure 54: Mexico Market Share and BPS Analysis by Technology Type- 2022 to 2032

Figure 55: Mexico Market Y-o-Y Growth Projections by Technology Type, 2021 to 2032

Figure 56: Mexico Market Attractiveness by Technology Type, 2022 to 2032

Figure 57: Mexico Market Share and BPS Analysis by Sales Channel - 2022 to 2032

Figure 58: Mexico Market Y-o-Y Growth Projections by Sales Channel, 2021 to 2032

Figure 59: Mexico Market Attractiveness by Sales Channel, 2022 to 2032

Figure 60: Mexico Market Share and BPS Analysis by End Use - 2022 to 2032

Figure 61: Mexico Market Y-o-Y Growth Projections by End Use, 2021 to 2032

Figure 62: Mexico Market Attractiveness by End Use, 2022 to 2032

Figure 63: Argentina Market Share and BPS Analysis By Product Type- 2022 to 2032

Figure 64: Argentina Market Y-o-Y Growth Projections By Product Type, 2021 to 2032

Figure 65: Argentina Market Attractiveness By Product Type, 2022 to 2032

Figure 66: Argentina Market Share and BPS Analysis by Technology Type- 2022 to 2032

Figure 67: Argentina Market Y-o-Y Growth Projections by Technology Type, 2021 to 2032

Figure 68: Argentina Market Attractiveness by Technology Type, 2022 to 2032

Figure 69: Argentina Market Share and BPS Analysis by Sales Channel - 2022 to 2032

Figure 70: Argentina Market Y-o-Y Growth Projections by Sales Channel, 2021 to 2032

Figure 71: Argentina Market Attractiveness by Sales Channel, 2022 to 2032

Figure 72: Argentina Market Share and BPS Analysis by End Use - 2022 to 2032

Figure 73: Argentina Market Y-o-Y Growth Projections by End Use, 2021 to 2032

Figure 74: Argentina Market Attractiveness by End Use, 2022 to 2032

Figure 75: Chile Market Share and BPS Analysis By Product Type- 2022 to 2032

Figure 76: Chile Market Y-o-Y Growth Projections By Product Type, 2021 to 2032

Figure 77: Chile Market Attractiveness By Product Type, 2022 to 2032

Figure 78: Chile Market Share and BPS Analysis by Technology Type- 2022 to 2032

Figure 79: Chile Market Y-o-Y Growth Projections by Technology Type, 2021 to 2032

Figure 80: Chile Market Attractiveness by Technology Type, 2022 to 2032

Figure 81: Chile Market Share and BPS Analysis by Sales Channel - 2022 to 2032

Figure 82: Chile Market Y-o-Y Growth Projections by Sales Channel, 2021 to 2032

Figure 83: Chile Market Attractiveness by Sales Channel, 2022 to 2032

Figure 84: Chile Market Share and BPS Analysis by End Use - 2022 to 2032

Figure 85: Chile Market Y-o-Y Growth Projections by End Use, 2021 to 2032

Figure 86: Chile Market Attractiveness by End Use, 2022 to 2032

Figure 87: Peru Market Share and BPS Analysis By Product Type- 2022 to 2032

Figure 88: Peru Market Y-o-Y Growth Projections By Product Type, 2021 to 2032

Figure 89: Peru Market Attractiveness By Product Type, 2022 to 2032

Figure 90: Peru Market Share and BPS Analysis by Technology Type- 2022 to 2032

Figure 91: Peru Market Y-o-Y Growth Projections by Technology Type, 2021 to 2032

Figure 92: Peru Market Attractiveness by Technology Type, 2022 to 2032

Figure 93: Peru Market Share and BPS Analysis by Sales Channel - 2022 to 2032

Figure 94: Peru Market Y-o-Y Growth Projections by Sales Channel, 2021 to 2032

Figure 95: Peru Market Attractiveness by Sales Channel, 2022 to 2032

Figure 96: Peru Market Share and BPS Analysis by End Use - 2022 to 2032

Figure 97: Peru Market Y-o-Y Growth Projections by End Use, 2021 to 2032

Figure 98: Peru Market Attractiveness by End Use, 2022 to 2032

Figure 99: Rest of Market Share and BPS Analysis By Product Type- 2022 to 2032

Figure 100: Rest of Market Y-o-Y Growth Projections By Product Type, 2021 to 2032

Figure 101: Rest of Market Attractiveness By Product Type, 2022 to 2032

Figure 102: Rest of Market Share and BPS Analysis by Technology Type- 2022 to 2032

Figure 103: Rest of Market Y-o-Y Growth Projections by Technology Type, 2021 to 2032

Figure 104: Rest of Market Attractiveness by Technology Type, 2022 to 2032

Figure 105: Rest of Market Share and BPS Analysis by Sales Channel - 2022 to 2032

Figure 106: Rest of Market Y-o-Y Growth Projections by Sales Channel, 2021 to 2032

Figure 107: Rest of Market Attractiveness by Sales Channel, 2022 to 2032

Figure 108: Rest of Market Share and BPS Analysis by End Use - 2022 to 2032

Figure 109: Rest of Market Y-o-Y Growth Projections by End Use, 2021 to 2032

Figure 110: Rest of Market Attractiveness by End Use, 2022 to 2032

Recommendations

Industrial Automation

Hydraulic Gear Pumps Market

Published : August 2023

Industrial Automation

Industrial Filtration Market

Published : August 2023

Automotive

Automotive Air Filter Market

Published : June 2023

Industrial Automation

Industrial Air Filtration Market

Published : May 2023

Explore Industrial Automation Insights

View Reports

Latin America Hydraulic Filtration Market