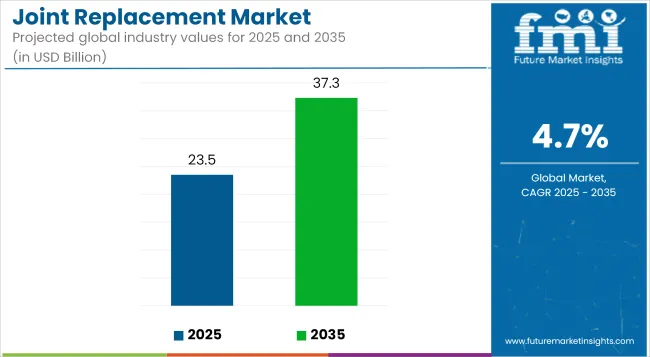
The global Joint Replacement Market is estimated to be valued at USD 23.5 billion in 2025 and is projected to reach USD 37.3 billion by 2035, registering a compound annual growth rate of 4.7% over the forecast period.
| Attributes | Key Insights |
|---|---|
| Estimated Size, 2025 | USD 23.5 billion |
| Projected Size, 2035 | USD 37.3 billion |
| Value-based CAGR (2025 to 2035) | 4.7% |
The global joint replacement market is evolving rapidly, driven by an aging population, rising cases of osteoarthritis, and increasing patient preference for minimally invasive procedures. Technological innovations such as robotic-assisted surgeries, AI-driven planning tools, and patient-specific implants are transforming clinical outcomes and improving recovery timelines.
The market is also witnessing a shift toward outpatient procedures and ambulatory surgical centers, reflecting efforts to reduce healthcare costs while improving access. Growing investments in healthcare infrastructure across emerging economies are further expanding the market footprint. However, challenges such as reimbursement complexities, regulatory barriers, and pricing pressures persist. Despite this, the market outlook remains strong, with innovation, personalized care, and surgical efficiency expected to drive future expansion.
The below table presents the expected CAGR for the global joint replacement market over several semi-annual periods spanning from 2025 to 2035. In the first half (H1) of the decade from 2024 to 2035, the business is predicted to surge at a CAGR of 5.9%, followed by a slightly lower growth rate of 5.4% in the second half (H2) of the same decade.
| Particular | Value CAGR |
|---|---|
| H1 (2024 to 2034) | 5.9% |
| H2 (2024 to 2034) | 5.5% |
| H1 (2025 to 2035) | 4.7% |
| H2 (2025 to 2035) | 4.4% |
Moving into the subsequent period, from H1 2025 to H2 2035, the CAGR is projected to decrease slightly to 4.7% in the first half and decrease moderately at 4.4% in the second half. In the first half (H1) the market witnessed an increase of 120.00 BPS while in the second half (H2), the market witnessed a decrease of 100.00 BPS.
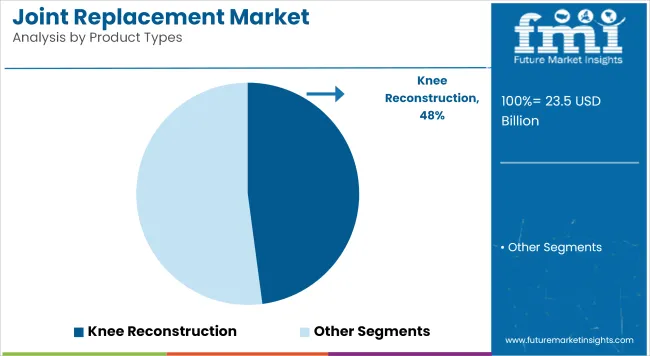
The knee reconstruction segment has been observed to lead the joint replacement market in 2025, accounting for approximately 47.9% of total revenue share. This leadership position has been attributed to the growing incidence of osteoarthritis, particularly among aging and obese populations. Knee joints, being highly load-bearing, are more susceptible to degenerative damage over time, prompting greater surgical intervention.
Advances in prosthetic design such as improved articulation, better wear resistance, and enhanced biocompatibility have contributed to higher patient satisfaction and procedure durability. Additionally, the adoption of minimally invasive and robotic-assisted surgeries has increased surgical precision and reduced recovery times, encouraging more elective procedures.
Healthcare providers have focused on early diagnosis and clinical pathway optimization, resulting in expanded procedural volumes. Favorable insurance coverage in high-burden markets has also played a role in the segment’s sustained dominance.
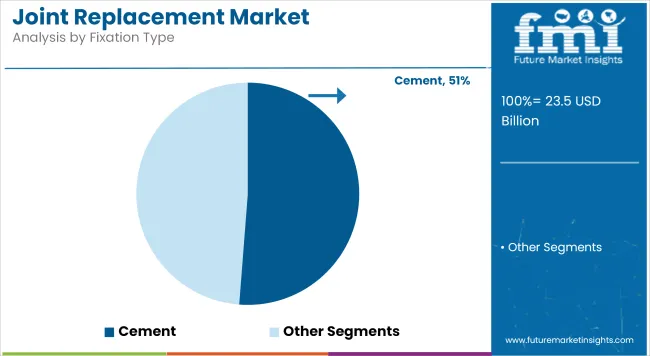
Cemented fixation is estimated to hold approximately 51.23% of the market share in 2025, sustaining its position as the leading fixation technique. This dominance has been supported by a long history of safe and effective clinical outcomes, particularly in elderly patients where compromised bone quality demands secure anchorage.
The immediate stability provided by bone cement has enabled predictable post-operative recovery, making it a preferred choice in both elective and trauma-based procedures. The widespread adoption of this technique has been reinforced through orthopedic training programs and continued surgeon familiarity.
Furthermore, cemented implants are often more cost-effective and compatible with a broader patient demographic, contributing to their usage in public healthcare systems globally. Even with the emergence of cementless and hybrid technologies, the reliability and familiarity of cemented fixation continue to support its widespread use.
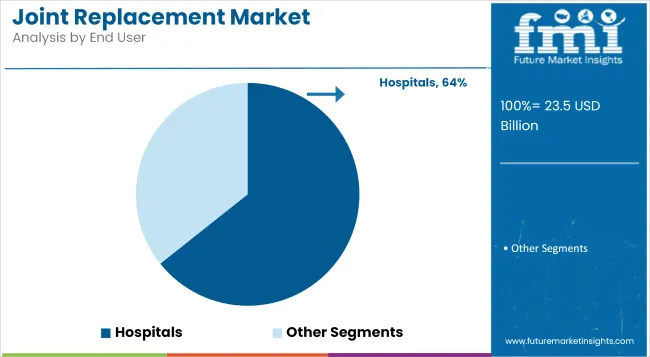
Hospitals are projected to contribute 64.3% of the total joint replacement market revenue in 2025, making them the dominant end-user segment. This has been driven by their ability to offer advanced surgical infrastructure, post-operative care units, and 24/7 emergency services. The availability of skilled orthopedic surgeons, anesthetists, and rehabilitation teams has ensured optimal clinical outcomes for joint replacement surgeries.
Complex and high-risk procedures such as revisions or bilateral replacements are typically concentrated in hospital settings due to the need for multidisciplinary coordination. Moreover, reimbursement frameworks in many countries are structured to favor hospital-based surgeries, particularly for Medicare and government-insured patients. Hospitals also offer better infection control measures and post-surgical monitoring, further reinforcing patient trust and physician preference for in-hospital procedures.
The Increasing Popularity of Cementless Implants Is Increasing Adoption of Joint Replacement.
Cementless implants or press-fit implants are increasingly dominating the joint replacement market because it can integrate biologically with a patient's own bone. Thus, cementless implants do not rely on a cemented construct for stability while cemented ones do. Here, cementless implants are fabricated to stimulate bone into the implant's surface, developing a strong durable bond. This makes them particularly appropriate for younger, more active patients who need implants that could withstand more activity levels for a longer period of time.
The primary advantage of cementless implants is their ability to decrease the risk of long-term complications such as loosening or mechanical failure, which are more prevalent with cemented alternatives. These implants also simplify revision surgeries if needed, because the absence of cement reduces the complexity of procedures. Improvements in implant materials, such as porous titanium coatings and hydroxyapatite layers, enhance osseointegration, further enhancing their clinical success rates.
The most notable would be the cementless femoral stem DePuy Synthes CORAIL Hip System, which is lined with a hydroxyapatite coating to ensure rapid, robust bone ingrowth. There has been mass adoption of these implants because, based on current data, such implants have achieved proven durability without high revision risk. The huge demand for biologically integrated joint replacement solutions presents an opportunity that has been highlighted in the market analysis.
Technological Advancements in Implants is favoring the Growth for Joint Replacement Market
The use of implants has transformed the market for joint replacement, thereby enhancing growth by better surgical outcomes, increased patient satisfaction, and more expansive treatment scopes. The most revolutionary changes, however, come in the form of 3D-printed implants, where a patient-specific solution is provided according to his or her anatomy.
Such implants provide an exact fit and alignment, which means the chances of loosening or malalignment of implants are lower. In addition, 3D printing supports the development of complex porous structures that enhance natural bone integration, thus making implants more stable and durable.
Robotic assistance has also heightened the accuracy in joint replacement. The use of real-time imaging and AI-aided instrumentation by systems like Stryker's MAKO and Zimmer Biomet's ROSA will eliminate errors that were associated with implant placement and orientation. In other words, with robotic assistance, there will be decreased tissue damage and less healing time in addition to less postoperative time at the hospital.
Besides this, the usage of advanced materials such as titanium, ceramic composites, and highly cross-linked polyethylene has further increased implant life and biocompatibility. This material has significantly reduced wear and tear and resulted in a reduced rate of revision surgeries with the quality of life of patients improving.
All of these technological advances are attracting more youthful, active patients while satisfying the increasing demand for durable, customized, and minimally invasive joint replacement solutions.
The Aging Global Population Represents a Substantial Opportunity for The Joint Replacement Market.
Aging in the global population has been a large opportunity for the joint replacement market, as it is more vulnerable to musculoskeletal disorders and degenerative joint conditions. The WHO estimates that by 2050, the world population aged 60 years and above will double and reach 2.1 billion. This demographic shift has significant demand drivers in joint replacement surgeries because factors like osteoarthritis, osteoporosis, and wear out of joints are very prevalent at this age.
Chronic joint pain and impaired mobility afflict elderly patients; the latter does impact the quality of life for many patients. Replacement surgeries involving joints, specifically the knee, hip, and shoulder, aim to improve functional recovery and eliminate discomfort and pain. Technological progress and innovation in the surgical approach as well as the type of implants also increase the chances of successful recovery and improve treatment possibilities for patients who have some kind of background pathology.
The increasing concern for active aging is also the result. Modern seniors are much more active than previous generations, seeking independence and high-performance physical activities. This has increased the demand for high-performance implants that could achieve their style of life performance.
Healthcare infrastructure improvement and government subsidy to aging populations for joint replacement surgeries is further amplifying the market potential in developed and emerging economies.
Complexity of Custom and Patient-Specific Implants Is Emerging as Significant Growth Barrier for Joint Replacement Market.
The adoption of custom and patient-specific implants in the joint replacement market is difficult because of their inherent complexity. These implants are designed to fit individual anatomical variations, and thus, they require advanced imaging technologies such as CT or MRI scans for precise measurements. This initial step is both time-consuming and expensive, adding to the overall cost of the procedure.
After imaging, the design and manufacturing of patient-specific implants involves complex 3D modeling and additive manufacturing techniques. This introduces longer lead times than standard implants, often delaying surgical schedules, which can be a significant drawback in cases where timely intervention is critical, such as trauma or advanced degenerative conditions.
Use of patient-specific implants requires higher preparation levels for surgeons: customized surgical planning and getting used to the special instruments or workflows. In that regard, these implants make surgeries more complicated, which prolongs surgery time and places a higher barrier to the learning curve of the medical teams involved, especially in resource-limited healthcare environments.
Furthermore, due to the associated higher cost, custom implants are not so accessible in cheaper regions or among patients who have insufficient insurance coverage. These factors collectively keep from mass adoption this patient-specific implant despite its perceived clinical benefits and therefore restrains its contribution to overall market growth in joint replacements.
Tier 1 companies comprise market leaders with a significant market share of 24.1% in global market. These companies engage in strategic partnerships and acquisitions to expand their product portfolios and access cutting-edge technologies. Additionally, they emphasize extensive clinical trials to validate the efficacy and safety of their products. Prominent companies in tier 1 include Johnson & Johnson Services, Inc., Stryker, Zimmer Biomet and Smith+Nephew.
Tier 2 companies include mid-size players having presence in specific regions and highly influencing the local market and holds around 33.5% market share. They typically pursue partnerships with academic institutions and research organizations to leverage emerging technologies and expedite product development.
These companies often emphasize agility and adaptability, allowing them to quickly bring new treatments to market, additionally targeting specific types medical conditions. Additionally, they focus on cost-effective production methods to offer competitive pricing. Prominent companies in tier 2 include DJO, LLC., Arthrex, Inc. and Exactech, Inc
Finally, Tier 3 companies, such as Conformis, MicroPort Orthopedics and Corin Group. They specialize in specific products and cater to niche markets, adding diversity to the industry.
Overall, while Tier 1 companies are the primary drivers of the market, Tier 2 and 3 companies also make significant contributions, ensuring the joint replacement sales remains dynamic and competitive.
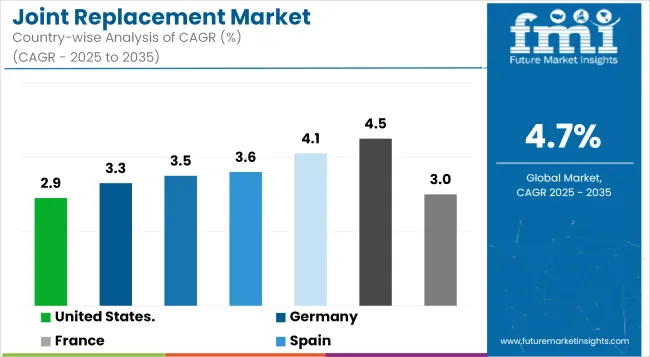
| Country | Value CAGR (2025 to 2035) |
|---|---|
| United States. | 2.9% |
| Germany | 3.3% |
| France | 3.5% |
| Spain | 3.6% |
| China | 4.1% |
| India | 4.5% |
| Australia & New Zealand | 3.0% |
| Japan | 3.9% |
The section below covers the industry analysis for the joint replacement market for different countries. Market demand analysis on key countries in several regions of the globe, including North America, Latin America, East Asia, South Asia & Pacific, Western Europe, Eastern Europe and Middle Ease & Africa, is provided. The United States is anticipated to remain at the forefront in North America, with higher market share through 2035. In South Asia & Pacific, India is projected to witness a CAGR of 4.5% by 2035.
United States. joint replacement market is poised to exhibit a CAGR of 2.9% between 2025 and 2035. Currently, it holds the highest share in the North American market.
Comprehensive coverage under insurance as well as favorable and effective reimbursement policy is the drivers of the replacement market in America, which will greatly enhance its accessibility. Public programs like Medicaid and Medicare coupled with private and other insurance players are covering enormous portions of the procedures that are necessary for joint replacement: hospital stay implants, and much more post-operational care services. This does not burden the pocket of the patients and thus results in the consumption of the most necessary procedures timely.
The reimbursement rates in the United States are encouraging health care providers to adopt advanced technologies, such as robotic-assisted surgery and patient-specific implants, thus ensuring the availability of cutting-edge solutions. Further, policies for outpatient surgeries and bundled payment models are fostering cost efficiency while maintaining high procedural volumes.
This favorable financial landscape, combined with the country’s aging population and high prevalence of joint disorders, makes joint replacement surgeries highly accessible, reinforcing the United States dominance in the global market.
Germany joint replacement market is poised to exhibit a CAGR of 3.3% between 2025 and 2035. Currently, it holds the highest share in the Western Europe market, and the trend is expected to continue during the forecast period.
High-volume orthopedic surgery, including joint replacement surgeries, is an important driver for growth in Germany. The population is aging with increasing incidence of degenerative joint diseases such as osteoarthritis, primarily in the hip, knee, and shoulder joints. As such conditions increase in age, there is a subsequent rise in joint replacement surgeries; therefore, Germany represents one of the largest markets in Europe for such procedures.
Another aspect is the progress in surgical technology, including minimal invasive surgery. These have been associated with a higher volume of surgeries because of faster recovery periods and fewer complications. The infrastructure of healthcare and full insurance coverage in the country make these services more accessible to patients, increasing demand. A consistent and rising demand for joint replacement surgeries, especially in the hip and knee, is what has been pushing Germany to become the market leader.
Japan joint replacement market is poised to exhibit a CAGR of 3.9% between 2025 and 2035. Currently, it holds the highest share in the South Asia & Pacific market, and the trend is expected to continue during the forecast period.
Japan has one of the most aging populations worldwide, with an increasingly significant percentage of its citizens above the age of 65 years, age-related degenerative joint diseases like osteoarthritis have risen substantially. Such diseases typically occur in the hip, knee, and shoulder, leading to chronic pain and a lack of mobility. Therefore, it is not surprising that joint replacement surgery is one of the increasingly required operations.
As the elderly population of Japan maintains their mobility and health, demand for joint replacements, such as hip and knee surgical procedures, will increase. However, demand for these procedures is not solely supported by the elders but are also amplified due to Japan's universal healthcare system that permits easy access to treatments.
The ageing population sustains such surgeries, while encouraging developments on the implant technology and minimal invasive procedures, a source of Japan's top position globally in joint replacement.
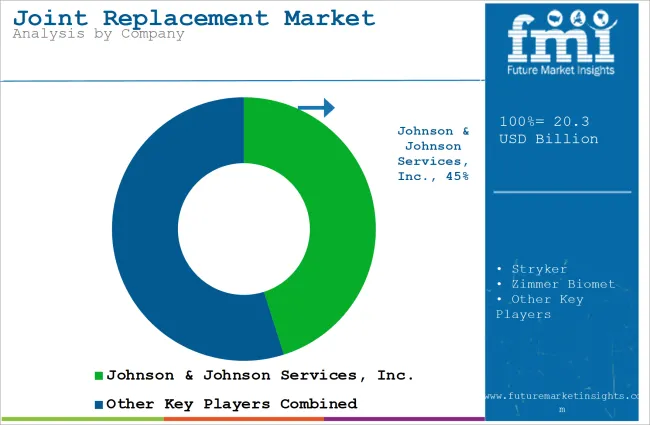
The joint replacement market is witnessing high competition driven by continuous innovation, improved patient outcomes, and expanding global access. Key players are advancing surgical technologies through robotics, AI-assisted surgical planning and innovative implant systems to gain a competitive edge. Emphasis is being placed on minimally invasive procedures, faster recovery solutions and revision-ready implants.
To strengthen market presence, companies are engaging in strategic collaborations with hospitals, enhancing surgeon training programs, and expanding footprints in emerging economies through localized production. Service differentiation, regulatory compliance, and real-time implant performance monitoring are also being prioritized. Overall, the market is evolving rapidly through technology-driven competition, efficiency in care delivery, and increased focus on personalized orthopedic solutions.
Key Development:
The global joint replacement market is projected to witness CAGR of 4.7% between 2025 and 2035.
The global joint replacement industry stood at USD 19.4 billion in 2024.
The global joint replacement market is anticipated to reach USD 37.3 billion by 2035 end.
India is set to record the highest CAGR of 4.5% in the assessment period.
The key players operating in the global joint replacement market include Johnson & Johnson Services, Inc., Stryker, Zimmer Biomet, Smith+Nephew, DJO, LLC., Arthrex, Inc., Exactech, Inc., Conformis, MicroPort Orthopedics and Corin Group.


Full Research Suite comprises of:
Market outlook & trends analysis
Interviews & case studies
Strategic recommendations
Vendor profiles & capabilities analysis
5-year forecasts
8 regions and 60+ country-level data splits
Market segment data splits
12 months of continuous data updates
DELIVERED AS:
PDF EXCEL ONLINE
Joint Compound Market Size and Share Forecast Outlook 2025 to 2035
Joint Reconstruction Devices Market Overview - Trends & Forecast 2024-2034
Bone and Joint Health Supplement Market Analysis by Product Type, Form and Sale Channels Through 2035
Ready Mix Joint Compound Market Size and Share Forecast Outlook 2025 to 2035
Universal Joint Shafts Market
Demand for Joint Compound in EU Size and Share Forecast Outlook 2025 to 2035
Plastic Pipe Jointing and Welding Market
Latin America Joint Compound Industry Analysis Size and Share Forecast Outlook 2025 to 2035
Bridge Expansion Joints Market Growth - Trends & Forecast 2025 to 2035
Rotary and RF Rotary Joints Market Size and Share Forecast Outlook 2025 to 2035
Hot Melt Intermediate Joint Market Size and Share Forecast Outlook 2025 to 2035
Replacement Sheets Market Analysis - Size, Share & Forecast 2025 to 2035
Egg Replacement Ingredient Market Analysis - Size, Share & Forecast 2025 to 2035
Knee Replacement Market Size and Share Forecast Outlook 2025 to 2035
Meal Replacement Bars Market Size, Growth, and Forecast for 2025 to 2035
Meal Replacement Products Market Analysis by Product type, source, application and region Through 2035
Skin Replacement Market Growth - Trends & Forecast 2024 to 2034
Meal Replacement Shake Market Trends - Powder & Liquid Analysis
Metal Replacement Market Growth – Trends & Forecast 2024-2034
Enzyme Replacement Therapy Market Insights - Size & Forecast 2025 to 2035

Thank you!
You will receive an email from our Business Development Manager. Please be sure to check your SPAM/JUNK folder too.
Chat With
MaRIA