Reports

- Global Locations -

Headquarters

Future Market Insights, Inc.

Christiana Corporate, 200
Continental Drive, Suite 401,
Newark, Delaware - 19713,
United States

T: +1-845-579-5705

Americas

Future Market Insights, Inc.

616 Corporate Way, Suite 2-9018,
Valley Cottage, NY 10989, United States

T: +1-347-918-3531

MEA

Future Market Insights

1602-6 Jumeirah Bay X2 Tower, Plot No: JLT-PH2-X2A,
Jumeirah Lakes Towers, Dubai,
United Arab Emirates

Europe

Future Market Insights

3rd Floor, 207 Regent Street,
W1B 3HH London
United Kingdom

T: + 44 (0) 20 8123 9659
D: +44 (0) 20 3287 4268

Asia Pacific

Future Market Insights

IndiaLand Global Tech Park, Unit UG-1, Behind Grand HighStreet, Phase 1, Hinjawadi, MH, Pune – 411057, India

Wire Compounds and Cable Compounds Market Outlook(2023 to 2033)

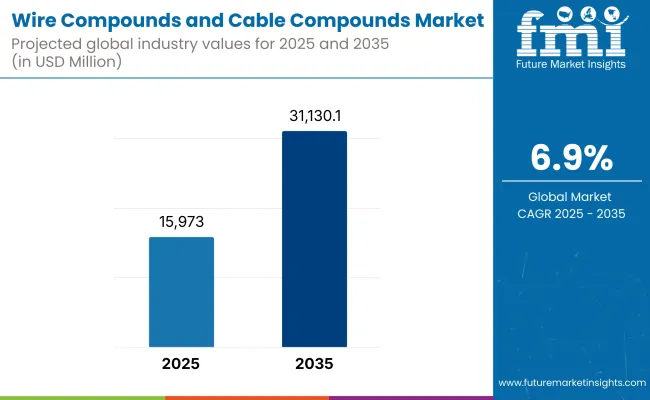
The wire compounds and cable compounds market size is projected to be worth US$ 13.9 billion in 2023. The revenue from sales of wire compounds and cable compounds is anticipated to reach US$ 28 billion by 2033, at a CAGR of 7.2% during the forecast period.

The wire compounds and cable compounds industry is thriving, fueled by several key drivers that propel its growth and innovation. One of the primary drivers is the increasing demand for reliable and high-performance wire and cable solutions across various sectors. Industries such as telecommunications, automotive, energy, and construction rely heavily on these compounds for efficient transmission and connectivity.

The ever-expanding Internet of Things (IoT) ecosystem is driving the need for advanced wire compounds that can support seamless data transmission and power distribution. This surge in demand acts as a catalyst for technological advancements and drives companies to develop cutting-edge compounds to meet evolving industry requirements.

Restraints:

  • Stringent regulatory landscape requiring compliance with safety standards and environmental regulations
  • Market competition driving the need for differentiation through innovative and cost-effective solutions
  • Balancing quality, affordability, and operational efficiency to maintain a competitive edge
  • Continuous investment in research and development to develop sustainable compounds

Investment Opportunities:

  • Lucrative prospects in infrastructure development projects worldwide
  • Investments in renewable energy infrastructure, smart cities, and telecommunications networks
  • Collaborations and partnerships with research institutions and technology providers
  • Opportunities to pioneer groundbreaking innovations and drive industry growth

Latest Trends:

  • Growing focus on eco-friendly compounds, such as halogen-free and low-smoke formulations
  • Integration of smart technologies into wire and cable compounds for enhanced functionality
  • Applications in the Internet of Things (IoT), automation, and energy management sectors
  • Adapting to evolving market needs by staying ahead of industry trends
Attribute Details
Wire Compounds and Cable Compounds Market Size (2023) US$ 13.9 billion
Wire Compounds and Cable Compounds Market Projected Size (2033) US$ 28 billion
Value CAGR (2023 to 2033) 7.2%

Don't pay for what you don't need

Customize your report by selecting specific countries or regions and save 30%!

2018 to 2022 Wire Compounds and Cable Compounds Demand Outlook Compared to 2023 to 2033 Forecast

The demand for wire compounds and cable compounds expanded at a CAGR of 8.6% from 2018 to 2022, reaching US$ 13.9 billion in market value in 2023. From 2018 to 2023, the global wire compounds and cable compounds market witnessed significant growth and transformation. With the increasing demand for reliable and high-performance wire and cable solutions across various industries, the market experienced a surge in investments and technological advancements. Key players in the industry focused on enhancing product offerings, expanding their geographical reach, and adopting innovative manufacturing processes.

During this period, the Wire Compounds and Cable Compounds market experienced robust growth due to several factors. Rising investments in infrastructure development projects, particularly in emerging economies, created a favorable environment for market expansion. Moreover, stringent regulatory requirements and increasing emphasis on environmental sustainability drove the adoption of eco-friendly wire compounds. Manufacturers invested in research and development activities to develop halogen-free and low-smoke formulations, meeting both regulatory standards and customer expectations.

Future Forecast for Wire Compounds and Cable Compounds Industry:

From 2023 to 2033, the global wire compounds and cable compounds industry is anticipated to expand at a CAGR of 7.2%. The market size is anticipated to reach US$ 28 billion during the projected period.

Looking ahead to the period of 2023 to 2033, the Wire Compounds and Cable Compounds industry is poised for continued growth and innovation. Technological advancements and emerging market trends are expected to shape the industry landscape. The increasing focus on renewable energy infrastructure, smart cities, and telecommunications networks are likely to present lucrative investment opportunities.

The integration of smart technologies into wire and cable compounds is likely to revolutionize the industry. The advent of the Internet of Things (IoT), automation, and energy management systems are projected to drive the demand for high-performance wire compounds capable of supporting advanced functionalities.

Amidst these opportunities, the industry is likely to also face challenges. Market competition is projected to intensify, necessitating continuous innovation and cost-effective solutions. Additionally, regulatory compliance is anticipated to remain a critical aspect, demanding adherence to safety standards and environmental regulations.

Comparative View of the Wire Compounds and Cable Compounds Market

Wire Compounds and Cable Compounds Market:

Attributes Wire Compounds and Cable Compounds Market
CAGR (2023 to 2033) 7.2%
Market Value (2033) US$ 28 billion
Opportunity Growing demand for high-performance and reliable wire and cable solutions across various industries, such as telecommunications, energy, and automotive.
Key Trends Increasing adoption of advanced materials, such as flame-retardant and eco-friendly compounds, to enhance the safety, durability, and efficiency of wire and cable applications.

Automotive Wire & Cable Materials Market:

Attributes Automotive Wire & Cable Materials Market
CAGR (2023 to 2033) 6%
Market Value (2033) US$ 9 billion
Opportunity Rising production of electric and hybrid vehicles driving the demand for specialized wire and cable materials that offer high conductivity, thermal resistance, and lightweight properties.
Key Trends Shift towards lightweight and eco-friendly wire and cable materials, such as aluminum and recyclable plastics, to improve fuel efficiency and reduce emissions in automotive applications.

Wire Insulation and Jacketing Compounds Market:

Attributes Wire Insulation and Jacketing Compounds Market
CAGR (2023 to 2033) 8%
Market Value (2033) US$ 14 billion
Opportunity Growing investments in infrastructure development and the construction industry fueling the demand for high-quality wire insulation and jacketing compounds for electrical installations.
Key Trends Increasing focus on fire-resistant and low-smoke compounds to ensure safety in building wiring applications and compliance with stringent fire safety regulations.
Nikhil Kaitwade
Nikhil Kaitwade

Principal Consultant

Talk to Analyst

Find your sweet spots for generating winning opportunities in this market.

Country-Wise Insights

Rise of Sustainable Solutions in the United States Wire Compounds and Cable Compounds Industry

Country United States
Market Size (US$ million) by End of Forecast Period (2033) US$ 5 billion
CAGR % 2023 to End of Forecast (2033) 7.2%

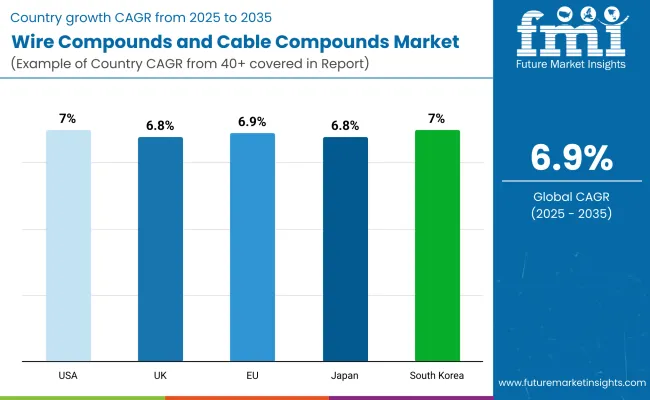
The United States is expected to witness significant growth in the wire compounds and cable compounds industry, with a projected CAGR of 7.2% from 2023 to 2033. In terms of market size, the industry is estimated to reach around US$ 5 billion by the end of the forecast period. The strong growth can be attributed to factors such as increasing investments in infrastructure development, the adoption of advanced electrical technologies, and the demand for high-quality wiring solutions across various industries. The United States' focus on renewable energy sources and the modernization of existing power grids further fuels the demand for wire compounds and cable compounds, driving the market's growth.

United Kingdom to Witness Increasing Innovation and Adoption of Wire Compounds and Cable Compounds

Country United Kingdom
Market Size (US$ million) by End of Forecast Period (2033) US$ 1 billion
CAGR % 2023 to End of Forecast (2033) 6.9%

The wire compounds and cable compounds industry in the United Kingdom is poised for steady growth, with a projected CAGR of 6.9% from 2023 to 2033. The market size is expected to reach approximately US$ 1 billion by the end of the forecast period. The growth is attributed to factors such as ongoing infrastructure development projects, the increasing focus on energy-efficient buildings, and the demand for advanced wiring solutions in industries like construction, automotive, and telecommunications. Additionally, government initiatives promoting renewable energy sources and the expansion of smart cities further contribute to the demand for wire compounds and cable compounds in the United Kingdom.

China to Witness Explosive Growth in Sales of Wire Compounds and Cable Compounds

Country China
Market Size (US$ million) by End of Forecast Period (2033) US$ 6.6 billion
CAGR % 2023 to End of Forecast (2033) 7.2%

China is poised to dominate the wire compounds and cable compounds industry, with a projected CAGR of 7.2% from 2023 to 2033. The market size in China is estimated to reach around US$ 6.6 billion by the end of the forecast period. The robust growth is driven by factors such as rapid urbanization, infrastructure development, and the rising demand for energy and telecommunications infrastructure. Additionally, the Chinese government's focus on expanding renewable energy sources and upgrading power transmission networks further stimulates the demand for wire compounds and cable compounds in the country.

How Rising Demand for Precision and Reliability Drives the Japanese Wire Compounds and Cable Compounds Industry?

Country Japan
Market Size (US$ million) by End of Forecast Period (2033) US$ 4.2 billion
CAGR % 2023 to End of Forecast (2033) 7.0%

The wire compounds and cable compounds industry in Japan is expected to experience substantial growth, with a projected CAGR of 7.0% from 2023 to 2033. The market size in Japan is estimated to reach approximately US$ 4.2 billion by the end of the forecast period. The growth is driven by factors such as the demand for advanced electrical infrastructure, technological advancements in the automotive and electronic sectors, and the government's initiatives to upgrade power distribution networks. Japan's emphasis on energy efficiency and the adoption of sustainable technologies further contribute to the demand for wire compounds and cable compounds in the country.

South Korea Wire Compounds and Cable Compounds Market Outlook

Country South Korea
Market Size (US$ million) by End of Forecast Period (2033) US$ 1.4 billion
CAGR % 2023 to End of Forecast (2033) 6.8

South Korea's wire compounds and cable compounds market is set to witness a steady surge, forging ahead with a CAGR of 6.8% from 2023 till 2033. By the end of this period, the market size in South Korea is anticipated to scale an impressive valuation of around US$ 1.4 billion. This growth can be attributed to various factors fueling the market, including robust industrial development, the rapid expansion of telecommunication networks, and the country's focus on renewable energy initiatives. The increasing demand for technologically advanced wiring solutions in sectors like automotive, electronics, and construction further propels the market's progress.

Category-wise Insights

How Halogenated Polymers Turned Out to Be a Game-Changer in the Wire Compounds and Cable Compounds Industry?

The dominating type segment, halogenated polymers is projected to expand at a CAGR of 7.1% from 2023 to 2033. In 2023, this segment held a significant market share, demonstrating its prominence in the industry. Halogenated Polymers offer exceptional flame-retardant properties, making them ideal for applications requiring high levels of fire safety. Their widespread use in industries such as construction, automotive, and telecommunications contributes to their market dominance. Additionally, the increasing demand for halogen-free and environmentally friendly alternatives presents a potential opportunity for innovation within this segment.

By End-use, Construction Segment Dominates the Market with a CAGR of 6.9 through 2033

The construction segment is expected to exhibit a CAGR of 6.9% from 2023 to 2033. This segment captured a significant market share in 2023, driven by robust growth in infrastructure development and the construction industry. Wire compounds and cable compounds play a crucial role in providing reliable and efficient electrical connections in construction projects.

Factors such as increasing urbanization, investments in smart cities, and the need for advanced wiring solutions contribute to the dominance of the Construction segment. Moreover, the rising focus on energy-efficient buildings and sustainable construction practices presents an opportunity for the development of innovative wire and cable materials tailored to meet these requirements.

Get the data you need at a Fraction of the cost

Personalize your report by choosing insights you need
and save 40%!

How Key Players Stay Competitive in the Wire Compounds and Cable Compounds Industry?

In this highly competitive industry, several key players are taking strategic measures to maintain their position at the top. To stay at the forefront, these key players are continuously investing in research and development activities. They are leveraging advanced technologies and materials to develop wire compounds and cable compounds that offer superior performance, enhanced durability, and improved safety features. By anticipating market trends and customer demands, these companies can proactively meet the evolving needs of various industries, including automotive, construction, and electronics.

To strengthen their market position and expand their global footprint, key players are actively engaging in strategic partnerships, mergers, and acquisitions. Collaborations with suppliers, distributors, and end-users enable these companies to enhance their product offerings, reach a wider customer base, and explore new market segments. Moreover, key players are also focusing on expanding their production capacities and establishing manufacturing facilities in emerging economies to tap into untapped market potential.

As sustainability becomes a growing concern, key players are investing in the development of eco-friendly wire compounds and cable compounds. They are incorporating recyclable materials, reducing energy consumption in manufacturing processes, and implementing sustainable waste management practices. By aligning their business strategies with environmental goals, these companies are not only meeting regulatory requirements but also catering to the increasing demand for sustainable solutions from environmentally conscious consumers.

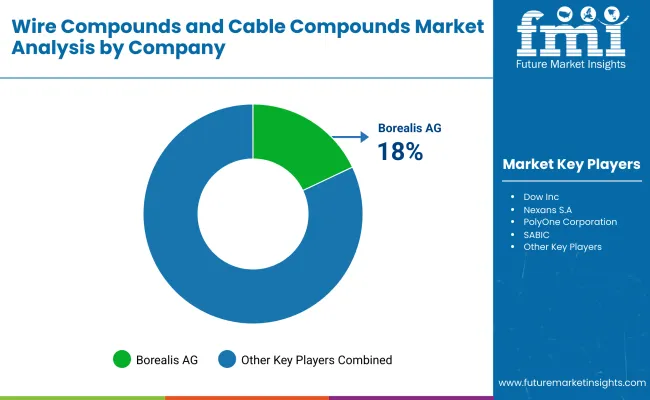
Key Players in the Wire Compounds and Cable Compounds Industry

  • DuPont de Nemours, Inc.
  • Evonik Industries AG
  • Eastman Chemical Company
  • Furukawa Electric Co., Ltd.
  • Hanwha Solutions

How can Manufacturers/Service Providers Scale their Businesses in the Wire Compounds and Cable Compounds Market?

Strategies for Scaling Businesses in the Wire Compounds and Cable Compounds Market

  • Diversify Product Portfolio

Expand product offerings by developing a comprehensive range of wire compounds and cable compounds catering to different industry requirements. This allows manufacturers/service providers to capture a wider customer base and address diverse market needs.

  • Embrace Technological Advancements

Stay at the forefront of technology by adopting advanced manufacturing processes, automation, and digitalization. Incorporate innovative materials and production techniques to enhance product quality, efficiency, and performance.

  • Focus on Research and Development

Invest in robust R&D activities to continually innovate and develop cutting-edge wire compounds and cable compounds. This includes exploring new materials, improving product properties, and meeting evolving regulatory standards.

  • Enhance Customer Relationships

Build strong and lasting relationships with customers by offering excellent customer service, personalized solutions, and timely support. Regularly engage with customers to understand their evolving needs and provide tailored products and services.

  • Strengthen Supply Chain Management

Optimize supply chain operations by collaborating with reliable suppliers, ensuring a steady flow of raw materials, and implementing efficient inventory management systems. Streamline logistics to meet customer demands promptly and reduce lead times.

  • Expand Geographical Reach

Identify new market opportunities and expand into untapped regions. Establish partnerships or set up distribution channels to reach customers in different geographical locations. Adapt products and marketing strategies to suit local market requirements.

  • Foster Innovation and Differentiation

Encourage a culture of innovation within the organization by fostering creativity and collaboration. Differentiate products by offering unique features, improved performance, sustainability, and value-added services.

  • Stay Abreast of Market Trends

Monitor market trends, technological advancements, and changing customer preferences. Continuously adapt strategies and product offerings to align with emerging market demands and maintain a competitive edge.

  • Invest in Talent and Skills

Attract and retain skilled professionals who possess expertise in wire compounds and cable compound manufacturing. Invest in employee training and development to ensure a competent workforce capable of driving business growth.

  • Focus on Sustainability

Emphasize sustainability by adopting eco-friendly practices, using recyclable materials, reducing carbon footprint, and complying with environmental regulations. Highlight sustainable initiatives to appeal to environmentally conscious customers and gain a competitive advantage

Latest Developments in the Wire Compounds and Cable Compounds Market

  • DuPont de Nemours, Inc.
    • Launch of innovative wire compounds with enhanced fire-resistant properties.
    • Collaboration with industry partners to develop sustainable and eco-friendly cable compounds.
    • Expansion of manufacturing facilities to meet growing market demand.
  • Evonik Industries AG
    • Introduction of high-performance wire insulation compounds for automotive applications.
    • Investment in research and development to enhance product quality and performance.
    • Strategic partnerships with cable manufacturers to develop customized solutions.
  • Eastman Chemical Company
    • Development of halogen-free wire compounds complying with stringent environmental regulations.
    • Focus on sustainable manufacturing practices and the use of recyclable materials.
    • Introduction of advanced cable jacketing compounds for improved durability and protection.

Segmentation Analysis of the Wire Compounds and Cable Compounds Market

By Type:

  • Halogenated Polymers
  • Non Halogenated Polymers

By End-Use:

  • Construction
  • Power
  • Communications
  • Automotive
  • Others

By Region:

  • North America
  • Latin America
  • Europe
  • East Asia
  • South Asia
  • Oceania
  • Middle East & Africa

Frequently Asked Questions

What is the Total Demand for Wire Compounds and Cable Compounds Worldwide?

Worldwide demand in 2023 can accrue almost US$ 13.9 billion.

What is the Global Market Forecast for Wire Compounds and Cable Compounds Sales?

The global sales of such compounds is forecasted to generate US$ 28 billion by 2033.

What is the Total Revenue from Wire Compounds and Cable Compounds Sales in the United States?

The regional market is forecasted to generate a revenue of around US$ 5 billion by 2033.

Which Sector is the Leading User of Wire Compounds and Cable Compounds?

The construction sector is the leading segment and could witness 6.9% CAGR until 2033.

Who are the Leading Players in the Wire Compounds and Cable Compounds Market?

DuPont, Evonik, and Eastman are the top manufacturers.

Table of Content

1. Executive Summary

    1.1. Global Market Outlook

    1.2. Demand-side Trends

    1.3. Supply-side Trends

    1.4. Technology Roadmap Analysis

    1.5. Analysis and Recommendations

2. Market Overview

    2.1. Market Coverage / Taxonomy

    2.2. Market Definition / Scope / Limitations

3. Market Background

    3.1. Market Dynamics

        3.1.1. Drivers

        3.1.2. Restraints

        3.1.3. Opportunity

        3.1.4. Trends

    3.2. Scenario Forecast

        3.2.1. Demand in Optimistic Scenario

        3.2.2. Demand in Likely Scenario

        3.2.3. Demand in Conservative Scenario

    3.3. Opportunity Map Analysis

    3.4. Product Life Cycle Analysis

    3.5. Supply Chain Analysis

        3.5.1. Supply Side Participants and their Roles

            3.5.1.1. Producers

            3.5.1.2. Mid-Level Participants (Traders/ Agents/ Brokers)

            3.5.1.3. Wholesalers and Distributors

        3.5.2. Value Added and Value Created at Node in the Supply Chain

        3.5.3. List of Raw Material Suppliers

        3.5.4. List of Existing and Potential Buyer’s

    3.6. Investment Feasibility Matrix

    3.7. Value Chain Analysis

        3.7.1. Profit Margin Analysis

        3.7.2. Wholesalers and Distributors

        3.7.3. Retailers

    3.8. PESTLE and Porter’s Analysis

    3.9. Regulatory Landscape

        3.9.1. By Key Regions

        3.9.2. By Key Countries

    3.10. Regional Parent Market Outlook

    3.11. Production and Consumption Statistics

    3.12. Import and Export Statistics

4. Global Market Analysis 2018 to 2022 and Forecast, 2023 to 2033

    4.1. Historical Market Size Value (US$ Million) & Volume (MT) Analysis, 2018 to 2022

    4.2. Current and Future Market Size Value (US$ Million) & Volume (MT) Projections, 2023 to 2033

        4.2.1. Y-o-Y Growth Trend Analysis

        4.2.2. Absolute $ Opportunity Analysis

5. Global Market Analysis 2018 to 2022 and Forecast 2023 to 2033, By Type

    5.1. Introduction / Key Findings

    5.2. Historical Market Size Value (US$ Million) & Volume (MT) Analysis By Type, 2018 to 2022

    5.3. Current and Future Market Size Value (US$ Million) & Volume (MT) Analysis and Forecast By Type, 2023 to 2033

        5.3.1. Halogenated Polymers

        5.3.2. Non-Halogenated Polymers

    5.4. Y-o-Y Growth Trend Analysis By Type, 2018 to 2022

    5.5. Absolute $ Opportunity Analysis By Type, 2023 to 2033

6. Global Market Analysis 2018 to 2022 and Forecast 2023 to 2033, By End-Use

    6.1. Introduction / Key Findings

    6.2. Historical Market Size Value (US$ Million) & Volume (MT) Analysis By End-Use, 2018 to 2022

    6.3. Current and Future Market Size Value (US$ Million) & Volume (MT) Analysis and Forecast By End-Use, 2023 to 2033

        6.3.1. Construction

        6.3.2. Power

        6.3.3. Communications

        6.3.4. Automotive

        6.3.5. Others

    6.4. Y-o-Y Growth Trend Analysis By End-Use, 2018 to 2022

    6.5. Absolute $ Opportunity Analysis By End-Use, 2023 to 2033

7. Global Market Analysis 2018 to 2022 and Forecast 2023 to 2033, By Region

    7.1. Introduction

    7.2. Historical Market Size Value (US$ Million) & Volume (MT) Analysis By Region, 2018 to 2022

    7.3. Current Market Size Value (US$ Million) & Volume (MT) Analysis and Forecast By Region, 2023 to 2033

        7.3.1. North America

        7.3.2. Latin America

        7.3.3. Europe

        7.3.4. Asia Pacific

        7.3.5. MEA

    7.4. Market Attractiveness Analysis By Region

8. North America Market Analysis 2018 to 2022 and Forecast 2023 to 2033, By Country

    8.1. Historical Market Size Value (US$ Million) & Volume (MT) Trend Analysis By Market Taxonomy, 2018 to 2022

    8.2. Market Size Value (US$ Million) & Volume (MT) Forecast By Market Taxonomy, 2023 to 2033

        8.2.1. By Country

            8.2.1.1. USA

            8.2.1.2. Canada

        8.2.2. By Type

        8.2.3. By End-Use

    8.3. Market Attractiveness Analysis

        8.3.1. By Country

        8.3.2. By Type

        8.3.3. By End-Use

    8.4. Key Takeaways

9. Latin America Market Analysis 2018 to 2022 and Forecast 2023 to 2033, By Country

    9.1. Historical Market Size Value (US$ Million) & Volume (MT) Trend Analysis By Market Taxonomy, 2018 to 2022

    9.2. Market Size Value (US$ Million) & Volume (MT) Forecast By Market Taxonomy, 2023 to 2033

        9.2.1. By Country

            9.2.1.1. Brazil

            9.2.1.2. Mexico

            9.2.1.3. Rest of Latin America

        9.2.2. By Type

        9.2.3. By End-Use

    9.3. Market Attractiveness Analysis

        9.3.1. By Country

        9.3.2. By Type

        9.3.3. By End-Use

    9.4. Key Takeaways

10. Europe Market Analysis 2018 to 2022 and Forecast 2023 to 2033, By Country

    10.1. Historical Market Size Value (US$ Million) & Volume (MT) Trend Analysis By Market Taxonomy, 2018 to 2022

    10.2. Market Size Value (US$ Million) & Volume (MT) Forecast By Market Taxonomy, 2023 to 2033

        10.2.1. By Country

            10.2.1.1. Germany

            10.2.1.2. UK

            10.2.1.3. France

            10.2.1.4. Spain

            10.2.1.5. Italy

            10.2.1.6. Rest of Europe

        10.2.2. By Type

        10.2.3. By End-Use

    10.3. Market Attractiveness Analysis

        10.3.1. By Country

        10.3.2. By Type

        10.3.3. By End-Use

    10.4. Key Takeaways

11. Asia Pacific Market Analysis 2018 to 2022 and Forecast 2023 to 2033, By Country

    11.1. Historical Market Size Value (US$ Million) & Volume (MT) Trend Analysis By Market Taxonomy, 2018 to 2022

    11.2. Market Size Value (US$ Million) & Volume (MT) Forecast By Market Taxonomy, 2023 to 2033

        11.2.1. By Country

            11.2.1.1. China

            11.2.1.2. Japan

            11.2.1.3. South Korea

            11.2.1.4. Singapore

            11.2.1.5. Thailand

            11.2.1.6. Indonesia

            11.2.1.7. Australia

            11.2.1.8. New Zealand

            11.2.1.9. Rest of Asia Pacific

        11.2.2. By Type

        11.2.3. By End-Use

    11.3. Market Attractiveness Analysis

        11.3.1. By Country

        11.3.2. By Type

        11.3.3. By End-Use

    11.4. Key Takeaways

12. MEA Market Analysis 2018 to 2022 and Forecast 2023 to 2033, By Country

    12.1. Historical Market Size Value (US$ Million) & Volume (MT) Trend Analysis By Market Taxonomy, 2018 to 2022

    12.2. Market Size Value (US$ Million) & Volume (MT) Forecast By Market Taxonomy, 2023 to 2033

        12.2.1. By Country

            12.2.1.1. GCC Countries

            12.2.1.2. South Africa

            12.2.1.3. Israel

            12.2.1.4. Rest of MEA

        12.2.2. By Type

        12.2.3. By End-Use

    12.3. Market Attractiveness Analysis

        12.3.1. By Country

        12.3.2. By Type

        12.3.3. By End-Use

    12.4. Key Takeaways

13. Key Countries Market Analysis

    13.1. USA

        13.1.1. Pricing Analysis

        13.1.2. Market Share Analysis, 2022

            13.1.2.1. By Type

            13.1.2.2. By End-Use

    13.2. Canada

        13.2.1. Pricing Analysis

        13.2.2. Market Share Analysis, 2022

            13.2.2.1. By Type

            13.2.2.2. By End-Use

    13.3. Brazil

        13.3.1. Pricing Analysis

        13.3.2. Market Share Analysis, 2022

            13.3.2.1. By Type

            13.3.2.2. By End-Use

    13.4. Mexico

        13.4.1. Pricing Analysis

        13.4.2. Market Share Analysis, 2022

            13.4.2.1. By Type

            13.4.2.2. By End-Use

    13.5. Germany

        13.5.1. Pricing Analysis

        13.5.2. Market Share Analysis, 2022

            13.5.2.1. By Type

            13.5.2.2. By End-Use

    13.6. UK

        13.6.1. Pricing Analysis

        13.6.2. Market Share Analysis, 2022

            13.6.2.1. By Type

            13.6.2.2. By End-Use

    13.7. France

        13.7.1. Pricing Analysis

        13.7.2. Market Share Analysis, 2022

            13.7.2.1. By Type

            13.7.2.2. By End-Use

    13.8. Spain

        13.8.1. Pricing Analysis

        13.8.2. Market Share Analysis, 2022

            13.8.2.1. By Type

            13.8.2.2. By End-Use

    13.9. Italy

        13.9.1. Pricing Analysis

        13.9.2. Market Share Analysis, 2022

            13.9.2.1. By Type

            13.9.2.2. By End-Use

    13.10. China

        13.10.1. Pricing Analysis

        13.10.2. Market Share Analysis, 2022

            13.10.2.1. By Type

            13.10.2.2. By End-Use

    13.11. Japan

        13.11.1. Pricing Analysis

        13.11.2. Market Share Analysis, 2022

            13.11.2.1. By Type

            13.11.2.2. By End-Use

    13.12. South Korea

        13.12.1. Pricing Analysis

        13.12.2. Market Share Analysis, 2022

            13.12.2.1. By Type

            13.12.2.2. By End-Use

    13.13. Singapore

        13.13.1. Pricing Analysis

        13.13.2. Market Share Analysis, 2022

            13.13.2.1. By Type

            13.13.2.2. By End-Use

    13.14. Thailand

        13.14.1. Pricing Analysis

        13.14.2. Market Share Analysis, 2022

            13.14.2.1. By Type

            13.14.2.2. By End-Use

    13.15. Indonesia

        13.15.1. Pricing Analysis

        13.15.2. Market Share Analysis, 2022

            13.15.2.1. By Type

            13.15.2.2. By End-Use

    13.16. Australia

        13.16.1. Pricing Analysis

        13.16.2. Market Share Analysis, 2022

            13.16.2.1. By Type

            13.16.2.2. By End-Use

    13.17. New Zealand

        13.17.1. Pricing Analysis

        13.17.2. Market Share Analysis, 2022

            13.17.2.1. By Type

            13.17.2.2. By End-Use

    13.18. GCC Countries

        13.18.1. Pricing Analysis

        13.18.2. Market Share Analysis, 2022

            13.18.2.1. By Type

            13.18.2.2. By End-Use

    13.19. South Africa

        13.19.1. Pricing Analysis

        13.19.2. Market Share Analysis, 2022

            13.19.2.1. By Type

            13.19.2.2. By End-Use

    13.20. Israel

        13.20.1. Pricing Analysis

        13.20.2. Market Share Analysis, 2022

            13.20.2.1. By Type

            13.20.2.2. By End-Use

14. Market Structure Analysis

    14.1. Competition Dashboard

    14.2. Competition Benchmarking

    14.3. Market Share Analysis of Top Players

        14.3.1. By Regional

        14.3.2. By Type

        14.3.3. By End-Use

15. Competition Analysis

    15.1. Competition Deep Dive

        15.1.1. DuPont de Nemours, Inc.

            15.1.1.1. Overview

            15.1.1.2. Product Portfolio

            15.1.1.3. Profitability by Market Segments

            15.1.1.4. Sales Footprint

            15.1.1.5. Strategy Overview

                15.1.1.5.1. Marketing Strategy

                15.1.1.5.2. Product Strategy

                15.1.1.5.3. Channel Strategy

        15.1.2. Evonik Industries AG

            15.1.2.1. Overview

            15.1.2.2. Product Portfolio

            15.1.2.3. Profitability by Market Segments

            15.1.2.4. Sales Footprint

            15.1.2.5. Strategy Overview

                15.1.2.5.1. Marketing Strategy

                15.1.2.5.2. Product Strategy

                15.1.2.5.3. Channel Strategy

        15.1.3. Eastman Chemical Company

            15.1.3.1. Overview

            15.1.3.2. Product Portfolio

            15.1.3.3. Profitability by Market Segments

            15.1.3.4. Sales Footprint

            15.1.3.5. Strategy Overview

                15.1.3.5.1. Marketing Strategy

                15.1.3.5.2. Product Strategy

                15.1.3.5.3. Channel Strategy

        15.1.4. Furukawa Electric Co., Ltd.

            15.1.4.1. Overview

            15.1.4.2. Product Portfolio

            15.1.4.3. Profitability by Market Segments

            15.1.4.4. Sales Footprint

            15.1.4.5. Strategy Overview

                15.1.4.5.1. Marketing Strategy

                15.1.4.5.2. Product Strategy

                15.1.4.5.3. Channel Strategy

        15.1.5. Hanwha Solutions

            15.1.5.1. Overview

            15.1.5.2. Product Portfolio

            15.1.5.3. Profitability by Market Segments

            15.1.5.4. Sales Footprint

            15.1.5.5. Strategy Overview

                15.1.5.5.1. Marketing Strategy

                15.1.5.5.2. Product Strategy

                15.1.5.5.3. Channel Strategy

        15.1.6. Exxon Mobil Corporation

            15.1.6.1. Overview

            15.1.6.2. Product Portfolio

            15.1.6.3. Profitability by Market Segments

            15.1.6.4. Sales Footprint

            15.1.6.5. Strategy Overview

                15.1.6.5.1. Marketing Strategy

                15.1.6.5.2. Product Strategy

                15.1.6.5.3. Channel Strategy

        15.1.7. Belden, Inc.

            15.1.7.1. Overview

            15.1.7.2. Product Portfolio

            15.1.7.3. Profitability by Market Segments

            15.1.7.4. Sales Footprint

            15.1.7.5. Strategy Overview

                15.1.7.5.1. Marketing Strategy

                15.1.7.5.2. Product Strategy

                15.1.7.5.3. Channel Strategy

        15.1.8. Nexans SA

            15.1.8.1. Overview

            15.1.8.2. Product Portfolio

            15.1.8.3. Profitability by Market Segments

            15.1.8.4. Sales Footprint

            15.1.8.5. Strategy Overview

                15.1.8.5.1. Marketing Strategy

                15.1.8.5.2. Product Strategy

                15.1.8.5.3. Channel Strategy

        15.1.9. General Cable Technologies Corporation

            15.1.9.1. Overview

            15.1.9.2. Product Portfolio

            15.1.9.3. Profitability by Market Segments

            15.1.9.4. Sales Footprint

            15.1.9.5. Strategy Overview

                15.1.9.5.1. Marketing Strategy

                15.1.9.5.2. Product Strategy

                15.1.9.5.3. Channel Strategy

        15.1.10. LEONI AG

            15.1.10.1. Overview

            15.1.10.2. Product Portfolio

            15.1.10.3. Profitability by Market Segments

            15.1.10.4. Sales Footprint

            15.1.10.5. Strategy Overview

                15.1.10.5.1. Marketing Strategy

                15.1.10.5.2. Product Strategy

                15.1.10.5.3. Channel Strategy

16. Assumptions & Acronyms Used

17. Research Methodology

Don't pay for what you don't need

Customize your report by selecting specific countries or regions and save 30%!

List of Tables

Table 1: Global Market Value (US$ Million) Forecast by Region, 2018 to 2033

Table 2: Global Market Volume (MT) Forecast by Region, 2018 to 2033

Table 3: Global Market Value (US$ Million) Forecast by Type, 2018 to 2033

Table 4: Global Market Volume (MT) Forecast by Type, 2018 to 2033

Table 5: Global Market Value (US$ Million) Forecast by End-Use, 2018 to 2033

Table 6: Global Market Volume (MT) Forecast by End-Use, 2018 to 2033

Table 7: North America Market Value (US$ Million) Forecast by Country, 2018 to 2033

Table 8: North America Market Volume (MT) Forecast by Country, 2018 to 2033

Table 9: North America Market Value (US$ Million) Forecast by Type, 2018 to 2033

Table 10: North America Market Volume (MT) Forecast by Type, 2018 to 2033

Table 11: North America Market Value (US$ Million) Forecast by End-Use, 2018 to 2033

Table 12: North America Market Volume (MT) Forecast by End-Use, 2018 to 2033

Table 13: Latin America Market Value (US$ Million) Forecast by Country, 2018 to 2033

Table 14: Latin America Market Volume (MT) Forecast by Country, 2018 to 2033

Table 15: Latin America Market Value (US$ Million) Forecast by Type, 2018 to 2033

Table 16: Latin America Market Volume (MT) Forecast by Type, 2018 to 2033

Table 17: Latin America Market Value (US$ Million) Forecast by End-Use, 2018 to 2033

Table 18: Latin America Market Volume (MT) Forecast by End-Use, 2018 to 2033

Table 19: Europe Market Value (US$ Million) Forecast by Country, 2018 to 2033

Table 20: Europe Market Volume (MT) Forecast by Country, 2018 to 2033

Table 21: Europe Market Value (US$ Million) Forecast by Type, 2018 to 2033

Table 22: Europe Market Volume (MT) Forecast by Type, 2018 to 2033

Table 23: Europe Market Value (US$ Million) Forecast by End-Use, 2018 to 2033

Table 24: Europe Market Volume (MT) Forecast by End-Use, 2018 to 2033

Table 25: Asia Pacific Market Value (US$ Million) Forecast by Country, 2018 to 2033

Table 26: Asia Pacific Market Volume (MT) Forecast by Country, 2018 to 2033

Table 27: Asia Pacific Market Value (US$ Million) Forecast by Type, 2018 to 2033

Table 28: Asia Pacific Market Volume (MT) Forecast by Type, 2018 to 2033

Table 29: Asia Pacific Market Value (US$ Million) Forecast by End-Use, 2018 to 2033

Table 30: Asia Pacific Market Volume (MT) Forecast by End-Use, 2018 to 2033

Table 31: MEA Market Value (US$ Million) Forecast by Country, 2018 to 2033

Table 32: MEA Market Volume (MT) Forecast by Country, 2018 to 2033

Table 33: MEA Market Value (US$ Million) Forecast by Type, 2018 to 2033

Table 34: MEA Market Volume (MT) Forecast by Type, 2018 to 2033

Table 35: MEA Market Value (US$ Million) Forecast by End-Use, 2018 to 2033

Table 36: MEA Market Volume (MT) Forecast by End-Use, 2018 to 2033
Nikhil Kaitwade
Nikhil Kaitwade

Principal Consultant

Talk to Analyst

Find your sweet spots for generating winning opportunities in this market.

List of Charts

Figure 1: Global Market Value (US$ Million) by Type, 2023 to 2033

Figure 2: Global Market Value (US$ Million) by End-Use, 2023 to 2033

Figure 3: Global Market Value (US$ Million) by Region, 2023 to 2033

Figure 4: Global Market Value (US$ Million) Analysis by Region, 2018 to 2033

Figure 5: Global Market Volume (MT) Analysis by Region, 2018 to 2033

Figure 6: Global Market Value Share (%) and BPS Analysis by Region, 2023 to 2033

Figure 7: Global Market Y-o-Y Growth (%) Projections by Region, 2023 to 2033

Figure 8: Global Market Value (US$ Million) Analysis by Type, 2018 to 2033

Figure 9: Global Market Volume (MT) Analysis by Type, 2018 to 2033

Figure 10: Global Market Value Share (%) and BPS Analysis by Type, 2023 to 2033

Figure 11: Global Market Y-o-Y Growth (%) Projections by Type, 2023 to 2033

Figure 12: Global Market Value (US$ Million) Analysis by End-Use, 2018 to 2033

Figure 13: Global Market Volume (MT) Analysis by End-Use, 2018 to 2033

Figure 14: Global Market Value Share (%) and BPS Analysis by End-Use, 2023 to 2033

Figure 15: Global Market Y-o-Y Growth (%) Projections by End-Use, 2023 to 2033

Figure 16: Global Market Attractiveness by Type, 2023 to 2033

Figure 17: Global Market Attractiveness by End-Use, 2023 to 2033

Figure 18: Global Market Attractiveness by Region, 2023 to 2033

Figure 19: North America Market Value (US$ Million) by Type, 2023 to 2033

Figure 20: North America Market Value (US$ Million) by End-Use, 2023 to 2033

Figure 21: North America Market Value (US$ Million) by Country, 2023 to 2033

Figure 22: North America Market Value (US$ Million) Analysis by Country, 2018 to 2033

Figure 23: North America Market Volume (MT) Analysis by Country, 2018 to 2033

Figure 24: North America Market Value Share (%) and BPS Analysis by Country, 2023 to 2033

Figure 25: North America Market Y-o-Y Growth (%) Projections by Country, 2023 to 2033

Figure 26: North America Market Value (US$ Million) Analysis by Type, 2018 to 2033

Figure 27: North America Market Volume (MT) Analysis by Type, 2018 to 2033

Figure 28: North America Market Value Share (%) and BPS Analysis by Type, 2023 to 2033

Figure 29: North America Market Y-o-Y Growth (%) Projections by Type, 2023 to 2033

Figure 30: North America Market Value (US$ Million) Analysis by End-Use, 2018 to 2033

Figure 31: North America Market Volume (MT) Analysis by End-Use, 2018 to 2033

Figure 32: North America Market Value Share (%) and BPS Analysis by End-Use, 2023 to 2033

Figure 33: North America Market Y-o-Y Growth (%) Projections by End-Use, 2023 to 2033

Figure 34: North America Market Attractiveness by Type, 2023 to 2033

Figure 35: North America Market Attractiveness by End-Use, 2023 to 2033

Figure 36: North America Market Attractiveness by Country, 2023 to 2033

Figure 37: Latin America Market Value (US$ Million) by Type, 2023 to 2033

Figure 38: Latin America Market Value (US$ Million) by End-Use, 2023 to 2033

Figure 39: Latin America Market Value (US$ Million) by Country, 2023 to 2033

Figure 40: Latin America Market Value (US$ Million) Analysis by Country, 2018 to 2033

Figure 41: Latin America Market Volume (MT) Analysis by Country, 2018 to 2033

Figure 42: Latin America Market Value Share (%) and BPS Analysis by Country, 2023 to 2033

Figure 43: Latin America Market Y-o-Y Growth (%) Projections by Country, 2023 to 2033

Figure 44: Latin America Market Value (US$ Million) Analysis by Type, 2018 to 2033

Figure 45: Latin America Market Volume (MT) Analysis by Type, 2018 to 2033

Figure 46: Latin America Market Value Share (%) and BPS Analysis by Type, 2023 to 2033

Figure 47: Latin America Market Y-o-Y Growth (%) Projections by Type, 2023 to 2033

Figure 48: Latin America Market Value (US$ Million) Analysis by End-Use, 2018 to 2033

Figure 49: Latin America Market Volume (MT) Analysis by End-Use, 2018 to 2033

Figure 50: Latin America Market Value Share (%) and BPS Analysis by End-Use, 2023 to 2033

Figure 51: Latin America Market Y-o-Y Growth (%) Projections by End-Use, 2023 to 2033

Figure 52: Latin America Market Attractiveness by Type, 2023 to 2033

Figure 53: Latin America Market Attractiveness by End-Use, 2023 to 2033

Figure 54: Latin America Market Attractiveness by Country, 2023 to 2033

Figure 55: Europe Market Value (US$ Million) by Type, 2023 to 2033

Figure 56: Europe Market Value (US$ Million) by End-Use, 2023 to 2033

Figure 57: Europe Market Value (US$ Million) by Country, 2023 to 2033

Figure 58: Europe Market Value (US$ Million) Analysis by Country, 2018 to 2033

Figure 59: Europe Market Volume (MT) Analysis by Country, 2018 to 2033

Figure 60: Europe Market Value Share (%) and BPS Analysis by Country, 2023 to 2033

Figure 61: Europe Market Y-o-Y Growth (%) Projections by Country, 2023 to 2033

Figure 62: Europe Market Value (US$ Million) Analysis by Type, 2018 to 2033

Figure 63: Europe Market Volume (MT) Analysis by Type, 2018 to 2033

Figure 64: Europe Market Value Share (%) and BPS Analysis by Type, 2023 to 2033

Figure 65: Europe Market Y-o-Y Growth (%) Projections by Type, 2023 to 2033

Figure 66: Europe Market Value (US$ Million) Analysis by End-Use, 2018 to 2033

Figure 67: Europe Market Volume (MT) Analysis by End-Use, 2018 to 2033

Figure 68: Europe Market Value Share (%) and BPS Analysis by End-Use, 2023 to 2033

Figure 69: Europe Market Y-o-Y Growth (%) Projections by End-Use, 2023 to 2033

Figure 70: Europe Market Attractiveness by Type, 2023 to 2033

Figure 71: Europe Market Attractiveness by End-Use, 2023 to 2033

Figure 72: Europe Market Attractiveness by Country, 2023 to 2033

Figure 73: Asia Pacific Market Value (US$ Million) by Type, 2023 to 2033

Figure 74: Asia Pacific Market Value (US$ Million) by End-Use, 2023 to 2033

Figure 75: Asia Pacific Market Value (US$ Million) by Country, 2023 to 2033

Figure 76: Asia Pacific Market Value (US$ Million) Analysis by Country, 2018 to 2033

Figure 77: Asia Pacific Market Volume (MT) Analysis by Country, 2018 to 2033

Figure 78: Asia Pacific Market Value Share (%) and BPS Analysis by Country, 2023 to 2033

Figure 79: Asia Pacific Market Y-o-Y Growth (%) Projections by Country, 2023 to 2033

Figure 80: Asia Pacific Market Value (US$ Million) Analysis by Type, 2018 to 2033

Figure 81: Asia Pacific Market Volume (MT) Analysis by Type, 2018 to 2033

Figure 82: Asia Pacific Market Value Share (%) and BPS Analysis by Type, 2023 to 2033

Figure 83: Asia Pacific Market Y-o-Y Growth (%) Projections by Type, 2023 to 2033

Figure 84: Asia Pacific Market Value (US$ Million) Analysis by End-Use, 2018 to 2033

Figure 85: Asia Pacific Market Volume (MT) Analysis by End-Use, 2018 to 2033

Figure 86: Asia Pacific Market Value Share (%) and BPS Analysis by End-Use, 2023 to 2033

Figure 87: Asia Pacific Market Y-o-Y Growth (%) Projections by End-Use, 2023 to 2033

Figure 88: Asia Pacific Market Attractiveness by Type, 2023 to 2033

Figure 89: Asia Pacific Market Attractiveness by End-Use, 2023 to 2033

Figure 90: Asia Pacific Market Attractiveness by Country, 2023 to 2033

Figure 91: MEA Market Value (US$ Million) by Type, 2023 to 2033

Figure 92: MEA Market Value (US$ Million) by End-Use, 2023 to 2033

Figure 93: MEA Market Value (US$ Million) by Country, 2023 to 2033

Figure 94: MEA Market Value (US$ Million) Analysis by Country, 2018 to 2033

Figure 95: MEA Market Volume (MT) Analysis by Country, 2018 to 2033

Figure 96: MEA Market Value Share (%) and BPS Analysis by Country, 2023 to 2033

Figure 97: MEA Market Y-o-Y Growth (%) Projections by Country, 2023 to 2033

Figure 98: MEA Market Value (US$ Million) Analysis by Type, 2018 to 2033

Figure 99: MEA Market Volume (MT) Analysis by Type, 2018 to 2033

Figure 100: MEA Market Value Share (%) and BPS Analysis by Type, 2023 to 2033

Figure 101: MEA Market Y-o-Y Growth (%) Projections by Type, 2023 to 2033

Figure 102: MEA Market Value (US$ Million) Analysis by End-Use, 2018 to 2033

Figure 103: MEA Market Volume (MT) Analysis by End-Use, 2018 to 2033

Figure 104: MEA Market Value Share (%) and BPS Analysis by End-Use, 2023 to 2033

Figure 105: MEA Market Y-o-Y Growth (%) Projections by End-Use, 2023 to 2033

Figure 106: MEA Market Attractiveness by Type, 2023 to 2033

Figure 107: MEA Market Attractiveness by End-Use, 2023 to 2033

Figure 108: MEA Market Attractiveness by Country, 2023 to 2033

Recommendations

Automotive

Automotive Wire & Cable Material Market

Published : January 2024

Explore Industrial Automation Insights

View Reports

Wire Compounds and Cable Compounds Market