Reports

- Global Locations -

Headquarters

Future Market Insights, Inc.

Christiana Corporate, 200
Continental Drive, Suite 401,
Newark, Delaware - 19713,
United States

T: +1-845-579-5705

Americas

Future Market Insights, Inc.

616 Corporate Way, Suite 2-9018,
Valley Cottage, NY 10989, United States

T: +1-347-918-3531

MEA

Future Market Insights

1602-6 Jumeirah Bay X2 Tower, Plot No: JLT-PH2-X2A,
Jumeirah Lakes Towers, Dubai,
United Arab Emirates

Europe

Future Market Insights

3rd Floor, 207 Regent Street,
W1B 3HH London
United Kingdom

T: + 44 (0) 20 8123 9659
D: +44 (0) 20 3287 4268

Asia Pacific

Future Market Insights

IndiaLand Global Tech Park, Unit UG-1, Behind Grand HighStreet, Phase 1, Hinjawadi, MH, Pune – 411057, India

Wire Harness Tape Market Outlook (2023 to 2033)

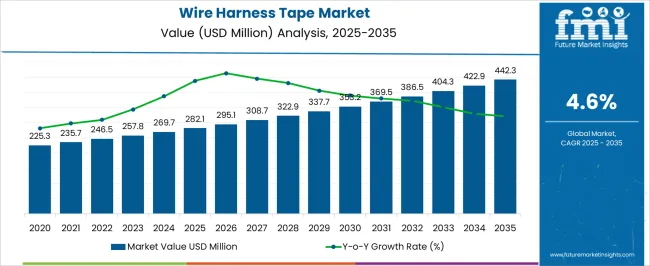
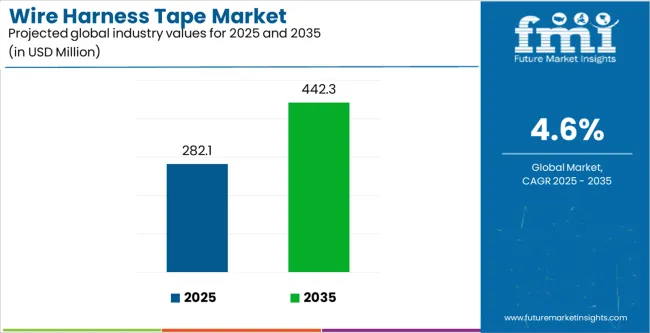
The global wire harness tape market is likely to be supplemented at US$ 249.1 Million in 2023. It is projected to further expand at a CAGR of 5.3% throughout the projection period from 2023 to 2033. The report mentions that the market is predicted to be valued at US$ 417.4 Million by the end of 2033. The top 5 manufacturers of wire harness tapes are anticipated to occupy around 20-25% of the global market in 2022.

According to the FMI analysis, the market for wire harness tapes reached US$ 237.2 Million in 2022. With the propelling demand from various industries, the global wire harness tape market is anticipated to create an incremental opportunity of US$ 180.2 Million from 2023 to 2033.

Significantly rising demand for electrical instruments has increased the demand for wire harness tapes. The market is expected to increase 1.8 times the current value during the forecast period on the back of the high demand for electric vehicles across the globe.

Increasing demand for vehicle electrification and raising awareness about the safety of vehicles are projected to drive the need for wire harness tapes in the next ten years. Owing to the rising shift of consumers towards lowering environmental pollution, electric vehicle makers have surged their production capacities in recent years.

As per the International Energy Agency (IEA), in 2021, global sales of electric vehicles doubled, as compared to the previous year to a new height of 6.6 million. Only 120,000 electric vehicles were sold across the globe back in 2012. More than that many were sold every week in 2021. It brought the total number of electric vehicles on the road to around 16.5 million.

The lightweight nature and cost-effectiveness of wire harness tapes are also anticipated to drive the market during the evaluation period. Many automakers are thus preferring these tapes for incorporation into their vehicles.

In December 2022, for instance, tesa, a leading manufacturer of adhesive tapes, launched its 51036 PV76 and PV78 wire harness sleeves under its SuperSleeveplus tape family. These new tapes are considered to be the first of their kind in the wire harness sector. These include a layer of fleece and cloth to bundle wires together in the vehicle’s body.

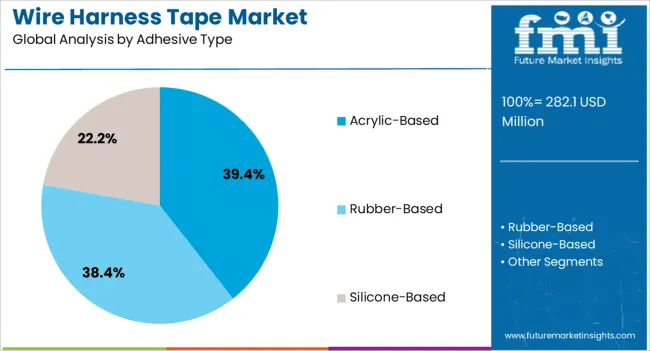
FMI states that rubber-based adhesives are expected to gain immense popularity in the field of wire harness tapes. These adhesives are estimated to surge by 1.6x the current market value during the projection period from 2023 to 2033.

Attributes Key Insights
Wire Harness Tape Market Estimated Size (2023E) US$ 249.1 Million
Projected Market Valuation (2033F) US$ 417.4 Million
Value-based CAGR (2023 to 2033) 5.3%
Collective Value Share: Top 3 Countries (2023E) 30-35%

Don't pay for what you don't need

Customize your report by selecting specific countries or regions and save 30%!

2018 to 2022 Global Wire Harness Tape Market Outlook Compared to 2023 to 2033 Demand Forecast

The global wire harness tape market witnessed a CAGR of 4.9% during the historical period and generated a market value of US$ 237.2 Million in 2022. Wire harness tape is a type of electrical tape used to bundle and protect wires and cables in automotive, aerospace, and other industrial applications.

It is specially designed to deliver a secure, waterproof seal that can withstand extreme temperatures and environmental conditions. This type of tape is typically made of polyester or polypropylene backing with a rubber-based or silicone-based or acrylic-based adhesive.

The ongoing expansion of the electrical industry is estimated to drive the demand for wire harness tapes in the evaluation period. The tape is extensively used in the electrical industry for a wide variety of applications, including insulation, abrasion resistance, and moisture resistance. Overall, the wire harness tape market is expected to grow at a fast pace during the forecast period.

Comparative Analysis of Adjacent Wire Harness Tape Markets

Wire Harness Tape Market:

Differentiating Aspects Wire Harness Tape Market
CAGR from 2023 to 2033 5.3%
Current Valuation in 2023 US$ 249.1 Million
Projected Valuation in 2033 US$ 417.4 Million
Demand Drivers
  • The growing use of wire harness tapes in the automotive industry for security labeling, the attachment part mounting, cable mounting, interior mounting, and hole covering would push growth.
  • Surging installation of integrated advanced features in automotive and rising production of cars would aid demand.

ID Card Printers Market:

Differentiating Aspects ID Card Printers Market
CAGR from 2023 to 2033 4.2%
Current Valuation in 2023 US$ 116.9 Million
Projected Valuation in 2033 US$ 176.4 Million
Demand Drivers
  • Increasing the use of ID card printers for the printing of membership cards, credit cards, and employee identification cards on plastic is likely to push sales.
  • Easy availability of various types of ID card printers such as standard card printers, single-sided printers, and high-performance printers would drive sales.

Kegs Market:

Differentiating Aspects Kegs Market
CAGR from 2023 to 2033 4.5%
Current Valuation in 2023 US$ 939 Million
Projected Valuation in 2033 US$ 1.5 Billion
Demand Drivers
  • High demand for single-use kegs as they are more cost-effective than conventional steel kegs would fuel demand.
  • The surging number of people consuming alcohol is expected to drive the need for alcoholic keg containers to preserve the property and flavor of the content.
Ismail Sutaria
Ismail Sutaria

Principal Consultant

Talk to Analyst

Find your sweet spots for generating winning opportunities in this market.

Top Trends Pushing Sales of Wire Harness Tapes across the Globe

  • Urgent Need for Electronic Devices to Boost Sales of Waterproof Wiring Loom Tapes

Demand for wire harness tapes is expected to be propelled by the urgent need for a reliable and secure connection between electrical components. Wire harness tapes can protect and insulate wires and cables from environmental elements such as moisture, dust, and vibration.

At the same time, they can help to reduce the risk of short circuits and other electrical hazards. Additionally, wire harness tapes are used to bundle and organize wires and cables, making them easier to install and maintain. Increasing demand for electronic devices and the need for reliable & secure connections are expected to drive the demand for wire harness tapes in the next ten years.

Country-wise Insights

How India as an Outperforming Telecom Sector is Helping Wire Harness Tape Companies to Expand?

Rapid Expansion of Submarine Communication Cables in India to Fuel Sales of Loom Harness Tapes

The market for wire harness tapes in India is projected to register a CAGR of 6.0% during the evaluation period. The Indian market is currently showcasing the high popularity of the product owing to the presence of various international manufacturers.

The country as a developing economy has the potential to serve the telecom industry with the best possible resources and a vast consumer base. Technological advancements in the country are at a peak level, which would open the path for the telecom industry to push its boundaries.

As per information derived from the National Maritime Foundation, the participation of Indian companies in the expansion of submarine communication cables is getting higher day by day. Most of the marine cables are being expanded across the ocean.

The data also states that 4 more additional cable expansions are planned in the country’s ocean range. Communication cables as one of the applicators of wire harness tapes are expanding in India, and probably create new opportunities for the wire harness tape industry to expand.

How China, the Biggest Silicon Producer, is Pushing Sales of Wire Harness Tapes?

Easy Availability of Adhesives in China to Help Expand Manufacturing Capacities of Wire Wrap Tapes

China is estimated to account for around 63% of the East Asia wire harness tape industry by the end of 2033, reports FMI. The country is considered to be the biggest manufacturer in almost every industry.

Relatively low cost of labor is helping the country to dominate the manufacturing sector. The country’s advancements in innovation and technology are also pushing it towards becoming the most preferred manufacturing hub in the world.

According to data put forward by the IEEE Computer Society, China is the leading producer of silicon in the world. Chinese skilled labor force is helping out the country to create a strong supply chain for the most precious materials in the world.

China’s dominance in silicon manufacturing would help the wire harness tapes sector to ease its production. Easy availability of the adhesive would strengthen the production capacity of wire harness tape manufacturers. Owing to the above-mentioned factors, the country is expected to push growth in the market for wire harness tapes.
Get the data you need at a Fraction of the cost

Personalize your report by choosing insights you need
and save 40%!

Category-wise Insights

Which is the Highly Preferred Material for Making Wire Harness Tapes?

Demand for Wiring Loom Tapes Made of Plastic to Surge with Requirement of Good Adhesion

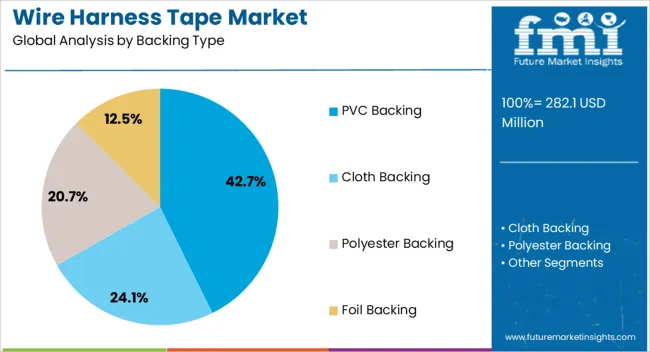
Based on material, the plastic segment is projected to generate the lion’s share of around 54% by the end of 2023. Plastic has several beneficial properties like high tensile strength, excellent electrical insulation, and good adhesion.

Plastic wire harness tapes are also lightweight, flexible, and resistant to abrasion, thus making them ideal for use in the automotive, aerospace, and other industries. Additionally, plastic wire harness tapes are available in a wide variety of colors, making them suitable for multiple applications. Thus, the plastic segment is projected to hold a major portion of the global wire harness tape industry.

Which is the Primary Application of Wire Harness Tapes across the Globe?

Need for Electrical Insulation Tapes to Grow among Power Cable Manufacturers by 2033

As per FMI analysis, based on application, power cables are expected to grow at a CAGR of 5.6% during the forecast period. Power cables are used in a variety of applications, including automotive and consumer electronics.

The use of power cables in these applications has been increasing due to the surging need for reliable and efficient power delivery. Power cables are used to connect components in a system such as a car to a power source.

Wire harness tape protects and insulates power cables from environmental elements such as moisture, dust, and heat. It also helps to reduce the risk of short circuits and other electrical hazards. Thus, the use of wire harness tapes in power cable applications is expected to increase in the assessment period, thereby providing a lucrative growth opportunity for the global wire harness tape industry.

Competitive Landscape

Major players in the wire harness tape industry are aiming to boost sales and revenues by enhancing capabilities to meet the increasing demand. In an effort to increase their resources, some of the key players are adopting the acquisition strategy. They are also introducing new products to meet the high consumer demand. Additionally, these players are concentrating on upgrading their facilities to expand their manufacturing capacities.

Some of the recent key developments by leading players are as follows -

  • In July 2022, NITTO DENKO CORPORATION completed the acquisition of Mondi’s personal care component business.
  • In November 2021, Yongle (AVERY DENNISON CORPORATION) launched new solutions for automotive and electrical applications.

Scope of the Report

Attribute Details
Estimated Market Size (2023) US$ 249.1 Million
Projected Market Valuation (2033) US$ 417.4 Million
Value-based CAGR (2023 to 2033) 5.3%
Historical Data 2018 to 2022
Forecast Period 2023 to 2033
Quantitative Tonnes Value (US$ Million)
Segments Covered
  • Material
  • Adhesive Type
  • Thickness
  • Application
  • Region
Regions Covered
  • North America
  • Latin America
  • Europe
  • East Asia
  • South Asia
  • Middle East and Africa
  • Oceania
Key Countries Covered
  • USA
  • Canada
  • Mexico
  • Brazil
  • Germany
  • UK
  • France
  • Italy
  • Spain
  • Russia
  • China
  • Japan
  • India
  • GCC Countries
  • Australia
Key Companies Profiled
  • 3M Company
  • NITTO DENKO CORPORATION
  • tesa SE
  • Yongle (AVERY DENNISON CORPORATION)
  • American Biltrite Inc.
  • Adhesive Specialities
  • Saint-Gobain S.A.
  • Scapa Company
  • Global Industries Corporation
  • Ajit Industries Pvt. Ltd.
  • Coroplast Tape Corporation
  • Bron Tapes, Inc.
  • Jacobs Industries
  • ACHEM
  • Shijiazhuang Liantu Import and Export Trading Co., Ltd
  • Pro Tapes LLC
Report Coverage Revenue Forecast, Volume Forecast, Company Ranking, Competitive Landscape, Growth Factors, Trends, and Pricing Analysis

Wire Harness Tape Market Outlook by Category

By Material:

  • Plastic
  • Rubber
  • Foam
  • Metal (Foil)

By Adhesive Type:

  • Acrylic-based
  • Rubber-based
  • Silicone-based

By Thickness:

  • Less than 0.2 mm
  • 0.2 - 0.3 mm
  • Above 0.3 mm

By Application:

  • Power Cables
  • Communication Cables
  • Industrial Cables

By Region:

  • North America
  • Latin America
  • Europe
  • South Asia
  • East Asia
  • Middle East & Africa
  • Oceania

Frequently Asked Questions

What was the value of the wire harness tape industry in 2022?

In 2022, the value of the global wire harness tape industry was US$ 237.2 Million.

At what rate is the global wire harness tape industry projected to expand during the forecast period?

During the forecast period, the global wire harness tape industry is anticipated to expand at a CAGR of 5.3%.

By 2033, what will be the value of the global wire harness tape industry?

The global wire harness tape industry is expected to reach US$ 417.4 Million by the end of 2033.

Which material segment is expected to lead the global wire harness tape industry during the forecast period?

During the forecast period, plastic material is likely to be the fastest-growing material segment in the global wire harness tape industry.

Which factors are likely to drive the demand for wire harness tapes?

Demand for wire harness tapes is set to be driven by the need for a reliable and secure connection between electrical components.

Who are the top players supplementing sales of wire harness tapes?

Tesa SE, Yongle (AVERY DENNISON CORPORATION), 3M Company, NITTO DENKO CORPORATION, Saint-Gobain S.A., and Scapa Company are the top players supplementing sales of wire harness tapes.

At what rate is the demand for wire harness tapes projected to grow in India?

As per the FMI analysis, demand for wire harness tapes is projected to expand at a CAGR of 6.0% from 2023 to 2033 in India.

Table of Content

1. Executive Summary | Wire Harness Tape Market

    1.1. Global Market Outlook

    1.2. Demand-side Trends

    1.3. Supply-side Trends

    1.4. Technology Roadmap Analysis

    1.5. Analysis and Recommendations

2. Market Overview

    2.1. Market Coverage / Taxonomy

    2.2. Market Definition / Scope / Limitations

3. Market Background

    3.1. Market Dynamics

        3.1.1. Drivers

        3.1.2. Restraints

        3.1.3. Opportunity

        3.1.4. Trends

    3.2. Impact of Covid-19

        3.2.1. Demand in Optimistic Scenario

        3.2.2. Demand in Likely Scenario

        3.2.3. Demand in Conservative Scenario

    3.3. Macro Factors and Forecast Factors

    3.4. Value Chain Analysis

        3.4.1. Profit Margin Analysis

        3.4.2. Suppliers

        3.4.3. Manufacturers, Wholesalers, and Distributors

        3.4.4. End-user/ Customers

    3.5. Regional Parent Market Outlook

    3.6. Production and Consumption Statistics

    3.7. Global Average Pricing Analysis Benchmark

4. Global Market Analysis 2018 to 2022 and Forecast, 2023 to 2033

    4.1. Historical Market Size Value (US$ Million) & Volume (Sq. Mt.) Analysis, 2018 to 2022

    4.2. Current and Future Market Size Value (US$ Million) & Volume (Sq. Mt.) Projections, 2023 to 2033

        4.2.1. Y-o-Y Growth Trend Analysis

        4.2.2. Absolute $ Opportunity Analysis

5. Global Market Analysis 2018 to 2022 and Forecast 2023 to 2033, By Material

    5.1. Introduction / Key Findings

    5.2. Historical Market Size Value (US$ Million) & Volume (Sq. Mt.) Analysis By Material, 2018 to 2022

    5.3. Current and Future Market Size Value (US$ Million) & Volume (Sq. Mt.) Analysis and Forecast By Material, 2023 to 2033

        5.3.1. Plastic

        5.3.2. Rubber

        5.3.3. Foam

        5.3.4. Metal (Foil)

    5.4. Y-o-Y Growth Trend Analysis By Material, 2018 to 2022

    5.5. Absolute $ Opportunity Analysis By Material, 2023 to 2033

6. Global Market Analysis 2018 to 2022 and Forecast 2023 to 2033, By Adhesive Type

    6.1. Introduction / Key Findings

    6.2. Historical Market Size Value (US$ Million) & Volume (Sq. Mt.) Analysis By Adhesive Type, 2018 to 2022

    6.3. Current and Future Market Size Value (US$ Million) & Volume (Sq. Mt.) Analysis and Forecast By Adhesive Type, 2023 to 2033

        6.3.1. Acrylic-based

        6.3.2. Rubber-based

        6.3.3. Silicone-based

    6.4. Y-o-Y Growth Trend Analysis By Adhesive Type, 2018 to 2022

    6.5. Absolute $ Opportunity Analysis By Adhesive Type, 2023 to 2033

7. Global Market Analysis 2018 to 2022 and Forecast 2023 to 2033, By Thickness

    7.1. Introduction / Key Findings

    7.2. Historical Market Size Value (US$ Million) & Volume (Sq. Mt.) Analysis By Thickness, 2018 to 2022

    7.3. Current and Future Market Size Value (US$ Million) & Volume (Sq. Mt.) Analysis and Forecast By Thickness, 2023 to 2033

        7.3.1. Less than 0.2 mm

        7.3.2. 0.2 - 0.3 mm

        7.3.3. Above 0.3 mm

    7.4. Y-o-Y Growth Trend Analysis By Thickness, 2018 to 2022

    7.5. Absolute $ Opportunity Analysis By Thickness, 2023 to 2033

8. Global Market Analysis 2018 to 2022 and Forecast 2023 to 2033, By Application

    8.1. Introduction / Key Findings

    8.2. Historical Market Size Value (US$ Million) & Volume (Sq. Mt.) Analysis By Application, 2018 to 2022

    8.3. Current and Future Market Size Value (US$ Million) & Volume (Sq. Mt.) Analysis and Forecast By Application, 2023 to 2033

        8.3.1. Power Cables

        8.3.2. Communication Cables

        8.3.3. Industrial Cables

    8.4. Y-o-Y Growth Trend Analysis By Application, 2018 to 2022

    8.5. Absolute $ Opportunity Analysis By Application, 2023 to 2033

9. Global Market Analysis 2018 to 2022 and Forecast 2023 to 2033, By Region

    9.1. Introduction / Key Findings

    9.2. Historical Market Size Value (US$ Million) & Volume (Sq. Mt.) Analysis By Region, 2018 to 2022

    9.3. Current and Future Market Size Value (US$ Million) & Volume (Sq. Mt.) Analysis and Forecast By Region, 2023 to 2033

        9.3.1. North America

        9.3.2. Latin America

        9.3.3. Europe

        9.3.4. East Asia

        9.3.5. South Asia

        9.3.6. Oceania

        9.3.7. Middle East and Africa (MEA)

    9.4. Market Attractiveness Analysis, by Region

10. North America Market Analysis 2018 to 2022 and Forecast 2023 to 2033, By Country

    10.1. Historical Market Size Value (US$ Million) & Volume (Sq. Mt.) Trend Analysis By Market Taxonomy, 2018 to 2022

    10.2. Market Size Value (US$ Million) & Volume (Sq. Mt.) Forecast By Market Taxonomy, 2023 to 2033

        10.2.1. By Country

            10.2.1.1. United States of America

            10.2.1.2. Canada

        10.2.2. By Material

        10.2.3. By Adhesive Type

        10.2.4. By Thickness

        10.2.5. By Application

    10.3. Market Attractiveness Analysis

        10.3.1. By Country

        10.3.2. By Material

        10.3.3. By Adhesive Type

        10.3.4. By Thickness

        10.3.5. By Application

    10.4. Key Takeaways

11. Latin America Market Analysis 2018 to 2022 and Forecast 2023 to 2033, By Country

    11.1. Historical Market Size Value (US$ Million) & Volume (Sq. Mt.) Trend Analysis By Market Taxonomy, 2018 to 2022

    11.2. Market Size Value (US$ Million) & Volume (Sq. Mt.) Forecast By Market Taxonomy, 2023 to 2033

        11.2.1. By Country

            11.2.1.1. Brazil

            11.2.1.2. Mexico

            11.2.1.3. Argentina

            11.2.1.4. Chile

            11.2.1.5. Peru

            11.2.1.6. Rest of Latin America

        11.2.2. By Material

        11.2.3. By Adhesive Type

        11.2.4. By Thickness

        11.2.5. By Application

    11.3. Market Attractiveness Analysis

        11.3.1. By Country

        11.3.2. By Material

        11.3.3. By Adhesive Type

        11.3.4. By Thickness

        11.3.5. By Application

    11.4. Key Takeaways

12. Europe Market Analysis 2018 to 2022 and Forecast 2023 to 2033, By Country

    12.1. Historical Market Size Value (US$ Million) & Volume (Sq. Mt.) Trend Analysis By Market Taxonomy, 2018 to 2022

    12.2. Market Size Value (US$ Million) & Volume (Sq. Mt.) Forecast By Market Taxonomy, 2023 to 2033

        12.2.1. By Country

            12.2.1.1. Germany

            12.2.1.2. Italy

            12.2.1.3. France

            12.2.1.4. United Kingdom

            12.2.1.5. Spain

            12.2.1.6. BENELUX

            12.2.1.7. Nordic

            12.2.1.8. Russia

            12.2.1.9. Poland

            12.2.1.10. Rest of Europe

        12.2.2. By Material

        12.2.3. By Adhesive Type

        12.2.4. By Thickness

        12.2.5. By Application

    12.3. Market Attractiveness Analysis

        12.3.1. By Country

        12.3.2. By Material

        12.3.3. By Adhesive Type

        12.3.4. By Thickness

        12.3.5. By Application

    12.4. Key Takeaways

13. East Asia Market Analysis 2018 to 2022 and Forecast 2023 to 2033, By Country

    13.1. Historical Market Size Value (US$ Million) & Volume (Sq. Mt.) Trend Analysis By Market Taxonomy, 2018 to 2022

    13.2. Market Size Value (US$ Million) & Volume (Sq. Mt.) Forecast By Market Taxonomy, 2023 to 2033

        13.2.1. By Country

            13.2.1.1. China

            13.2.1.2. Japan

            13.2.1.3. South Korea

        13.2.2. By Material

        13.2.3. By Adhesive Type

        13.2.4. By Thickness

        13.2.5. By Application

    13.3. Market Attractiveness Analysis

        13.3.1. By Country

        13.3.2. By Material

        13.3.3. By Adhesive Type

        13.3.4. By Thickness

        13.3.5. By Application

    13.4. Key Takeaways

14. South Asia Market Analysis 2018 to 2022 and Forecast 2023 to 2033, By Country

    14.1. Historical Market Size Value (US$ Million) & Volume (Sq. Mt.) Trend Analysis By Market Taxonomy, 2018 to 2022

    14.2. Market Size Value (US$ Million) & Volume (Sq. Mt.) Forecast By Market Taxonomy, 2023 to 2033

        14.2.1. By Country

            14.2.1.1. India

            14.2.1.2. Thailand

            14.2.1.3. Malaysia

            14.2.1.4. Indonesia

            14.2.1.5. Rest of South Asia

        14.2.2. By Material

        14.2.3. By Adhesive Type

        14.2.4. By Thickness

        14.2.5. By Application

    14.3. Market Attractiveness Analysis

        14.3.1. By Country

        14.3.2. By Material

        14.3.3. By Adhesive Type

        14.3.4. By Thickness

        14.3.5. By Application

    14.4. Key Takeaways

15. Oceania Market Analysis 2018 to 2022 and Forecast 2023 to 2033, By Country

    15.1. Historical Market Size Value (US$ Million) & Volume (Sq. Mt.) Trend Analysis By Market Taxonomy, 2018 to 2022

    15.2. Market Size Value (US$ Million) & Volume (Sq. Mt.) Forecast By Market Taxonomy, 2023 to 2033

        15.2.1. By Country

            15.2.1.1. Australia

            15.2.1.2. New Zealand

        15.2.2. By Material

        15.2.3. By Adhesive Type

        15.2.4. By Thickness

        15.2.5. By Application

    15.3. Market Attractiveness Analysis

        15.3.1. By Country

        15.3.2. By Material

        15.3.3. By Adhesive Type

        15.3.4. By Thickness

        15.3.5. By Application

    15.4. Key Takeaways

16. Middle East & Africa Market Analysis 2018 to 2022 and Forecast 2023 to 2033, By Country

    16.1. Historical Market Size Value (US$ Million) & Volume (Sq. Mt.) Trend Analysis By Market Taxonomy, 2018 to 2022

    16.2. Market Size Value (US$ Million) & Volume (Sq. Mt.) Forecast By Market Taxonomy, 2023 to 2033

        16.2.1. By Country

            16.2.1.1. GCC Countries

            16.2.1.2. Turkey

            16.2.1.3. Northern Africa

            16.2.1.4. South Africa

            16.2.1.5. Rest of MEA

        16.2.2. By Material

        16.2.3. By Adhesive Type

        16.2.4. By Thickness

        16.2.5. By Application

    16.3. Market Attractiveness Analysis

        16.3.1. By Country

        16.3.2. By Material

        16.3.3. By Adhesive Type

        16.3.4. By Thickness

        16.3.5. By Application

    16.4. Key Takeaways

17. Country-wise Market Analysis

    17.1. United States of America

        17.1.1. Market Share Analysis, 2023

        17.1.2. By Material

        17.1.3. By Adhesive Type

        17.1.4. By Thickness

        17.1.5. By Application

    17.2. Canada

        17.2.1. Market Share Analysis, 2023

        17.2.2. By Material

        17.2.3. By Adhesive Type

        17.2.4. By Thickness

        17.2.5. By Application

    17.3. Brazil

        17.3.1. Market Share Analysis, 2023

        17.3.2. By Material

        17.3.3. By Adhesive Type

        17.3.4. By Thickness

        17.3.5. By Application

    17.4. Mexico

        17.4.1. Market Share Analysis, 2023

        17.4.2. By Material

        17.4.3. By Adhesive Type

        17.4.4. By Thickness

        17.4.5. By Application

    17.5. Germany

        17.5.1. Market Share Analysis, 2023

        17.5.2. By Material

        17.5.3. By Product Type

        17.5.4. By End Use

    17.6. Italy

        17.6.1. Market Share Analysis, 2023

        17.6.2. By Material

        17.6.3. By Product Type

        17.6.4. By End Use

    17.7. France

        17.7.1. Market Share Analysis, 2023

        17.7.2. By Material

        17.7.3. By Adhesive Type

        17.7.4. By Thickness

        17.7.5. By Application

    17.8. Spain

        17.8.1. Market Share Analysis, 2023

        17.8.2. By Material

        17.8.3. By Adhesive Type

        17.8.4. By Thickness

        17.8.5. By Application

    17.9. United Kingdom

        17.9.1. Market Share Analysis, 2023

        17.9.2. By Material

        17.9.3. By Adhesive Type

        17.9.4. By Thickness

        17.9.5. By Application

    17.10. Russia

        17.10.1. Market Share Analysis, 2023

        17.10.2. By Material

        17.10.3. By Adhesive Type

        17.10.4. By Thickness

        17.10.5. By Application

    17.11. China

        17.11.1. Market Share Analysis, 2023

        17.11.2. By Material

        17.11.3. By Adhesive Type

        17.11.4. By Thickness

        17.11.5. By Application

    17.12. Japan

        17.12.1. Market Share Analysis, 2023

        17.12.2. By Material

        17.12.3. By Adhesive Type

        17.12.4. By Thickness

        17.12.5. By Application

    17.13. India

        17.13.1. Market Share Analysis, 2023

        17.13.2. By Material

        17.13.3. By Adhesive Type

        17.13.4. By Thickness

        17.13.5. By Application

    17.14. GCC Countries

        17.14.1. Market Share Analysis, 2023

        17.14.2. By Material

        17.14.3. By Adhesive Type

        17.14.4. By Thickness

        17.14.5. By Application

    17.15. Australia

        17.15.1. Market Share Analysis, 2023

        17.15.2. By Material

        17.15.3. By Adhesive Type

        17.15.4. By Thickness

        17.15.5. By Application

18. Market Structure Analysis

    18.1. Competition Dashboard

    18.2. Competition Benchmarking

    18.3. Market Share Analysis of Top Players

        18.3.1. By Region

        18.3.2. By Product Portfolio

19. Competition Analysis

    19.1. Competition Deep Dive

        19.1.1. 3M Company

            19.1.1.1. Overview

            19.1.1.2. Product Portfolio

            19.1.1.3. Profitability by Market Segments (Product/Channel/Region)

            19.1.1.4. Sales Footprint

            19.1.1.5. Strategy Overview

                19.1.1.5.1. Marketing Strategy

                19.1.1.5.2. Product Strategy

                19.1.1.5.3. Channel Strategy

        19.1.2. NITTO DENKO CORPORATION

            19.1.2.1. Overview

            19.1.2.2. Product Portfolio

            19.1.2.3. Profitability by Market Segments (Product/Channel/Region)

            19.1.2.4. Sales Footprint

            19.1.2.5. Strategy Overview

                19.1.2.5.1. Marketing Strategy

                19.1.2.5.2. Product Strategy

                19.1.2.5.3. Channel Strategy

        19.1.3. tesa SE

            19.1.3.1. Overview

            19.1.3.2. Product Portfolio

            19.1.3.3. Profitability by Market Segments (Product/Channel/Region)

            19.1.3.4. Sales Footprint

            19.1.3.5. Strategy Overview

                19.1.3.5.1. Marketing Strategy

                19.1.3.5.2. Product Strategy

                19.1.3.5.3. Channel Strategy

        19.1.4. Yongle (AVERY DENNISON CORPORATION)

            19.1.4.1. Overview

            19.1.4.2. Product Portfolio

            19.1.4.3. Profitability by Market Segments (Product/Channel/Region)

            19.1.4.4. Sales Footprint

            19.1.4.5. Strategy Overview

                19.1.4.5.1. Marketing Strategy

                19.1.4.5.2. Product Strategy

                19.1.4.5.3. Channel Strategy

        19.1.5. American Biltrite Inc.

            19.1.5.1. Overview

            19.1.5.2. Product Portfolio

            19.1.5.3. Profitability by Market Segments (Product/Channel/Region)

            19.1.5.4. Sales Footprint

            19.1.5.5. Strategy Overview

                19.1.5.5.1. Marketing Strategy

                19.1.5.5.2. Product Strategy

                19.1.5.5.3. Channel Strategy

        19.1.6. Adhesive Specialities

            19.1.6.1. Overview

            19.1.6.2. Product Portfolio

            19.1.6.3. Profitability by Market Segments (Product/Channel/Region)

            19.1.6.4. Sales Footprint

            19.1.6.5. Strategy Overview

                19.1.6.5.1. Marketing Strategy

                19.1.6.5.2. Product Strategy

                19.1.6.5.3. Channel Strategy

        19.1.7. Saint-Gobain S.A.

            19.1.7.1. Overview

            19.1.7.2. Product Portfolio

            19.1.7.3. Profitability by Market Segments (Product/Channel/Region)

            19.1.7.4. Sales Footprint

            19.1.7.5. Strategy Overview

                19.1.7.5.1. Marketing Strategy

                19.1.7.5.2. Product Strategy

                19.1.7.5.3. Channel Strategy

        19.1.8. Scapa Company

            19.1.8.1. Overview

            19.1.8.2. Product Portfolio

            19.1.8.3. Profitability by Market Segments (Product/Channel/Region)

            19.1.8.4. Sales Footprint

            19.1.8.5. Strategy Overview

                19.1.8.5.1. Marketing Strategy

                19.1.8.5.2. Product Strategy

                19.1.8.5.3. Channel Strategy

        19.1.9. Global Industries Corporation

            19.1.9.1. Overview

            19.1.9.2. Product Portfolio

            19.1.9.3. Profitability by Market Segments (Product/Channel/Region)

            19.1.9.4. Sales Footprint

            19.1.9.5. Strategy Overview

                19.1.9.5.1. Marketing Strategy

                19.1.9.5.2. Product Strategy

                19.1.9.5.3. Channel Strategy

        19.1.10. Ajit Industries Pvt. Ltd.

            19.1.10.1. Overview

            19.1.10.2. Product Portfolio

            19.1.10.3. Profitability by Market Segments (Product/Channel/Region)

            19.1.10.4. Sales Footprint

            19.1.10.5. Strategy Overview

                19.1.10.5.1. Marketing Strategy

                19.1.10.5.2. Product Strategy

                19.1.10.5.3. Channel Strategy

        19.1.11. Coroplast Tape Corporation

            19.1.11.1. Overview

            19.1.11.2. Product Portfolio

            19.1.11.3. Profitability by Market Segments (Product/Channel/Region)

            19.1.11.4. Sales Footprint

            19.1.11.5. Strategy Overview

                19.1.11.5.1. Marketing Strategy

                19.1.11.5.2. Product Strategy

                19.1.11.5.3. Channel Strategy

        19.1.12. Bron Tapes, Inc.

            19.1.12.1. Overview

            19.1.12.2. Product Portfolio

            19.1.12.3. Profitability by Market Segments (Product/Channel/Region)

            19.1.12.4. Sales Footprint

            19.1.12.5. Strategy Overview

                19.1.12.5.1. Marketing Strategy

                19.1.12.5.2. Product Strategy

                19.1.12.5.3. Channel Strategy

        19.1.13. Jacobs Industries

            19.1.13.1. Overview

            19.1.13.2. Product Portfolio

            19.1.13.3. Profitability by Market Segments (Product/Channel/Region)

            19.1.13.4. Sales Footprint

            19.1.13.5. Strategy Overview

                19.1.13.5.1. Marketing Strategy

                19.1.13.5.2. Product Strategy

                19.1.13.5.3. Channel Strategy

        19.1.14. ACHEM

            19.1.14.1. Overview

            19.1.14.2. Product Portfolio

            19.1.14.3. Profitability by Market Segments (Product/Channel/Region)

            19.1.14.4. Sales Footprint

            19.1.14.5. Strategy Overview

                19.1.14.5.1. Marketing Strategy

                19.1.14.5.2. Product Strategy

                19.1.14.5.3. Channel Strategy

        19.1.15. Shijiazhuang Liantu Import and Export Trading Co., Ltd

            19.1.15.1. Overview

            19.1.15.2. Product Portfolio

            19.1.15.3. Profitability by Market Segments (Product/Channel/Region)

            19.1.15.4. Sales Footprint

            19.1.15.5. Strategy Overview

                19.1.15.5.1. Marketing Strategy

                19.1.15.5.2. Product Strategy

                19.1.15.5.3. Channel Strategy

        19.1.16. Pro Tapes LLC

            19.1.16.1. Overview

            19.1.16.2. Product Portfolio

            19.1.16.3. Profitability by Market Segments (Product/Channel/Region)

            19.1.16.4. Sales Footprint

            19.1.16.5. Strategy Overview

                19.1.16.5.1. Marketing Strategy

                19.1.16.5.2. Product Strategy

                19.1.16.5.3. Channel Strategy

20. Assumptions and Acronyms Used

21. Research Methodology

Don't pay for what you don't need

Customize your report by selecting specific countries or regions and save 30%!

List of Tables

Table 01: Global Market Value (US$ Million) Forecast, By Region, 2018 to 2033

Table 02: Global Market Volume (Sq. Mt.) Forecast, By Region, 2018 to 2033

Table 03: Global Market Value (US$ Million) Forecast, By Material, 2018 to 2033

Table 04: Global Market Volume (Sq. Mt.) Forecast, By Material, 2018 to 2033

Table 05: Global Market Value (US$ Million) Forecast, By Adhesive Type, 2018 to 2033

Table 06: Global Market Volume (Sq. Mt.) Forecast, By Adhesive Type, 2018 to 2033

Table 07: Global Market Value (US$ Million) Forecast, By Thickness, 2018 to 2033

Table 08: Global Market Volume (Sq. Mt.) Forecast, By Thickness, 2018 to 2033

Table 09: Global Market Value (US$ Million) Forecast, By Application, 2018 to 2033

Table 10: Global Market Volume (Sq. Mt.) Forecast, By Application, 2018 to 2033

Table 11: North America Market Value (US$ Million) Forecast, By Country, 2018 to 2033

Table 12: North America Market Volume (Sq. Mt.) Forecast, By Country, 2018 to 2033

Table 13: North America Market Value (US$ Million) Forecast, By Material, 2018 to 2033

Table 14: North America Market Volume (Sq. Mt.) Forecast, By Material, 2018 to 2033

Table 15: North America Market Value (US$ Million) Forecast, By Adhesive Type, 2018 to 2033

Table 16: North America Market Volume (Sq. Mt.) Forecast, By Adhesive Type, 2018 to 2033

Table 17: North America Market Value (US$ Million) Forecast, By Thickness, 2018 to 2033

Table 18: North America Market Volume (Sq. Mt.) Forecast, By Thickness, 2018 to 2033

Table 19: North America Market Value (US$ Million) Forecast, By Application, 2018 to 2033

Table 20: North America Market Volume (Sq. Mt.) Forecast, By Application, 2018 to 2033

Table 21: Latin America Market Value (US$ Million) Forecast, By Country, 2018 to 2033

Table 22: Latin America Market Volume (Sq. Mt.) Forecast, By Country, 2018 to 2033

Table 23: Latin America Market Value (US$ Million) Forecast, By Material, 2018 to 2033

Table 24: Latin America Market Volume (Sq. Mt.) Forecast, By Material, 2018 to 2033

Table 25: Latin America Market Value (US$ Million) Forecast, By Adhesive Type, 2018 to 2033

Table 26: Latin America Market Volume (Sq. Mt.) Forecast, By Adhesive Type, 2018 to 2033

Table 27: Latin America Market Value (US$ Million) Forecast, By Thickness, 2018 to 2033

Table 28: Latin America Market Volume (Sq. Mt.) Forecast, By Thickness, 2018 to 2033

Table 29: Latin America Market Value (US$ Million) Forecast, By Application, 2018 to 2033

Table 30: Latin America Market Volume (Sq. Mt.) Forecast, By Application, 2018 to 2033

Table 31: Europe Market Value (US$ Million) Forecast, By Country, 2018 to 2033

Table 32: Europe Market Volume (Sq. Mt.) Forecast, By Country, 2018 to 2033

Table 33: Europe Market Value (US$ Million) Forecast, By Material, 2018 to 2033

Table 34: Europe Market Volume (Sq. Mt.) Forecast, By Material, 2018 to 2033

Table 35: Europe Market Value (US$ Million) Forecast, By Adhesive Type, 2018 to 2033

Table 36: Europe Market Volume (Sq. Mt.) Forecast, By Adhesive Type, 2018 to 2033

Table 37: Europe Market Value (US$ Million) Forecast, By Thickness, 2018 to 2033

Table 38: Europe Market Volume (Sq. Mt.) Forecast, By Thickness, 2018 to 2033

Table 39: Europe Market Value (US$ Million) Forecast, By Application, 2018 to 2033

Table 40: Europe Market Volume (Sq. Mt.) Forecast, By Application, 2018 to 2033

Table 41: South Asia Market Value (US$ Million) Forecast, By Country, 2018 to 2033

Table 42: South Asia Market Volume (Sq. Mt.) Forecast, By Country, 2018 to 2033

Table 43: South Asia Market Value (US$ Million) Forecast, By Material, 2018 to 2033

Table 44: South Asia Market Volume (Sq. Mt.) Forecast, By Material, 2018 to 2033

Table 45: South Asia Market Value (US$ Million) Forecast, By Adhesive Type, 2018 to 2033

Table 46: South Asia Market Volume (Sq. Mt.) Forecast, By Adhesive Type, 2018 to 2033

Table 47: South Asia Market Value (US$ Million) Forecast, By Thickness, 2018 to 2033

Table 48: South Asia Market Volume (Sq. Mt.) Forecast, By Thickness, 2018 to 2033

Table 49: South Asia Market Value (US$ Million) Forecast, By Application, 2018 to 2033

Table 50: South Asia Market Volume (Sq. Mt.) Forecast, By Application, 2018 to 2033

Table 51: East Asia Market Value (US$ Million) Forecast, By Country, 2018 to 2033

Table 52: East Asia Market Volume (Sq. Mt.) Forecast, By Country, 2018 to 2033

Table 53: East Asia Market Value (US$ Million) Forecast, By Material, 2018 to 2033

Table 54: East Asia Market Volume (Sq. Mt.) Forecast, By Material, 2018 to 2033

Table 55: East Asia Market Value (US$ Million) Forecast, By Adhesive Type, 2018 to 2033

Table 56: East Asia Market Volume (Sq. Mt.) Forecast, By Adhesive Type, 2018 to 2033

Table 57: East Asia Market Value (US$ Million) Forecast, By Thickness, 2018 to 2033

Table 58: East Asia Market Volume (Sq. Mt.) Forecast, By Thickness, 2018 to 2033

Table 59: East Asia Market Value (US$ Million) Forecast, By Application, 2018 to 2033

Table 60: East Asia Market Volume (Sq. Mt.) Forecast, By Application, 2018 to 2033

Table 61: Oceania Market Value (US$ Million) Forecast, By Material, 2018 to 2033

Table 62: Oceania Market Volume (Sq. Mt.) Forecast, By Material, 2018 to 2033

Table 63 Oceania Market Value (US$ Million) Forecast, By Adhesive Type, 2018 to 2033

Table 64: Oceania Market Volume (Sq. Mt.) Forecast, By Adhesive Type, 2018 to 2033

Table 65: Oceania Market Value (US$ Million) Forecast, By Thickness, 2018 to 2033

Table 66: Oceania Market Volume (Sq. Mt.) Forecast, By Thickness, 2018 to 2033

Table 67: Oceania Market Value (US$ Million) Forecast, By Application, 2018 to 2033

Table 68: Oceania Market Volume (Sq. Mt.) Forecast, By Application, 2018 to 2033

Table 69: MEA Market Value (US$ Million) Forecast, By Country, 2018 to 2033

Table 70: MEA Market Volume (Sq. Mt.) Forecast, By Country, 2018 to 2033

Table 71: MEA Market Value (US$ Million) Forecast, By Material, 2018 to 2033

Table 72: MEA Market Volume (Sq. Mt.) Forecast, By Material, 2018 to 2033

Table 73: MEA Market Value (US$ Million) Forecast, By Adhesive Type, 2018 to 2033

Table 74: MEA Market Volume (Sq. Mt.) Forecast, By Adhesive Type, 2018 to 2033

Table 75: MEA Market Value (US$ Million) Forecast, By Thickness, 2018 to 2033

Table 76: MEA Market Volume (Sq. Mt.) Forecast, By Thickness, 2018 to 2033

Table 77: MEA Market Value (US$ Million) Forecast, By Application, 2018 to 2033

Table 78: MEA Market Volume (Sq. Mt.) Forecast, By Application, 2018 to 2033

Table 79: USA Market Value (US$ Million) Forecast, By Material, Adhesive Type, Thickness, and Application (2023(E) & 2033(F))

Table 80: Canada Market Value (US$ Million) Forecast, By Material, Adhesive Type, Thickness, and Application (2023(E) & 2033(F))

Table 81: Brazil Market Value (US$ Million) Forecast, By Material, Adhesive Type, Thickness, and Application (2023(E) & 2033(F))

Table 82: Mexico Market Value (US$ Million) Forecast, By Material, Adhesive Type, Thickness, and Application (2023(E) & 2033(F))

Table 83: Germany Market Value (US$ Million) Forecast, By Material, Adhesive Type, Thickness, and Application (2023(E) & 2033(F))

Table 84: Italy Market Value (US$ Million) Forecast, By Material, Adhesive Type, Thickness, and Application (2023(E) & 2033(F))

Table 85: France Market Value (US$ Million) Forecast, By Material, Adhesive Type, Thickness, and Application (2023(E) & 2033(F))

Table 86: Spain Market Value (US$ Million) Forecast, By Material, Adhesive Type, Thickness, and Application (2023(E) & 2033(F))

Table 87: UK Market Value (US$ Million) Forecast, By Material, Adhesive Type, Thickness, and Application (2023(E) & 2033(F))

Table 88: Russia Market Value (US$ Million) Forecast, By Material, Adhesive Type, Thickness, and Application (2023(E) & 2033(F))

Table 89: China Market Value (US$ Million) Forecast, By Material, Adhesive Type, Thickness, and Application (2023(E) & 2033(F))

Table 90: Japan Market Value (US$ Million) Forecast, By Material, Adhesive Type, Thickness, and Application (2023(E) & 2033(F))

Table 91: India Market Value (US$ Million) Forecast, By Material, Adhesive Type, Thickness, and Application (2023(E) & 2033(F))

Table 92: GCC Countries Market Value (US$ Million) Forecast, By Material, Adhesive Type, Thickness, and Application (2023(E) & 2033(F))

Table 93: Australia Market Value (US$ Million) Forecast, By Material, Adhesive Type, Thickness, and Application (2023(E) & 2033(F))
Ismail Sutaria
Ismail Sutaria

Principal Consultant

Talk to Analyst

Find your sweet spots for generating winning opportunities in this market.

List of Charts

Figure 01: Global Market Value (US$ Million) by Material, 2023 to 2033

Figure 02: Global Market Value (US$ Million) by Adhesive Type, 2023 to 2033

Figure 03: Global Market Value (US$ Million) by Thickness, 2023 to 2033

Figure 04: Global Market Value (US$ Million) by Application, 2023 to 2033

Figure 05: Global Market Value (US$ Million) by Region, 2023 to 2033

Figure 06: Global Market Value (US$ Million) Analysis, By Region, 2018 to 2022

Figure 07: Global Market Volume (Sq. Mt.) Analysis, By Region, 2018 to 2033

Figure 08: Global Market Value Share (%) and BPS Analysis, By Region, 2023 to 2033

Figure 09: Global Market Y-o-Y Growth (%) Projections by Region, 2023 to 2033

Figure 10: Global Market Value (US$ Million) Analysis, By Material, 2018 to 2022

Figure 11: Global Market Volume (Sq. Mt.) Analysis, By Material, 2018 to 2033

Figure 12: Global Market Value Share (%) and BPS Analysis, By Material, 2023 to 2033

Figure 13: Global Market Y-o-Y Growth (%) Projections by Material, 2023 to 2033

Figure 14: Global Market Value (US$ Million) Analysis, By Adhesive Type, 2018 to 2022

Figure 15: Global Market Volume (Sq. Mt.) Analysis, By Adhesive Type, 2018 to 2033

Figure 16: Global Market Value Share (%) and BPS Analysis, By Adhesive Type, 2023 to 2033

Figure 17: Global Market Y-o-Y Growth (%) Projections by Adhesive Type, 2023 to 2033

Figure 18: Global Market Value (US$ Million) Analysis, By Thickness, 2018 to 2022

Figure 19: Global Market Volume (Sq. Mt.) Analysis, By Thickness, 2018 to 2033

Figure 20: Global Market Value Share (%) and BPS Analysis, By Thickness, 2023 to 2033

Figure 21: Global Market Y-o-Y Growth (%) Projections by Thickness, 2023 to 2033

Figure 22: Global Market Value (US$ Million) Analysis, By Application, 2018 to 2022

Figure 23: Global Market Volume (Sq. Mt.) Analysis, By Application, 2018 to 2033

Figure 24: Global Market Value Share (%) and BPS Analysis, By Application, 2023 to 2033

Figure 25: Global Market Y-o-Y Growth (%) Projections by Application, 2023 to 2033

Figure 26: Global Market Attractiveness by Material, 2023 to 2033

Figure 27: Global Market Attractiveness by Adhesive Type, 2023 to 2033

Figure 28: Global Market Attractiveness by Thickness, 2023 to 2033

Figure 29: Global Market Attractiveness by Application, 2023 to 2033

Figure 30: Global Market Attractiveness by Application, 2023 to 2033

Figure 31: Global Market Attractiveness by Region, 2023 to 2033

Figure 32: North America Market Value (US$ Million) by Material, 2023 to 2033

Figure 33: North America Market Value (US$ Million) by Adhesive Type, 2023 to 2033

Figure 34: North America Market Value (US$ Million) by Thickness, 2023 to 2033

Figure 35: North America Market Value (US$ Million) by Application, 2023 to 2033

Figure 36: North America Market Value (US$ Million) by Country, 2023 to 2033

Figure 37: North America Market Value (US$ Million) Analysis, By Country, 2018 to 2022

Figure 38: North America Market Volume (Sq. Mt.) Analysis, By Country, 2018 to 2033

Figure 39: North America Market Value Share (%) and BPS Analysis, By Country, 2023 to 2033

Figure 40: North America Market Y-o-Y Growth (%) Projections by Country, 2023 to 2033

Figure 41: North America Market Value (US$ Million) Analysis, By Material, 2018 to 2022

Figure 42: North America Market Volume (Sq. Mt.) Analysis, By Material, 2018 to 2033

Figure 43: North America Market Value Share (%) and BPS Analysis, By Material, 2023 to 2033

Figure 44: North America Market Y-o-Y Growth (%) Projections by Material, 2023 to 2033

Figure 45: North America Market Value (US$ Million) Analysis, By Adhesive Type, 2018 to 2022

Figure 46: North America Market Volume (Sq. Mt.) Analysis, By Adhesive Type, 2018 to 2033

Figure 47: North America Market Value Share (%) and BPS Analysis, By Adhesive Type, 2023 to 2033

Figure 48: North America Market Y-o-Y Growth (%) Projections by Adhesive Type, 2023 to 2033

Figure 49: North America Market Value (US$ Million) Analysis, By Thickness, 2018 to 2022

Figure 50: North America Market Volume (Sq. Mt.) Analysis, By Thickness, 2018 to 2033

Figure 51: North America Market Value Share (%) and BPS Analysis, By Thickness, 2023 to 2033

Figure 52: North America Market Y-o-Y Growth (%) Projections by Thickness, 2023 to 2033

Figure 53: North America Market Value (US$ Million) Analysis, By Application, 2018 to 2022

Figure 54: North America Market Volume (Sq. Mt.) Analysis, By Application, 2018 to 2033

Figure 55: North America Market Value Share (%) and BPS Analysis, By Application, 2023 to 2033

Figure 56: North America Market Y-o-Y Growth (%) Projections by Application, 2023 to 2033

Figure 57: North America Market Attractiveness by Material, 2023 to 2033

Figure 58: North America Market Attractiveness by Adhesive Type, 2023 to 2033

Figure 59: North America Market Attractiveness by Thickness, 2023 to 2033

Figure 60: North America Market Attractiveness by Application, 2023 to 2033

Figure 61: North America Market Attractiveness by Country, 2023 to 2033

Figure 62: Latin America Market Value (US$ Million) by Material, 2023 to 2033

Figure 63: Latin America Market Value (US$ Million) by Adhesive Type, 2023 to 2033

Figure 64: Latin America Market Value (US$ Million) by Thickness, 2023 to 2033

Figure 65: Latin America Market Value (US$ Million) by Application, 2023 to 2033

Figure 66: Latin America Market Value (US$ Million) by Country, 2023 to 2033

Figure 67: Latin America Market Value (US$ Million) Analysis, By Country, 2018 to 2022

Figure 68: Latin America Market Volume (Sq. Mt.) Analysis, By Country, 2018 to 2033

Figure 69: Latin America Market Value Share (%) and BPS Analysis, By Country, 2023 to 2033

Figure 70: Latin America Market Y-o-Y Growth (%) Projections by Country, 2023 to 2033

Figure 71: Latin America Market Value (US$ Million) Analysis, By Material, 2018 to 2022

Figure 72: Latin America Market Volume (Sq. Mt.) Analysis, By Material, 2018 to 2033

Figure 73: Latin America Market Value Share (%) and BPS Analysis, By Material, 2023 to 2033

Figure 74: Latin America Market Y-o-Y Growth (%) Projections by Material, 2023 to 2033

Figure 75: Latin America Market Value (US$ Million) Analysis, By Adhesive Type, 2018 to 2022

Figure 76: Latin America Market Volume (Sq. Mt.) Analysis, By Adhesive Type, 2018 to 2033

Figure 77: Latin America Market Value Share (%) and BPS Analysis, By Adhesive Type, 2023 to 2033

Figure 78: Latin America Market Y-o-Y Growth (%) Projections by Adhesive Type, 2023 to 2033

Figure 79: Latin America Market Value (US$ Million) Analysis, By Thickness, 2018 to 2022

Figure 80: Latin America Market Volume (Sq. Mt.) Analysis, By Thickness, 2018 to 2033

Figure 81: Latin America Market Value Share (%) and BPS Analysis, By Thickness, 2023 to 2033

Figure 82: Latin America Market Y-o-Y Growth (%) Projections by Thickness, 2023 to 2033

Figure 83: Latin America Market Value (US$ Million) Analysis, By Application, 2018 to 2022

Figure 84: Latin America Market Volume (Sq. Mt.) Analysis, By Application, 2018 to 2033

Figure 85: Latin America Market Value Share (%) and BPS Analysis, By Application, 2023 to 2033

Figure 86: Latin America Market Y-o-Y Growth (%) Projections by Application, 2023 to 2033

Figure 87: Latin America Market Attractiveness by Material, 2023 to 2033

Figure 88: Latin America Market Attractiveness by Adhesive Type, 2023 to 2033

Figure 89: Latin America Market Attractiveness by Thickness, 2023 to 2033

Figure 90: Latin America Market Attractiveness by Application, 2023 to 2033

Figure 91: Latin America Market Attractiveness by Country, 2023 to 2033

Figure 92: Europe Market Value (US$ Million) by Material, 2023 to 2033

Figure 93: Europe Market Value (US$ Million) by Adhesive Type, 2023 to 2033

Figure 94: Europe Market Value (US$ Million) by Thickness, 2023 to 2033

Figure 95: Europe Market Value (US$ Million) by Application, 2023 to 2033

Figure 96: Europe Market Value (US$ Million) by Country, 2023 to 2033

Figure 97: Europe Market Value (US$ Million) Analysis, By Country, 2018 to 2022

Figure 98: Europe Market Volume (Sq. Mt.) Analysis, By Country, 2018 to 2033

Figure 99: Europe Market Value Share (%) and BPS Analysis, By Country, 2023 to 2033

Figure 100: Europe Market Y-o-Y Growth (%) Projections by Country, 2023 to 2033

Figure 101: Europe Market Value (US$ Million) Analysis, By Material, 2018 to 2022

Figure 102: Europe Market Volume (Sq. Mt.) Analysis, By Material, 2018 to 2033

Figure 103: Europe Market Value Share (%) and BPS Analysis, By Material, 2023 to 2033

Figure 104: Europe Market Y-o-Y Growth (%) Projections by Material, 2023 to 2033

Figure 105: Europe Market Value (US$ Million) Analysis, By Adhesive Type, 2018 to 2022

Figure 106: Europe Market Volume (Sq. Mt.) Analysis, By Adhesive Type, 2018 to 2033

Figure 107: Europe Market Value Share (%) and BPS Analysis, By Adhesive Type, 2023 to 2033

Figure 108: Europe Market Y-o-Y Growth (%) Projections by Adhesive Type, 2023 to 2033

Figure 109: Europe Market Value (US$ Million) Analysis, By Thickness, 2018 to 2022

Figure 110: Europe Market Volume (Sq. Mt.) Analysis, By Thickness, 2018 to 2033

Figure 111: Europe Market Value Share (%) and BPS Analysis, By Thickness, 2023 to 2033

Figure 112: Europe Market Y-o-Y Growth (%) Projections by Thickness, 2023 to 2033

Figure 113: Europe Market Value (US$ Million) Analysis, By Application, 2018 to 2022

Figure 114: Europe Market Volume (Sq. Mt.) Analysis, By Application, 2018 to 2033

Figure 115: Europe Market Value Share (%) and BPS Analysis, By Application, 2023 to 2033

Figure 116: Europe Market Y-o-Y Growth (%) Projections by Application, 2023 to 2033

Figure 117: Europe Market Attractiveness by Material, 2023 to 2033

Figure 118: Europe Market Attractiveness by Adhesive Type, 2023 to 2033

Figure 119: Europe Market Attractiveness by Thickness, 2023 to 2033

Figure 120: Europe Market Attractiveness by Application, 2023 to 2033

Figure 121: Europe Market Attractiveness by Country, 2023 to 2033

Figure 122: South Asia Market Value (US$ Million) by Material, 2023 to 2033

Figure 123: South Asia Market Value (US$ Million) by Adhesive Type, 2023 to 2033

Figure 124: South Asia Market Value (US$ Million) by Thickness, 2023 to 2033

Figure 125: South Asia Market Value (US$ Million) by Application, 2023 to 2033

Figure 126: South Asia Market Value (US$ Million) by Country, 2023 to 2033

Figure 127: South Asia Market Value (US$ Million) Analysis, By Country, 2018 to 2022

Figure 128: South Asia Market Volume (Sq. Mt.) Analysis, By Country, 2018 to 2033

Figure 129: South Asia Market Value Share (%) and BPS Analysis, By Country, 2023 to 2033

Figure 130: South Asia Market Y-o-Y Growth (%) Projections by Country, 2023 to 2033

Figure 131: South Asia Market Value (US$ Million) Analysis, By Material, 2018 to 2022

Figure 132: South Asia Market Volume (Sq. Mt.) Analysis, By Material, 2018 to 2033

Figure 133: South Asia Market Value Share (%) and BPS Analysis, By Material, 2023 to 2033

Figure 134: South Asia Market Y-o-Y Growth (%) Projections by Material, 2023 to 2033

Figure 135: South Asia Market Value (US$ Million) Analysis, By Adhesive Type, 2018 to 2022

Figure 136: South Asia Market Volume (Sq. Mt.) Analysis, By Adhesive Type, 2018 to 2033

Figure 137: South Asia Market Value Share (%) and BPS Analysis, By Adhesive Type, 2023 to 2033

Figure 138: South Asia Market Y-o-Y Growth (%) Projections by Adhesive Type, 2023 to 2033

Figure 139: South Asia Market Value (US$ Million) Analysis, By Thickness, 2018 to 2022

Figure 140: South Asia Market Volume (Sq. Mt.) Analysis, By Thickness, 2018 to 2033

Figure 141: South Asia Market Value Share (%) and BPS Analysis, By Thickness, 2023 to 2033

Figure 142: South Asia Market Y-o-Y Growth (%) Projections by Thickness, 2023 to 2033

Figure 143: South Asia Market Value (US$ Million) Analysis, By Application, 2018 to 2022

Figure 144: South Asia Market Volume (Sq. Mt.) Analysis, By Application, 2018 to 2033

Figure 145: South Asia Market Value Share (%) and BPS Analysis, By Application, 2023 to 2033

Figure 146: South Asia Market Y-o-Y Growth (%) Projections by Application, 2023 to 2033

Figure 147: South Asia Market Attractiveness by Material, 2023 to 2033

Figure 148: South Asia Market Attractiveness by Adhesive Type, 2023 to 2033

Figure 149: South Asia Market Attractiveness by Thickness, 2023 to 2033

Figure 150: South Asia Market Attractiveness by Application, 2023 to 2033

Figure 151: South Asia Market Attractiveness by Country, 2023 to 2033

Figure 152: East Asia Market Value (US$ Million) by Material, 2023 to 2033

Figure 153: East Asia Market Value (US$ Million) by Adhesive Type, 2023 to 2033

Figure 154: East Asia Market Value (US$ Million) by Thickness, 2023 to 2033

Figure 155: East Asia Market Value (US$ Million) by Application, 2023 to 2033

Figure 156: East Asia Market Value (US$ Million) by Country, 2023 to 2033

Figure 157: East Asia Market Value (US$ Million) Analysis, By Country, 2018 to 2022

Figure 158: East Asia Market Volume (Sq. Mt.) Analysis, By Country, 2018 to 2033

Figure 159: East Asia Market Value Share (%) and BPS Analysis, By Country, 2023 to 2033

Figure 160: East Asia Market Y-o-Y Growth (%) Projections by Country, 2023 to 2033

Figure 161: East Asia Market Value (US$ Million) Analysis, By Material, 2018 to 2022

Figure 162: East Asia Market Volume (Sq. Mt.) Analysis, By Material, 2018 to 2033

Figure 163: East Asia Market Value Share (%) and BPS Analysis, By Material, 2023 to 2033

Figure 164: East Asia Market Y-o-Y Growth (%) Projections by Material, 2023 to 2033

Figure 165: East Asia Market Value (US$ Million) Analysis, By Adhesive Type, 2018 to 2022

Figure 166: East Asia Market Volume (Sq. Mt.) Analysis, By Adhesive Type, 2018 to 2033

Figure 167: East Asia Market Value Share (%) and BPS Analysis, By Adhesive Type, 2023 to 2033

Figure 168: East Asia Market Y-o-Y Growth (%) Projections by Adhesive Type, 2023 to 2033

Figure 169: East Asia Market Value (US$ Million) Analysis, By Thickness, 2018 to 2022

Figure 170: East Asia Market Volume (Sq. Mt.) Analysis, By Thickness, 2018 to 2033

Figure 171: East Asia Market Value Share (%) and BPS Analysis, By Thickness, 2023 to 2033

Figure 172: East Asia Market Y-o-Y Growth (%) Projections by Thickness, 2023 to 2033

Figure 173: East Asia Market Value (US$ Million) Analysis, By Application, 2018 to 2022

Figure 174: East Asia Market Volume (Sq. Mt.) Analysis, By Application, 2018 to 2033

Figure 175: East Asia Market Value Share (%) and BPS Analysis, By Application, 2023 to 2033

Figure 176: East Asia Market Y-o-Y Growth (%) Projections by Application, 2023 to 2033

Figure 177: East Asia Market Attractiveness by Material, 2023 to 2033

Figure 178: East Asia Market Attractiveness by Adhesive Type, 2023 to 2033

Figure 179: East Asia Market Attractiveness by Sales Chanel, 2023 to 2033

Figure 180: East Asia Market Attractiveness by Application, 2023 to 2033

Figure 181: East Asia Market Attractiveness by Country, 2023 to 2033

Figure 182: Oceania Market Value (US$ Million) by Material, 2023 to 2033

Figure 183: Oceania Market Value (US$ Million) by Adhesive Type, 2023 to 2033

Figure 184: Oceania Market Value (US$ Million) by Thickness, 2023 to 2033

Figure 185: Oceania Market Value (US$ Million) by Application, 2023 to 2033

Figure 186: Oceania Market Value (US$ Million) by Country, 2023 to 2033

Figure 187: Oceania Market Value (US$ Million) Analysis, By Country, 2018 to 2022

Figure 188: Oceania Market Volume (Sq. Mt.) Analysis, By Country, 2018 to 2033

Figure 189: Oceania Market Value Share (%) and BPS Analysis, By Country, 2023 to 2033

Figure 190: Oceania Market Y-o-Y Growth (%) Projections by Country, 2023 to 2033

Figure 191: Oceania Market Value (US$ Million) Analysis, By Material, 2018 to 2022

Figure 192: Oceania Market Volume (Sq. Mt.) Analysis, By Material, 2018 to 2033

Figure 193: Oceania Market Value Share (%) and BPS Analysis, By Material, 2023 to 2033

Figure 194: Oceania Market Y-o-Y Growth (%) Projections by Material, 2023 to 2033

Figure 195: Oceania Market Value (US$ Million) Analysis, By Adhesive Type, 2018 to 2022

Figure 196: Oceania Market Volume (Sq. Mt.) Analysis, By Adhesive Type, 2018 to 2033

Figure 197: Oceania Market Value Share (%) and BPS Analysis, By Adhesive Type, 2023 to 2033

Figure 198: Oceania Market Y-o-Y Growth (%) Projections by Adhesive Type, 2023 to 2033

Figure 199: Oceania Market Value (US$ Million) Analysis, By Thickness, 2018 to 2022

Figure 200: Oceania Market Volume (Sq. Mt.) Analysis, By Thickness, 2018 to 2033

Figure 201: Oceania Market Value Share (%) and BPS Analysis, By Thickness, 2023 to 2033

Figure 202: Oceania Market Y-o-Y Growth (%) Projections by Thickness, 2023 to 2033

Figure 203: Oceania Market Value (US$ Million) Analysis, By Application, 2018 to 2022

Figure 204: Oceania Market Volume (Sq. Mt.) Analysis, By Application, 2018 to 2033

Figure 205: Oceania Market Value Share (%) and BPS Analysis, By Application, 2023 to 2033

Figure 206: Oceania Market Y-o-Y Growth (%) Projections by Application, 2023 to 2033

Figure 207: Oceania Market Attractiveness by Material, 2023 to 2033

Figure 208: Oceania Market Attractiveness by Adhesive Type, 2023 to 2033

Figure 209: Oceania Market Attractiveness by Thickness, 2023 to 2033

Figure 210: Oceania Market Attractiveness by Application, 2023 to 2033

Figure 211: Oceania Market Attractiveness by Country, 2022

Figure 212: MEA Market Value (US$ Million) by Material, 2023 to 2033

Figure 213: MEA Market Value (US$ Million) by Adhesive Type, 2023 to 2033

Figure 214: MEA Market Value (US$ Million) by Thickness, 2023 to 2033

Figure 215: MEA Market Value (US$ Million) by Application, 2023 to 2033

Figure 216: MEA Market Value (US$ Million) by Country, 2023 to 2033

Figure 217: MEA Market Value (US$ Million) Analysis, By Country, 2018 to 2022

Figure 218: MEA Market Volume (Sq. Mt.) Analysis, By Country, 2018 to 2033

Figure 219: MEA Market Value Share (%) and BPS Analysis, By Country, 2023 to 2033

Figure 220: MEA Market Y-o-Y Growth (%) Projections by Country, 2023 to 2033

Figure 221: MEA Market Value (US$ Million) Analysis, By Material, 2018 to 2022

Figure 222: MEA Market Volume (Sq. Mt.) Analysis, By Material, 2018 to 2033

Figure 223: MEA Market Value Share (%) and BPS Analysis, By Material, 2023 to 2033

Figure 224: MEA Market Y-o-Y Growth (%) Projections by Material, 2023 to 2033

Figure 225: MEA Market Value (US$ Million) Analysis, By Adhesive Type, 2018 to 2022

Figure 226: MEA Market Volume (Sq. Mt.) Analysis, By Adhesive Type, 2018 to 2033

Figure 227: MEA Market Value Share (%) and BPS Analysis, By Adhesive Type, 2023 to 2033

Figure 228: MEA Market Y-o-Y Growth (%) Projections by Adhesive Type, 2023 to 2033

Figure 229: MEA Market Value (US$ Million) Analysis, By Thickness, 2018 to 2022

Figure 230: MEA Market Volume (Sq. Mt.) Analysis, By Thickness, 2018 to 2033

Figure 231: MEA Market Value Share (%) and BPS Analysis, By Thickness, 2023 to 2033

Figure 232: MEA Market Y-o-Y Growth (%) Projections by Thickness, 2023 to 2033

Figure 233: MEA Market Value (US$ Million) Analysis, By Application, 2018 to 2022

Figure 234: MEA Market Volume (Sq. Mt.) Analysis, By Application, 2018 to 2033

Figure 235: MEA Market Value Share (%) and BPS Analysis, By Application, 2023 to 2033

Figure 235: MEA Market Y-o-Y Growth (%) Projections by Application, 2023 to 2033

Figure 236: MEA Market Attractiveness by Material, 2023 to 2033

Figure 237: MEA Market Attractiveness by Adhesive Type, 2023 to 2033

Figure 238: MEA Market Attractiveness by Thickness, 2023 to 2033

Figure 239: MEA Market Attractiveness by Application, 2023 to 2033

Figure 240: MEA Market Attractiveness by Country, 2023 to 2033

Recommendations

Packaging

Automotive Tape Market

Published : January 2024

Packaging

Hot Melt Adhesive Tapes Market

Published : August 2023

Packaging

Tapes Market

Published : June 2023

Packaging

Rubber Tapes Market

Published : May 2023

Explore Packaging Insights

View Reports