Reports

- Global Locations -

Headquarters

Future Market Insights, Inc.

Christiana Corporate, 200
Continental Drive, Suite 401,
Newark, Delaware - 19713,
United States

T: +1-845-579-5705

Americas

Future Market Insights, Inc.

616 Corporate Way, Suite 2-9018,
Valley Cottage, NY 10989, United States

T: +1-347-918-3531

MEA

Future Market Insights

1602-6 Jumeirah Bay X2 Tower, Plot No: JLT-PH2-X2A,
Jumeirah Lakes Towers, Dubai,
United Arab Emirates

Europe

Future Market Insights

3rd Floor, 207 Regent Street,
W1B 3HH London
United Kingdom

T: + 44 (0) 20 8123 9659
D: +44 (0) 20 3287 4268

Asia Pacific

Future Market Insights

IndiaLand Global Tech Park, Unit UG-1, Behind Grand HighStreet, Phase 1, Hinjawadi, MH, Pune – 411057, India

Wire Livestock Panels Market Outlook

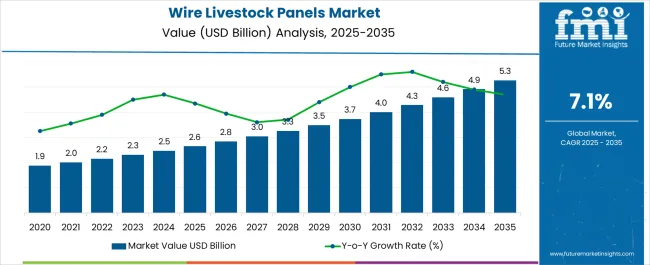
Newly-released analysis report by Future Market Insights shows that the global wire livestock panels market is expected to reach US$ 2.31 billion in 2023. With a CAGR of 7.1% from 2023 to 2033, the market is projected to reach a valuation of US$ 4.58 billion by 2033.

The wire livestock panels market is a growing industry, driven by the increasing demand for sustainable and efficient animal husbandry practices. The demand for wire livestock panels, also known as cattle panels or hog panels, is also rising because of the growing preference for fencing solutions for farms and ranches. These are commonly used for containing and separating cattle, pigs and other livestock.

Farmers prefer using these panels since they are made of galvanized wire or plastic-coated wire, which makes them durable and versatile. They are also suitable for various climates and are considered cost-effective solutions for farmers and ranchers.

The market growth is also supported by the increasing demand for meat and dairy products, as well as the growing popularity of small-scale and hobby farming. There is also a growing trend towards sustainable and human farming practices which can be supported by the use of wire livestock panels.

Consumers and farmers are becoming more conscious of the impact of farming on the environment and animal welfare. Therefore, wire livestock panels are becoming more popular as a sustainable and humane alternative to traditional fencing methods.

Attributes Details
Wire Livestock Panels Market Value (2023) US$ 2.31 billion
Wire Livestock Panels Market Expected Value (2033) US$ 4.58 billion
Wire Livestock Panels Market Projected CAGR (2023 to 2033) 7.1%

Don't pay for what you don't need

Customize your report by selecting specific countries or regions and save 30%!

Outlook Scope of Wire Livestock Panels Market 2023 to 2033 Compared to 2016 to 2022

The market has evolved over time in response to changes in the agriculture industry, advances in technology and manufacturing processes, and shifts in consumer demand. Therefore, when compared to the 6.4% CAGR recorded between 2016 and 2022, the wire livestock panels market is predicted to expand at a 7.1% CAGR between 2023 and 2033.

Short Term (2023 to 2026) Factors such as increasing livestock production and rising demand for meat and dairy products are expected to drive market growth.
Medium Term (2026 to 2029) The adoption of wire livestock panels for enclosures, pens, and fencing is likely to grow as the industry is becoming more focused on efficiency and cost-effectiveness, as well as animal welfare and safety.
Long Term (2029 to 2033) Innovations in materials, designs, and manufacturing techniques are anticipated to make wire livestock panels more durable, versatile, and affordable over time. This is projected to result in market growth.

These factors are anticipated to support about a 2X increase in the wire livestock panels market between 2023 and 2033. The market is projected to be worth US$ 4.58 billion by the end of 2033, according to FMI analysts.

Market-o-Nomics-Highlighting the Wire Livestock Panels Market Key Drivers, Restraints, Opportunities and Threats

The global market is anticipated to expand significantly during the forecast period as a result of various key aspects that have been identified. Along with factors influencing the market's expansion, FMI analysts looked at potential threats, tempting opportunities, and restricting factors that may have an impact on the sales of wire livestock panels.

Drivers
  • The increasing demand for meat and dairy products worldwide is leading to an increase in the demand for wire livestock panels.
  • The use of wire livestock panels allows farmers to create a safe environment for animals which is essential for their health and welfare.
  • The development of new and innovative materials and technologies in wire livestock panels, such as high-tensile wire, is expected to increase product demand
  • Wire livestock panels are cost-effective solutions for farmers and ranchers as they are durable and require low maintenance
Restraints
  • The high cost of installing wire livestock panels is likely to be a significant restraint for farmers, especially for small-scale operations.
  • Exposure to extreme weather conditions such as heavy rain can cause damage to wire livestock panels that can lead to costly repairs or replacement
  • Limited awareness about the benefits and advantages of wire livestock panels, especially in developing countries.
  • Installing wire livestock panels can be labor-intensive that can be a deterrent for certain farmers and ranchers
  • Certain government regulations are likely to restrict the adoption in certain areas due to environmental safety concerns
Opportunities
  • The development of new and innovative materials and technologies, such as smart wire and wireless monitoring systems, are likely to open up market opportunities
  • The use of these panels is likely to help farmers to create a more sustainable and environmentally friendly animal management system
  • Government support and initiatives for the development of the livestock industry and the promotion of animal welfare
Threats
  • The market may face competition from alternative advanced products such as electric fences which are more cost-effective
  • Economic downturns may lead to a decrease in demand as farmers and ranchers may not have the financial means to invest in new fencing solutions
  • Climate change such as the increased frequency of natural disasters like floods can damage or destroy wire livestock panels
Nandini Roy Choudhury

Principal Consultant

Talk to Analyst

Find your sweet spots for generating winning opportunities in this market.

Comparative Analysis of Adjacent Wire Livestock Panels Market

Wire Livestock Panels Market:

Differentiating Aspects Wire Livestock Panels Market
CAGR (2023 to 2033) 7.1%
Market Valuation in 2023 US$ 2.31 billion
Projected Market Value in 2033 US$ 4.58 billion
Growth Factors Increase in livestock production
Opportunities Government support and initiatives
Key Trends Advancements in technology and materials

Fencing Market:

Differentiating Aspects Fencing Market
CAGR (2023 to 2033) 5.5%
Market Valuation in 2023 US$ 31.03 billion
Projected Market Value in 2033 US$ 53.01 billion
Growth Factors Rising concerns regarding safety and security
Opportunities The increasing availability of lightweight and inexpensive PVC fences
Key Trends Eco-friendly fencings are getting popular

Smart Farming Market:

Differentiating Aspects Smart Farming Market
CAGR (2023 to 2033) 18.40%
Market Valuation in 2023 US$ 20.54 billion
Projected Market Value in 2033 US$ 111.19 billion
Growth Factors Reasonably priced sensors are available
Opportunities Adoption of contemporary technology such as variable rate technology (VRT)
Key Trends Integration of smartphones with farm equipment

Insight into Key Product Types Stimulating Growth of Wire Livestock Panels Market

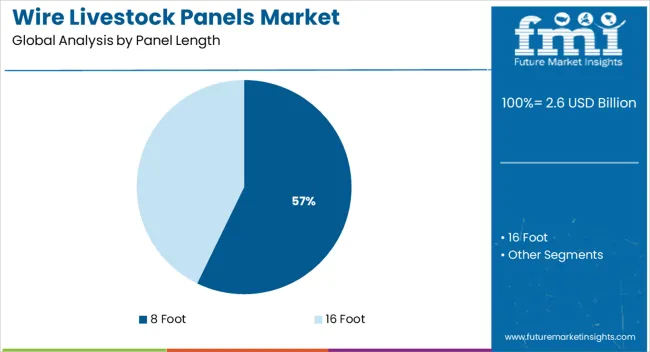
8 Foot Wire Livestock Panels: The New Standard for Animal Containment

Farmers prefer using 8 foot wire livestock panels since they offer several advantages such as:

  • They are typically easier to handle and transport, making them a good choice for small operations where mobility is important.
  • They are also more versatile, allowing farmers to create more customized containment solutions.
  • They are typically more durable and require less maintenance, making them a good choice for long-term use.
  • They are also more affordable than the 16 foot wire livestock panels.

Farmers and ranchers also adopt 8 foot panels since they can cover a larger area, making it more efficient for enclosing pastures or pens. These panels allow for easy installation and transportation. Furthermore, these panels are often more widely available and easier to find at agro stores. All of these factors make them a convenient choice for farmers and ranchers which are likely to increase the adoption of 8 foot wire livestock panels.

Ranchers’ Secret Weapon: Wire Livestock Panels for Strong and Durable Animal Enclosures

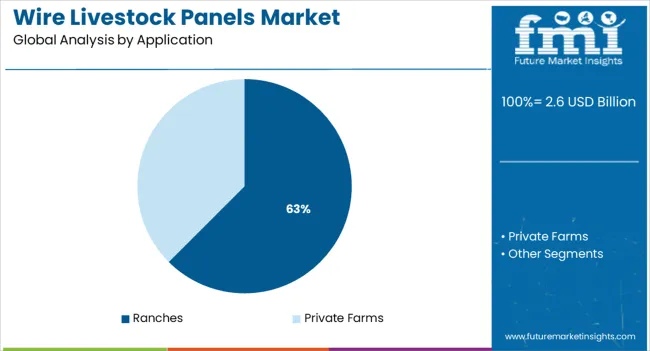
Even though both ranches and private farms use wire livestock panels, it is worth noting that wire livestock panels are more commonly used by ranchers. Wire livestock panels are practical, durable, and cost-effective solutions for ranches looking to contain and manage their animals. Ranches and large commercial farms tend to have a huge livestock population, typically perform larger operations and need to enclose a larger area.

These panels are also relatively lightweight, which makes them easy to move and reposition as needed. This is useful for ranches that need to regularly rotate grazing areas or move animals from one pen to other. Another reason ranches use wire panels is that they are relatively easier to install and can be configured in various ways to suit the needs of the ranch. This makes them an adaptable and flexible option for creating pens, corrals, and other enclosures for different types of livestock.
Get the data you need at a Fraction of the cost

Personalize your report by choosing insights you need
and save 40%!

Role of Prominent Countries in Market Development

Country United States
Market Share (2022) 30.8%
Market Value (2022) US$ 664.5 million
Country Germany
Market Share (2022) 16.1%
Market Value (2022) US$ 346.6 million
Country United Kingdom
Market Share (2022) 9.8%
Market Value (2022) US$ 211.3 million
Country China
Market Share (2022) 8.5%
Market Value (2022) US$ 182.65 million
Country Japan
Market Share (2022) 4.4%
Market Value (2022) US$ 94.5 million
Country India
Market Share (2022) 4.0%
Market Value (2022) US$ 85.8 million

Hobby Farms and Small-scale Agriculture Boost the Demand for Wire Livestock Panels in the United States

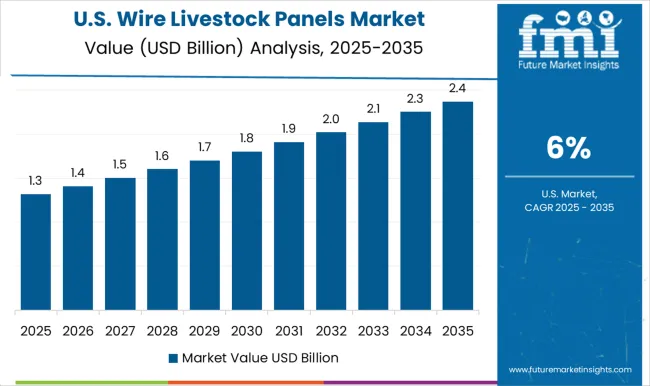
North America dominate the global market and the United States holds the predominant share of the market. The United States livestock panels market is a growing one, driven by increasing demand for sustainable and cost-effective fencing solutions for farms and ranches. The market growth can be attributed to the increasing popularity of hobby farms and small-scale agriculture, as well as the need for improved animal containment and protection.

The increasing demand for organic and locally sourced food products has led to a rise in small-scale farming operations, which in turn has driven demand for wire livestock panels. Many farmers and ranchers in the country are now using advanced technology such as GPS and remote monitoring systems to improve the efficiency and productivity of their operations.

The market is highly competitive in the United States, with numerous manufacturers and suppliers offering a wide range of products to meet the demand. Certain leading manufacturers of wire livestock panels in the country include Behlen Country, Cattle Panels, Red Brand and OK Brand.

Farmers in the United Kingdom Opt for Durable and Flexible Wire Livestock Panels

In the United Kingdom, the market is driven by the growing demand for sustainable and efficient farming practices. In recent years, there has been a growing trend of farmers in the country moving away from traditional wooden fences. Moreover, the demand for these panels is increasing among small and medium-sized farms as these are cheaper than wooden fences. Therefore, with growing awareness among farmers about the benefits of wire livestock panels, the United Kingdom wire livestock panels market is expected to continue to grow in the future.

The market is also characterized by a high degree of innovation and product development. Many companies are investing in research and development to improve the strength, durability and design of their wire livestock panels. This has led to the introduction of new and improved products in the market, such as panels with increased strength and corrosion resistance. Hence, the market in the United Kingdom is projected to reach US$ 440.2 million by 2033, exhibiting a CAGR of 7.6%.

Germany Sees Surge in Demand for Wire Livestock Panels as Farmers Modernize their Operations

The German wire livestock panels market is experiencing significant growth owing to the demand for advanced farming tools and solutions. The German government also plays a role in the growth of the wire livestock panels industry. The government provides subsidies and grants for farmers who want to invest in sustainable and modern farming equipment and infrastructure. This has led to more farmers investing in wire livestock panels as an alternative to traditional wooden fences.

Germany has several large commercial farms and wire livestock panels are ideal solutions for these farms. The market is also expected to benefit from the growing global trend towards large-scale industrial farming. As the demand for food products increases, more farmers are turning to industrial farming methods to increase productivity.

China’s Wire Livestock Panel Industry: Adapting to Changing Regulations and Materials

The Chinese wire livestock panels market is projected to surpass US$ 317.7 million by 2033, registering a CAGR of 5.7%. The wire livestock panels industry in China has numerous opportunities for growth as the government is promoting modern agriculture technologies and equipment. The government initiatives aim to improve the efficiency and productivity of the country’s agricultural sector.

Another significant reason why the market is growing is the rapidly expanding livestock industry in China. As the country’s economy continues to grow, there is a growing demand for high-quality animal products like meat and milk from consumers. To meet this demand, farmers are under increasing pressure to ensure that the animals are kept in a comfortable and safe environment.

Wire Panels Emerge as a Key Solution for Japan’s Livestock Farming Challenges

The wire livestock panel industry in Japan is relatively small compared to other countries. However, it’s been steadily growing in recent years. The key factor driving the Japanese wire livestock panels market is the growth of the livestock industry. Since the land in Japan is not suitable for agriculture, livestock farming is a common practice here. Moreover, as the population continues to grow, the number of small-scale farms has been increasing. This in turn is likely to increase the demand for wire livestock panels.

The market in Japan is also driven by the country’s efforts to increase its self-sufficiency in food production. Under its new plan for Sustainable Food Systems, the government has promised to meet several sustainability goals by the year 2050. A least 30% improvement in productivity in the food production industry is also included in this plan. This is likely to increase the number of livestock farms, which in turn is expected to drive product adoption.

Wire Panels Prove Cost-effective Solution for Livestock Fencing in India

Indian wire livestock panels market is growing predominantly in terms of CAGR as more farmers turn to the efficient method of managing their livestock. The market has the potential to play a key role in improving the efficiency of India’s livestock farming industry. Moreover, like other developing countries of the Asia Pacific region, India also has an increasing demand for meat and dairy products.

The population of the country is growing significantly, which in turn additionally increases the demand for animal products. This is expected to increase the size of the livestock industry. This in turn is anticipated to increase the adoption of wire livestock panels in the country. FMI analysts predict that the market in India is estimated to be valued at US$ 191.2 million by 2033, exhibiting a CAGR of 8.3%.

Start-ups are Revolutionizing the Wire Panel Market with their Advanced Technology and Custom Solutions

Start-ups in the wire livestock panels sector are likely to notice new prospects in the market throughout the forecast period. This is due to farmers' and ranchers' increased demand as a consequence of their search for more inexpensive alternatives to traditional fence systems.

AgriFence - This start-up offers a wide range of wire livestock panels including hog panels, horse panels and cattle panels. They also provide custom panel fabrication services.

Livestock Secure - It offers a broad range of panels, gates, and other livestock equipment including feeders, waterers, and shelters. They also offer custom fabrication services to meet specific needs.

Top Manufacturers and their Recent Significant Developments in the Market

Manufacturers of wire livestock panels invest money in research and development to create inventive wire panel designs that are suitable for the requirements of specific animals. This includes panels that may be customized with different widths, heights, and other options. Several manufacturers are currently offering wireless systems that enable farmers to monitor and control the panels from a distance.

Priefert Manufacturing is a company that specializes in the production of livestock equipment, including chutes, arenas, fencing, panels and other related products. The company is known for producing high-quality, durable equipment that is widely used by farmers, ranchers and other livestock professionals. They also offer a wide range of accessories and replacement parts for their products.

  • In December 2022, Priefert Manufacturing announced that it has selected River Logic's Network Design Optimization technology platform as part of its digital transformation to increase productivity in all areas of manufacturing.
  • In July 2021, the North American Steel Alliance added Priefert Manufacturing as a member-owner organization, making it the group's newest metals acquisition.

MJE Livestock Equipment produces the top livestock equipment by scrutinizing each stage of the manufacturing process to assure quality. It has developed economies at every station in its shop, starting with superior materials, to keep prices down without compromising quality. Products made by the company are made to last, from fabrication to welding to painting. In addition to the fence panels, MJE Livestock Equipment also manufactures gates, feeders, waterers, and mineral feeders.

In September 2022, MJE Livestock Equipment officially announced a significant expansion of its Dealer Network. Through these alliances, MJE Livestock Equipment will be accessible to farmers and ranchers throughout the United States.

Other Key Players Operating in the Wire Livestock Panels Market

  • Rizhao Borhaf Metal Products Co., Ltd.
  • CK Manufacturing
  • Hebei Metal Products Co., Ltd
  • WW Manufacturing
  • Qingdao Hailite Machinery Co.,Ltd.
  • Allen Gate & Panel
  • Hutchison
  • Behlen Country

Wire Livestock Panels Market Segmentation

By Panel Length:

  • 8 Foot
  • 16 Foot

By Application:

  • Ranches
  • Private Farms

By Sales Channel:

  • Direct Sales
  • Retail Sales

By Region:

  • North America
  • Latin America
  • Europe
  • East Asia
  • South Asia
  • Middle East and Africa

Frequently Asked Questions

How Big is the Wire Livestock Panels Market?

The market is valued at US$ 2.3 billion in 2023.

Who are the Key Wire Livestock Panels Industry Players?

CK Manufacturing, and Hebei Metal Products Co., Ltd. are the key industry players.

How is the Historical Performance of the Market?

The market held a CAGR of 6.4% from 2016 to 2022.

What Opportunities Await the Market Players?

Increasing demand for meat and dairy products to boost the market prospects.

What is the Growth Forecast for the Market?

The market is forecast to register a CAGR of 7.1% through 2033.

Table of Content

1. Executive Summary | Wire Livestock Panels Market

    1.1. Global Market Outlook

    1.2. Demand-side Trends

    1.3. Supply-side Trends

    1.4. Technology Roadmap Analysis

    1.5. Analysis and Recommendations

2. Market Overview

    2.1. Market Coverage / Taxonomy

    2.2. Market Definition / Scope / Limitations

3. Market Background

    3.1. Market Dynamics

        3.1.1. Drivers

        3.1.2. Restraints

        3.1.3. Opportunity

        3.1.4. Trends

    3.2. Scenario Forecast

        3.2.1. Demand in Optimistic Scenario

        3.2.2. Demand in Likely Scenario

        3.2.3. Demand in Conservative Scenario

    3.3. Opportunity Map Analysis

    3.4. Product Life Cycle Analysis

    3.5. Supply Chain Analysis

        3.5.1. Supply Side Participants and their Roles

            3.5.1.1. Producers

            3.5.1.2. Mid-Level Participants (Traders/ Agents/ Brokers)

            3.5.1.3. Wholesalers and Distributors

        3.5.2. Value Added and Value Created at Node in the Supply Chain

        3.5.3. List of Raw Material Suppliers

        3.5.4. List of Existing and Potential Buyer’s

    3.6. Investment Feasibility Matrix

    3.7. Value Chain Analysis

        3.7.1. Profit Margin Analysis

        3.7.2. Wholesalers and Distributors

        3.7.3. Retailers

    3.8. PESTLE and Porter’s Analysis

    3.9. Regulatory Landscape

        3.9.1. By Key Regions

        3.9.2. By Key Countries

    3.10. Regional Parent Market Outlook

    3.11. Production and Consumption Statistics

    3.12. Import and Export Statistics

4. Global Market Analysis 2018 to 2022 and Forecast, 2023 to 2033

    4.1. Historical Market Size Value (US$ Million) & Volume (Sq.Mtr) Analysis, 2018 to 2022

    4.2. Current and Future Market Size Value (US$ Million) & Volume (Sq.Mtr) Projections, 2023 to 2033

        4.2.1. Y-o-Y Growth Trend Analysis

        4.2.2. Absolute $ Opportunity Analysis

5. Global Market Analysis 2018 to 2022 and Forecast 2023 to 2033, By Panel Length

    5.1. Introduction / Key Findings

    5.2. Historical Market Size Value (US$ Million) & Volume (Sq.Mtr) Analysis By Panel Length, 2018 to 2022

    5.3. Current and Future Market Size Value (US$ Million) & Volume (Sq.Mtr) Analysis and Forecast By Panel Length, 2023 to 2033

        5.3.1. 8 Foot

        5.3.2. 16 Foot

    5.4. Y-o-Y Growth Trend Analysis By Panel Length, 2018 to 2022

    5.5. Absolute $ Opportunity Analysis By Panel Length, 2023 to 2033

6. Global Market Analysis 2018 to 2022 and Forecast 2023 to 2033, By Application

    6.1. Introduction / Key Findings

    6.2. Historical Market Size Value (US$ Million) & Volume (Sq.Mtr) Analysis By Application, 2018 to 2022

    6.3. Current and Future Market Size Value (US$ Million) & Volume (Sq.Mtr) Analysis and Forecast By Application, 2023 to 2033

        6.3.1. Ranches

        6.3.2. Private Farms

    6.4. Y-o-Y Growth Trend Analysis By Application, 2018 to 2022

    6.5. Absolute $ Opportunity Analysis By Application, 2023 to 2033

7. Global Market Analysis 2018 to 2022 and Forecast 2023 to 2033, By Sales Channel

    7.1. Introduction / Key Findings

    7.2. Historical Market Size Value (US$ Million) & Volume (Sq.Mtr) Analysis By Sales Channel, 2018 to 2022

    7.3. Current and Future Market Size Value (US$ Million) & Volume (Sq.Mtr) Analysis and Forecast By Sales Channel, 2023 to 2033

        7.3.1. Direct Sales

        7.3.2. Retail Sales

    7.4. Y-o-Y Growth Trend Analysis By Sales Channel, 2018 to 2022

    7.5. Absolute $ Opportunity Analysis By Sales Channel, 2023 to 2033

8. Global Market Analysis 2018 to 2022 and Forecast 2023 to 2033, By Region

    8.1. Introduction

    8.2. Historical Market Size Value (US$ Million) & Volume (Sq.Mtr) Analysis By Region, 2018 to 2022

    8.3. Current Market Size Value (US$ Million) & Volume (Sq.Mtr) Analysis and Forecast By Region, 2023 to 2033

        8.3.1. North America

        8.3.2. Latin America

        8.3.3. Europe

        8.3.4. Asia Pacific

        8.3.5. Middle East & Africa (MEA)

    8.4. Market Attractiveness Analysis By Region

9. North America Market Analysis 2018 to 2022 and Forecast 2023 to 2033, By Country

    9.1. Historical Market Size Value (US$ Million) & Volume (Sq.Mtr) Trend Analysis By Market Taxonomy, 2018 to 2022

    9.2. Market Size Value (US$ Million) & Volume (Sq.Mtr) Forecast By Market Taxonomy, 2023 to 2033

        9.2.1. By Country

            9.2.1.1. The USA

            9.2.1.2. Canada

        9.2.2. By Panel Length

        9.2.3. By Application

        9.2.4. By Sales Channel

    9.3. Market Attractiveness Analysis

        9.3.1. By Country

        9.3.2. By Panel Length

        9.3.3. By Application

        9.3.4. By Sales Channel

    9.4. Key Takeaways

10. Latin America Market Analysis 2018 to 2022 and Forecast 2023 to 2033, By Country

    10.1. Historical Market Size Value (US$ Million) & Volume (Sq.Mtr) Trend Analysis By Market Taxonomy, 2018 to 2022

    10.2. Market Size Value (US$ Million) & Volume (Sq.Mtr) Forecast By Market Taxonomy, 2023 to 2033

        10.2.1. By Country

            10.2.1.1. Brazil

            10.2.1.2. Mexico

            10.2.1.3. Rest of Latin America

        10.2.2. By Panel Length

        10.2.3. By Application

        10.2.4. By Sales Channel

    10.3. Market Attractiveness Analysis

        10.3.1. By Country

        10.3.2. By Panel Length

        10.3.3. By Application

        10.3.4. By Sales Channel

    10.4. Key Takeaways

11. Europe Market Analysis 2018 to 2022 and Forecast 2023 to 2033, By Country

    11.1. Historical Market Size Value (US$ Million) & Volume (Sq.Mtr) Trend Analysis By Market Taxonomy, 2018 to 2022

    11.2. Market Size Value (US$ Million) & Volume (Sq.Mtr) Forecast By Market Taxonomy, 2023 to 2033

        11.2.1. By Country

            11.2.1.1. Germany

            11.2.1.2. United Kingdom (UK)

            11.2.1.3. France

            11.2.1.4. Spain

            11.2.1.5. Italy

            11.2.1.6. Rest of Europe

        11.2.2. By Panel Length

        11.2.3. By Application

        11.2.4. By Sales Channel

    11.3. Market Attractiveness Analysis

        11.3.1. By Country

        11.3.2. By Panel Length

        11.3.3. By Application

        11.3.4. By Sales Channel

    11.4. Key Takeaways

12. Asia Pacific Market Analysis 2018 to 2022 and Forecast 2023 to 2033, By Country

    12.1. Historical Market Size Value (US$ Million) & Volume (Sq.Mtr) Trend Analysis By Market Taxonomy, 2018 to 2022

    12.2. Market Size Value (US$ Million) & Volume (Sq.Mtr) Forecast By Market Taxonomy, 2023 to 2033

        12.2.1. By Country

            12.2.1.1. China

            12.2.1.2. Japan

            12.2.1.3. South Korea

            12.2.1.4. Singapore

            12.2.1.5. Thailand

            12.2.1.6. Indonesia

            12.2.1.7. Australia

            12.2.1.8. New Zealand

            12.2.1.9. Rest of Asia Pacific

        12.2.2. By Panel Length

        12.2.3. By Application

        12.2.4. By Sales Channel

    12.3. Market Attractiveness Analysis

        12.3.1. By Country

        12.3.2. By Panel Length

        12.3.3. By Application

        12.3.4. By Sales Channel

    12.4. Key Takeaways

13. MEA Market Analysis 2018 to 2022 and Forecast 2023 to 2033, By Country

    13.1. Historical Market Size Value (US$ Million) & Volume (Sq.Mtr) Trend Analysis By Market Taxonomy, 2018 to 2022

    13.2. Market Size Value (US$ Million) & Volume (Sq.Mtr) Forecast By Market Taxonomy, 2023 to 2033

        13.2.1. By Country

            13.2.1.1. GCC Countries

            13.2.1.2. South Africa

            13.2.1.3. Israel

            13.2.1.4. Rest of MEA

        13.2.2. By Panel Length

        13.2.3. By Application

        13.2.4. By Sales Channel

    13.3. Market Attractiveness Analysis

        13.3.1. By Country

        13.3.2. By Panel Length

        13.3.3. By Application

        13.3.4. By Sales Channel

    13.4. Key Takeaways

14. Key Countries Market Analysis

    14.1. USA

        14.1.1. Pricing Analysis

        14.1.2. Market Share Analysis, 2022

            14.1.2.1. By Panel Length

            14.1.2.2. By Application

            14.1.2.3. By Sales Channel

    14.2. Canada

        14.2.1. Pricing Analysis

        14.2.2. Market Share Analysis, 2022

            14.2.2.1. By Panel Length

            14.2.2.2. By Application

            14.2.2.3. By Sales Channel

    14.3. Brazil

        14.3.1. Pricing Analysis

        14.3.2. Market Share Analysis, 2022

            14.3.2.1. By Panel Length

            14.3.2.2. By Application

            14.3.2.3. By Sales Channel

    14.4. Mexico

        14.4.1. Pricing Analysis

        14.4.2. Market Share Analysis, 2022

            14.4.2.1. By Panel Length

            14.4.2.2. By Application

            14.4.2.3. By Sales Channel

    14.5. Germany

        14.5.1. Pricing Analysis

        14.5.2. Market Share Analysis, 2022

            14.5.2.1. By Panel Length

            14.5.2.2. By Application

            14.5.2.3. By Sales Channel

    14.6. United Kingdom

        14.6.1. Pricing Analysis

        14.6.2. Market Share Analysis, 2022

            14.6.2.1. By Panel Length

            14.6.2.2. By Application

            14.6.2.3. By Sales Channel

    14.7. France

        14.7.1. Pricing Analysis

        14.7.2. Market Share Analysis, 2022

            14.7.2.1. By Panel Length

            14.7.2.2. By Application

            14.7.2.3. By Sales Channel

    14.8. Spain

        14.8.1. Pricing Analysis

        14.8.2. Market Share Analysis, 2022

            14.8.2.1. By Panel Length

            14.8.2.2. By Application

            14.8.2.3. By Sales Channel

    14.9. Italy

        14.9.1. Pricing Analysis

        14.9.2. Market Share Analysis, 2022

            14.9.2.1. By Panel Length

            14.9.2.2. By Application

            14.9.2.3. By Sales Channel

    14.10. China

        14.10.1. Pricing Analysis

        14.10.2. Market Share Analysis, 2022

            14.10.2.1. By Panel Length

            14.10.2.2. By Application

            14.10.2.3. By Sales Channel

    14.11. Japan

        14.11.1. Pricing Analysis

        14.11.2. Market Share Analysis, 2022

            14.11.2.1. By Panel Length

            14.11.2.2. By Application

            14.11.2.3. By Sales Channel

    14.12. South Korea

        14.12.1. Pricing Analysis

        14.12.2. Market Share Analysis, 2022

            14.12.2.1. By Panel Length

            14.12.2.2. By Application

            14.12.2.3. By Sales Channel

    14.13. Singapore

        14.13.1. Pricing Analysis

        14.13.2. Market Share Analysis, 2022

            14.13.2.1. By Panel Length

            14.13.2.2. By Application

            14.13.2.3. By Sales Channel

    14.14. Thailand

        14.14.1. Pricing Analysis

        14.14.2. Market Share Analysis, 2022

            14.14.2.1. By Panel Length

            14.14.2.2. By Application

            14.14.2.3. By Sales Channel

    14.15. Indonesia

        14.15.1. Pricing Analysis

        14.15.2. Market Share Analysis, 2022

            14.15.2.1. By Panel Length

            14.15.2.2. By Application

            14.15.2.3. By Sales Channel

    14.16. Australia

        14.16.1. Pricing Analysis

        14.16.2. Market Share Analysis, 2022

            14.16.2.1. By Panel Length

            14.16.2.2. By Application

            14.16.2.3. By Sales Channel

    14.17. New Zealand

        14.17.1. Pricing Analysis

        14.17.2. Market Share Analysis, 2022

            14.17.2.1. By Panel Length

            14.17.2.2. By Application

            14.17.2.3. By Sales Channel

    14.18. GCC Countries

        14.18.1. Pricing Analysis

        14.18.2. Market Share Analysis, 2022

            14.18.2.1. By Panel Length

            14.18.2.2. By Application

            14.18.2.3. By Sales Channel

    14.19. South Africa

        14.19.1. Pricing Analysis

        14.19.2. Market Share Analysis, 2022

            14.19.2.1. By Panel Length

            14.19.2.2. By Application

            14.19.2.3. By Sales Channel

    14.20. Israel

        14.20.1. Pricing Analysis

        14.20.2. Market Share Analysis, 2022

            14.20.2.1. By Panel Length

            14.20.2.2. By Application

            14.20.2.3. By Sales Channel

15. Market Structure Analysis

    15.1. Competition Dashboard

    15.2. Competition Benchmarking

    15.3. Market Share Analysis of Top Players

        15.3.1. By Regional

        15.3.2. By Panel Length

        15.3.3. By Application

        15.3.4. By Sales Channel

16. Competition Analysis

    16.1. Competition Deep Dive

        16.1.1. CK Manufacturing

            16.1.1.1. Overview

            16.1.1.2. Product Portfolio

            16.1.1.3. Profitability by Market Segments

            16.1.1.4. Sales Footprint

            16.1.1.5. Strategy Overview

                16.1.1.5.1. Marketing Strategy

                16.1.1.5.2. Product Strategy

                16.1.1.5.3. Channel Strategy

        16.1.2. WW Manufacturing

            16.1.2.1. Overview

            16.1.2.2. Product Portfolio

            16.1.2.3. Profitability by Market Segments

            16.1.2.4. Sales Footprint

            16.1.2.5. Strategy Overview

                16.1.2.5.1. Marketing Strategy

                16.1.2.5.2. Product Strategy

                16.1.2.5.3. Channel Strategy

        16.1.3. Behlen Country

            16.1.3.1. Overview

            16.1.3.2. Product Portfolio

            16.1.3.3. Profitability by Market Segments

            16.1.3.4. Sales Footprint

            16.1.3.5. Strategy Overview

                16.1.3.5.1. Marketing Strategy

                16.1.3.5.2. Product Strategy

                16.1.3.5.3. Channel Strategy

        16.1.4. hutchison-inc.com

            16.1.4.1. Overview

            16.1.4.2. Product Portfolio

            16.1.4.3. Profitability by Market Segments

            16.1.4.4. Sales Footprint

            16.1.4.5. Strategy Overview

                16.1.4.5.1. Marketing Strategy

                16.1.4.5.2. Product Strategy

                16.1.4.5.3. Channel Strategy

        16.1.5. MJE Livestock Equipment

            16.1.5.1. Overview

            16.1.5.2. Product Portfolio

            16.1.5.3. Profitability by Market Segments

            16.1.5.4. Sales Footprint

            16.1.5.5. Strategy Overview

                16.1.5.5.1. Marketing Strategy

                16.1.5.5.2. Product Strategy

                16.1.5.5.3. Channel Strategy

        16.1.6. allengateandpanel.com

            16.1.6.1. Overview

            16.1.6.2. Product Portfolio

            16.1.6.3. Profitability by Market Segments

            16.1.6.4. Sales Footprint

            16.1.6.5. Strategy Overview

                16.1.6.5.1. Marketing Strategy

                16.1.6.5.2. Product Strategy

                16.1.6.5.3. Channel Strategy

        16.1.7. Priefert

            16.1.7.1. Overview

            16.1.7.2. Product Portfolio

            16.1.7.3. Profitability by Market Segments

            16.1.7.4. Sales Footprint

            16.1.7.5. Strategy Overview

                16.1.7.5.1. Marketing Strategy

                16.1.7.5.2. Product Strategy

                16.1.7.5.3. Channel Strategy

        16.1.8. Qingdao Hailite Machinery Co.,Ltd.

            16.1.8.1. Overview

            16.1.8.2. Product Portfolio

            16.1.8.3. Profitability by Market Segments

            16.1.8.4. Sales Footprint

            16.1.8.5. Strategy Overview

                16.1.8.5.1. Marketing Strategy

                16.1.8.5.2. Product Strategy

                16.1.8.5.3. Channel Strategy

        16.1.9. Hebei Metalx Metal Products Co., Ltd

            16.1.9.1. Overview

            16.1.9.2. Product Portfolio

            16.1.9.3. Profitability by Market Segments

            16.1.9.4. Sales Footprint

            16.1.9.5. Strategy Overview

                16.1.9.5.1. Marketing Strategy

                16.1.9.5.2. Product Strategy

                16.1.9.5.3. Channel Strategy

        16.1.10. Rizhao Borhaf Metal Products Co., Ltd.

            16.1.10.1. Overview

            16.1.10.2. Product Portfolio

            16.1.10.3. Profitability by Market Segments

            16.1.10.4. Sales Footprint

            16.1.10.5. Strategy Overview

                16.1.10.5.1. Marketing Strategy

                16.1.10.5.2. Product Strategy

                16.1.10.5.3. Channel Strategy

17. Assumptions & Acronyms Used

18. Research Methodology

Don't pay for what you don't need

Customize your report by selecting specific countries or regions and save 30%!

List of Tables

Table 1: Global Market Value (US$ Million) Forecast by Region, 2018 to 2033

Table 2: Global Market Volume (Sq.Mtr) Forecast by Region, 2018 to 2033

Table 3: Global Market Value (US$ Million) Forecast by Panel Length, 2018 to 2033

Table 4: Global Market Volume (Sq.Mtr) Forecast by Panel Length, 2018 to 2033

Table 5: Global Market Value (US$ Million) Forecast by Application, 2018 to 2033

Table 6: Global Market Volume (Sq.Mtr) Forecast by Application, 2018 to 2033

Table 7: Global Market Value (US$ Million) Forecast by Sales Channel, 2018 to 2033

Table 8: Global Market Volume (Sq.Mtr) Forecast by Sales Channel, 2018 to 2033

Table 9: North America Market Value (US$ Million) Forecast by Country, 2018 to 2033

Table 10: North America Market Volume (Sq.Mtr) Forecast by Country, 2018 to 2033

Table 11: North America Market Value (US$ Million) Forecast by Panel Length, 2018 to 2033

Table 12: North America Market Volume (Sq.Mtr) Forecast by Panel Length, 2018 to 2033

Table 13: North America Market Value (US$ Million) Forecast by Application, 2018 to 2033

Table 14: North America Market Volume (Sq.Mtr) Forecast by Application, 2018 to 2033

Table 15: North America Market Value (US$ Million) Forecast by Sales Channel, 2018 to 2033

Table 16: North America Market Volume (Sq.Mtr) Forecast by Sales Channel, 2018 to 2033

Table 17: Latin America Market Value (US$ Million) Forecast by Country, 2018 to 2033

Table 18: Latin America Market Volume (Sq.Mtr) Forecast by Country, 2018 to 2033

Table 19: Latin America Market Value (US$ Million) Forecast by Panel Length, 2018 to 2033

Table 20: Latin America Market Volume (Sq.Mtr) Forecast by Panel Length, 2018 to 2033

Table 21: Latin America Market Value (US$ Million) Forecast by Application, 2018 to 2033

Table 22: Latin America Market Volume (Sq.Mtr) Forecast by Application, 2018 to 2033

Table 23: Latin America Market Value (US$ Million) Forecast by Sales Channel, 2018 to 2033

Table 24: Latin America Market Volume (Sq.Mtr) Forecast by Sales Channel, 2018 to 2033

Table 25: Europe Market Value (US$ Million) Forecast by Country, 2018 to 2033

Table 26: Europe Market Volume (Sq.Mtr) Forecast by Country, 2018 to 2033

Table 27: Europe Market Value (US$ Million) Forecast by Panel Length, 2018 to 2033

Table 28: Europe Market Volume (Sq.Mtr) Forecast by Panel Length, 2018 to 2033

Table 29: Europe Market Value (US$ Million) Forecast by Application, 2018 to 2033

Table 30: Europe Market Volume (Sq.Mtr) Forecast by Application, 2018 to 2033

Table 31: Europe Market Value (US$ Million) Forecast by Sales Channel, 2018 to 2033

Table 32: Europe Market Volume (Sq.Mtr) Forecast by Sales Channel, 2018 to 2033

Table 33: Asia Pacific Market Value (US$ Million) Forecast by Country, 2018 to 2033

Table 34: Asia Pacific Market Volume (Sq.Mtr) Forecast by Country, 2018 to 2033

Table 35: Asia Pacific Market Value (US$ Million) Forecast by Panel Length, 2018 to 2033

Table 36: Asia Pacific Market Volume (Sq.Mtr) Forecast by Panel Length, 2018 to 2033

Table 37: Asia Pacific Market Value (US$ Million) Forecast by Application, 2018 to 2033

Table 38: Asia Pacific Market Volume (Sq.Mtr) Forecast by Application, 2018 to 2033

Table 39: Asia Pacific Market Value (US$ Million) Forecast by Sales Channel, 2018 to 2033

Table 40: Asia Pacific Market Volume (Sq.Mtr) Forecast by Sales Channel, 2018 to 2033

Table 41: MEA Market Value (US$ Million) Forecast by Country, 2018 to 2033

Table 42: MEA Market Volume (Sq.Mtr) Forecast by Country, 2018 to 2033

Table 43: MEA Market Value (US$ Million) Forecast by Panel Length, 2018 to 2033

Table 44: MEA Market Volume (Sq.Mtr) Forecast by Panel Length, 2018 to 2033

Table 45: MEA Market Value (US$ Million) Forecast by Application, 2018 to 2033

Table 46: MEA Market Volume (Sq.Mtr) Forecast by Application, 2018 to 2033

Table 47: MEA Market Value (US$ Million) Forecast by Sales Channel, 2018 to 2033

Table 48: MEA Market Volume (Sq.Mtr) Forecast by Sales Channel, 2018 to 2033
Nandini Roy Choudhury

Principal Consultant

Talk to Analyst

Find your sweet spots for generating winning opportunities in this market.

List of Charts

Figure 1: Global Market Value (US$ Million) by Panel Length, 2023 to 2033

Figure 2: Global Market Value (US$ Million) by Application, 2023 to 2033

Figure 3: Global Market Value (US$ Million) by Sales Channel, 2023 to 2033

Figure 4: Global Market Value (US$ Million) by Region, 2023 to 2033

Figure 5: Global Market Value (US$ Million) Analysis by Region, 2018 to 2033

Figure 6: Global Market Volume (Sq.Mtr) Analysis by Region, 2018 to 2033

Figure 7: Global Market Value Share (%) and BPS Analysis by Region, 2023 to 2033

Figure 8: Global Market Y-o-Y Growth (%) Projections by Region, 2023 to 2033

Figure 9: Global Market Value (US$ Million) Analysis by Panel Length, 2018 to 2033

Figure 10: Global Market Volume (Sq.Mtr) Analysis by Panel Length, 2018 to 2033

Figure 11: Global Market Value Share (%) and BPS Analysis by Panel Length, 2023 to 2033

Figure 12: Global Market Y-o-Y Growth (%) Projections by Panel Length, 2023 to 2033

Figure 13: Global Market Value (US$ Million) Analysis by Application, 2018 to 2033

Figure 14: Global Market Volume (Sq.Mtr) Analysis by Application, 2018 to 2033

Figure 15: Global Market Value Share (%) and BPS Analysis by Application, 2023 to 2033

Figure 16: Global Market Y-o-Y Growth (%) Projections by Application, 2023 to 2033

Figure 17: Global Market Value (US$ Million) Analysis by Sales Channel, 2018 to 2033

Figure 18: Global Market Volume (Sq.Mtr) Analysis by Sales Channel, 2018 to 2033

Figure 19: Global Market Value Share (%) and BPS Analysis by Sales Channel, 2023 to 2033

Figure 20: Global Market Y-o-Y Growth (%) Projections by Sales Channel, 2023 to 2033

Figure 21: Global Market Attractiveness by Panel Length, 2023 to 2033

Figure 22: Global Market Attractiveness by Application, 2023 to 2033

Figure 23: Global Market Attractiveness by Sales Channel, 2023 to 2033

Figure 24: Global Market Attractiveness by Region, 2023 to 2033

Figure 25: North America Market Value (US$ Million) by Panel Length, 2023 to 2033

Figure 26: North America Market Value (US$ Million) by Application, 2023 to 2033

Figure 27: North America Market Value (US$ Million) by Sales Channel, 2023 to 2033

Figure 28: North America Market Value (US$ Million) by Country, 2023 to 2033

Figure 29: North America Market Value (US$ Million) Analysis by Country, 2018 to 2033

Figure 30: North America Market Volume (Sq.Mtr) Analysis by Country, 2018 to 2033

Figure 31: North America Market Value Share (%) and BPS Analysis by Country, 2023 to 2033

Figure 32: North America Market Y-o-Y Growth (%) Projections by Country, 2023 to 2033

Figure 33: North America Market Value (US$ Million) Analysis by Panel Length, 2018 to 2033

Figure 34: North America Market Volume (Sq.Mtr) Analysis by Panel Length, 2018 to 2033

Figure 35: North America Market Value Share (%) and BPS Analysis by Panel Length, 2023 to 2033

Figure 36: North America Market Y-o-Y Growth (%) Projections by Panel Length, 2023 to 2033

Figure 37: North America Market Value (US$ Million) Analysis by Application, 2018 to 2033

Figure 38: North America Market Volume (Sq.Mtr) Analysis by Application, 2018 to 2033

Figure 39: North America Market Value Share (%) and BPS Analysis by Application, 2023 to 2033

Figure 40: North America Market Y-o-Y Growth (%) Projections by Application, 2023 to 2033

Figure 41: North America Market Value (US$ Million) Analysis by Sales Channel, 2018 to 2033

Figure 42: North America Market Volume (Sq.Mtr) Analysis by Sales Channel, 2018 to 2033

Figure 43: North America Market Value Share (%) and BPS Analysis by Sales Channel, 2023 to 2033

Figure 44: North America Market Y-o-Y Growth (%) Projections by Sales Channel, 2023 to 2033

Figure 45: North America Market Attractiveness by Panel Length, 2023 to 2033

Figure 46: North America Market Attractiveness by Application, 2023 to 2033

Figure 47: North America Market Attractiveness by Sales Channel, 2023 to 2033

Figure 48: North America Market Attractiveness by Country, 2023 to 2033

Figure 49: Latin America Market Value (US$ Million) by Panel Length, 2023 to 2033

Figure 50: Latin America Market Value (US$ Million) by Application, 2023 to 2033

Figure 51: Latin America Market Value (US$ Million) by Sales Channel, 2023 to 2033

Figure 52: Latin America Market Value (US$ Million) by Country, 2023 to 2033

Figure 53: Latin America Market Value (US$ Million) Analysis by Country, 2018 to 2033

Figure 54: Latin America Market Volume (Sq.Mtr) Analysis by Country, 2018 to 2033

Figure 55: Latin America Market Value Share (%) and BPS Analysis by Country, 2023 to 2033

Figure 56: Latin America Market Y-o-Y Growth (%) Projections by Country, 2023 to 2033

Figure 57: Latin America Market Value (US$ Million) Analysis by Panel Length, 2018 to 2033

Figure 58: Latin America Market Volume (Sq.Mtr) Analysis by Panel Length, 2018 to 2033

Figure 59: Latin America Market Value Share (%) and BPS Analysis by Panel Length, 2023 to 2033

Figure 60: Latin America Market Y-o-Y Growth (%) Projections by Panel Length, 2023 to 2033

Figure 61: Latin America Market Value (US$ Million) Analysis by Application, 2018 to 2033

Figure 62: Latin America Market Volume (Sq.Mtr) Analysis by Application, 2018 to 2033

Figure 63: Latin America Market Value Share (%) and BPS Analysis by Application, 2023 to 2033

Figure 64: Latin America Market Y-o-Y Growth (%) Projections by Application, 2023 to 2033

Figure 65: Latin America Market Value (US$ Million) Analysis by Sales Channel, 2018 to 2033

Figure 66: Latin America Market Volume (Sq.Mtr) Analysis by Sales Channel, 2018 to 2033

Figure 67: Latin America Market Value Share (%) and BPS Analysis by Sales Channel, 2023 to 2033

Figure 68: Latin America Market Y-o-Y Growth (%) Projections by Sales Channel, 2023 to 2033

Figure 69: Latin America Market Attractiveness by Panel Length, 2023 to 2033

Figure 70: Latin America Market Attractiveness by Application, 2023 to 2033

Figure 71: Latin America Market Attractiveness by Sales Channel, 2023 to 2033

Figure 72: Latin America Market Attractiveness by Country, 2023 to 2033

Figure 73: Europe Market Value (US$ Million) by Panel Length, 2023 to 2033

Figure 74: Europe Market Value (US$ Million) by Application, 2023 to 2033

Figure 75: Europe Market Value (US$ Million) by Sales Channel, 2023 to 2033

Figure 76: Europe Market Value (US$ Million) by Country, 2023 to 2033

Figure 77: Europe Market Value (US$ Million) Analysis by Country, 2018 to 2033

Figure 78: Europe Market Volume (Sq.Mtr) Analysis by Country, 2018 to 2033

Figure 79: Europe Market Value Share (%) and BPS Analysis by Country, 2023 to 2033

Figure 80: Europe Market Y-o-Y Growth (%) Projections by Country, 2023 to 2033

Figure 81: Europe Market Value (US$ Million) Analysis by Panel Length, 2018 to 2033

Figure 82: Europe Market Volume (Sq.Mtr) Analysis by Panel Length, 2018 to 2033

Figure 83: Europe Market Value Share (%) and BPS Analysis by Panel Length, 2023 to 2033

Figure 84: Europe Market Y-o-Y Growth (%) Projections by Panel Length, 2023 to 2033

Figure 85: Europe Market Value (US$ Million) Analysis by Application, 2018 to 2033

Figure 86: Europe Market Volume (Sq.Mtr) Analysis by Application, 2018 to 2033

Figure 87: Europe Market Value Share (%) and BPS Analysis by Application, 2023 to 2033

Figure 88: Europe Market Y-o-Y Growth (%) Projections by Application, 2023 to 2033

Figure 89: Europe Market Value (US$ Million) Analysis by Sales Channel, 2018 to 2033

Figure 90: Europe Market Volume (Sq.Mtr) Analysis by Sales Channel, 2018 to 2033

Figure 91: Europe Market Value Share (%) and BPS Analysis by Sales Channel, 2023 to 2033

Figure 92: Europe Market Y-o-Y Growth (%) Projections by Sales Channel, 2023 to 2033

Figure 93: Europe Market Attractiveness by Panel Length, 2023 to 2033

Figure 94: Europe Market Attractiveness by Application, 2023 to 2033

Figure 95: Europe Market Attractiveness by Sales Channel, 2023 to 2033

Figure 96: Europe Market Attractiveness by Country, 2023 to 2033

Figure 97: Asia Pacific Market Value (US$ Million) by Panel Length, 2023 to 2033

Figure 98: Asia Pacific Market Value (US$ Million) by Application, 2023 to 2033

Figure 99: Asia Pacific Market Value (US$ Million) by Sales Channel, 2023 to 2033

Figure 100: Asia Pacific Market Value (US$ Million) by Country, 2023 to 2033

Figure 101: Asia Pacific Market Value (US$ Million) Analysis by Country, 2018 to 2033

Figure 102: Asia Pacific Market Volume (Sq.Mtr) Analysis by Country, 2018 to 2033

Figure 103: Asia Pacific Market Value Share (%) and BPS Analysis by Country, 2023 to 2033

Figure 104: Asia Pacific Market Y-o-Y Growth (%) Projections by Country, 2023 to 2033

Figure 105: Asia Pacific Market Value (US$ Million) Analysis by Panel Length, 2018 to 2033

Figure 106: Asia Pacific Market Volume (Sq.Mtr) Analysis by Panel Length, 2018 to 2033

Figure 107: Asia Pacific Market Value Share (%) and BPS Analysis by Panel Length, 2023 to 2033

Figure 108: Asia Pacific Market Y-o-Y Growth (%) Projections by Panel Length, 2023 to 2033

Figure 109: Asia Pacific Market Value (US$ Million) Analysis by Application, 2018 to 2033

Figure 110: Asia Pacific Market Volume (Sq.Mtr) Analysis by Application, 2018 to 2033

Figure 111: Asia Pacific Market Value Share (%) and BPS Analysis by Application, 2023 to 2033

Figure 112: Asia Pacific Market Y-o-Y Growth (%) Projections by Application, 2023 to 2033

Figure 113: Asia Pacific Market Value (US$ Million) Analysis by Sales Channel, 2018 to 2033

Figure 114: Asia Pacific Market Volume (Sq.Mtr) Analysis by Sales Channel, 2018 to 2033

Figure 115: Asia Pacific Market Value Share (%) and BPS Analysis by Sales Channel, 2023 to 2033

Figure 116: Asia Pacific Market Y-o-Y Growth (%) Projections by Sales Channel, 2023 to 2033

Figure 117: Asia Pacific Market Attractiveness by Panel Length, 2023 to 2033

Figure 118: Asia Pacific Market Attractiveness by Application, 2023 to 2033

Figure 119: Asia Pacific Market Attractiveness by Sales Channel, 2023 to 2033

Figure 120: Asia Pacific Market Attractiveness by Country, 2023 to 2033

Figure 121: MEA Market Value (US$ Million) by Panel Length, 2023 to 2033

Figure 122: MEA Market Value (US$ Million) by Application, 2023 to 2033

Figure 123: MEA Market Value (US$ Million) by Sales Channel, 2023 to 2033

Figure 124: MEA Market Value (US$ Million) by Country, 2023 to 2033

Figure 125: MEA Market Value (US$ Million) Analysis by Country, 2018 to 2033

Figure 126: MEA Market Volume (Sq.Mtr) Analysis by Country, 2018 to 2033

Figure 127: MEA Market Value Share (%) and BPS Analysis by Country, 2023 to 2033

Figure 128: MEA Market Y-o-Y Growth (%) Projections by Country, 2023 to 2033

Figure 129: MEA Market Value (US$ Million) Analysis by Panel Length, 2018 to 2033

Figure 130: MEA Market Volume (Sq.Mtr) Analysis by Panel Length, 2018 to 2033

Figure 131: MEA Market Value Share (%) and BPS Analysis by Panel Length, 2023 to 2033

Figure 132: MEA Market Y-o-Y Growth (%) Projections by Panel Length, 2023 to 2033

Figure 133: MEA Market Value (US$ Million) Analysis by Application, 2018 to 2033

Figure 134: MEA Market Volume (Sq.Mtr) Analysis by Application, 2018 to 2033

Figure 135: MEA Market Value Share (%) and BPS Analysis by Application, 2023 to 2033

Figure 136: MEA Market Y-o-Y Growth (%) Projections by Application, 2023 to 2033

Figure 137: MEA Market Value (US$ Million) Analysis by Sales Channel, 2018 to 2033

Figure 138: MEA Market Volume (Sq.Mtr) Analysis by Sales Channel, 2018 to 2033

Figure 139: MEA Market Value Share (%) and BPS Analysis by Sales Channel, 2023 to 2033

Figure 140: MEA Market Y-o-Y Growth (%) Projections by Sales Channel, 2023 to 2033

Figure 141: MEA Market Attractiveness by Panel Length, 2023 to 2033

Figure 142: MEA Market Attractiveness by Application, 2023 to 2033

Figure 143: MEA Market Attractiveness by Sales Channel, 2023 to 2033

Figure 144: MEA Market Attractiveness by Country, 2023 to 2033

Recommendations

Process Automation

Livestock Panel Gates Market

Published : January 2023

Technology

Precision Livestock Farming Market

Published : March 2022

Explore Process Automation Insights

View Reports

Wire Livestock Panels Market