Reports

- Global Locations -

Headquarters

Future Market Insights, Inc.

Christiana Corporate, 200
Continental Drive, Suite 401,
Newark, Delaware - 19713,
United States

T: +1-845-579-5705

Americas

Future Market Insights, Inc.

616 Corporate Way, Suite 2-9018,
Valley Cottage, NY 10989, United States

T: +1-347-918-3531

MEA

Future Market Insights

1602-6 Jumeirah Bay X2 Tower, Plot No: JLT-PH2-X2A,
Jumeirah Lakes Towers, Dubai,
United Arab Emirates

Europe

Future Market Insights

3rd Floor, 207 Regent Street,
W1B 3HH London
United Kingdom

T: + 44 (0) 20 8123 9659
D: +44 (0) 20 3287 4268

Asia Pacific

Future Market Insights

IndiaLand Global Tech Park, Unit UG-1, Behind Grand HighStreet, Phase 1, Hinjawadi, MH, Pune – 411057, India

Wireless Display Market Snapshot (2022-2032)

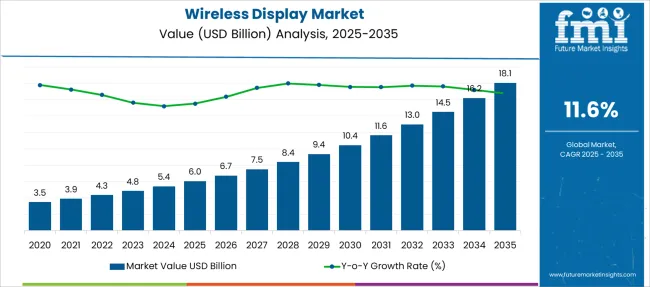
[250 Pages Report] The global wireless display market size is expected to be valued at US$ 12,989.0 Million in 2032. Increasing preference for promotional strategies and visual advertising in the commercial sector is projected to push the use of various types of wireless display adapters in the upcoming decade.

From 2016 to 2021, demand for wireless displays compounded at a rate of 10.4%. As per FMI, the global wireless display market is set to reach US$ 4,338.0 Million in 2022.

Report Attributes Key Statistics
Projected Market Value (2022) US$ 4,338.0 Million
Anticipated Forecast Value (2032) US$ 12,989.0 Million
Estimated Growth Rate (2022-2032) 11.6%

Wireless display helps in streamlining the process of connecting smartphones, tablets, and PCs to projectors and room displays by eliminating the requirement of VGA or HDMI adapters and AV cables. Presenters can move freely around a specific room without wires and cables.

At the same time, they can drive the content on the wireless display monitor and this would allow for a more natural collaboration and engagement with the entire room or even one-to-one. A wireless display receiver is often used to connect between a display screen or projector and the mobile device.

Several screen mirroring adapters available in the market today depend on a user gaining access to a wireless access point and utilize existing IP networks over WiFi to connect. Some of the other products can directly create a peer-to-peer connection between a room display and a device.

Don't pay for what you don't need

Customize your report by selecting specific countries or regions and save 30%!

What are the Factors Propelling the Global Wireless Display Market?

Emergence of numerous streaming solutions, including software suites and adapters is projected to change the means of learning, communication & collaboration, and entertainment in both commercial and residential applications. Various organizations across the globe are expected to rapidly adopt screen mirroring adapters to effectively collaborate and communicate with their stakeholders, including investors, clients, and employees.

Moreover, wireless computer monitors would help organizations to centralize data control and access. On account of this, these monitors are expected to be extensively used for training employees with the help of interactive techniques. At the same time, these are set to be used for the management of workforce engagement in a large number of organizational levels. Spurred by the aforementioned factors, sales of wireless displays are likely to grow at a rapid pace in the evaluation period.

What are the Factors Limiting the Wireless Display Market?

HDMI cables help in connecting media devices such as gaming consoles, DVRs, Blu-rays, and cable boxes to a TV set for providing audio and video content to viewers. Nowadays, people are rapidly inclining towards HDMI wireless display receivers from conventional HDMI cables to upgrade their appliances. However, use of the former does come with certain limitations.

There are certain factors that can lower the connection quality depending on an individual’s circumstances. The majority of the HDMI wireless display kits have a distance range of about 100 to 150 feet. If an individual goes beyond that particular range, it can reduce the quality of connection.

Besides, newly launched wireless HDMI monitors by key players are expensive as they include various innovative features. Thus, not many companies, especially in underdeveloped countries can afford these products, which may decline the wireless display market growth in future.
Sudip Saha
Sudip Saha

Principal Consultant

Talk to Analyst

Find your sweet spots for generating winning opportunities in this market.

Why is North America Projected to Dominate the Global Wireless Display Market?

As per FMI, North America wireless display market is estimated to generate a share of about 30.2% in 2022. Increasing adoption of consumer electronics such as laptops, smartphones, and smart TVs across the U.S. and Canada is anticipated to push the wireless display market share in North America.

Presence of a large number of renowned wireless external monitor manufacturers across North America is another vital factor that would propel the market. California-based ScreenBeam Inc., for instance, introduced the ScreenBeam Conference. It would help in adding support for crucial video conferencing services to the company’s wireless and contactless presentation platform. ScreenBeam Conference would allow users to host a hybrid meeting by using their conferencing client tool of choice and personal laptop.

Thus, ongoing product development activities by reputed companies based in North America is anticipated to bode well for the market.
What is the Contribution of Europe to Developing the Wireless Display Market?

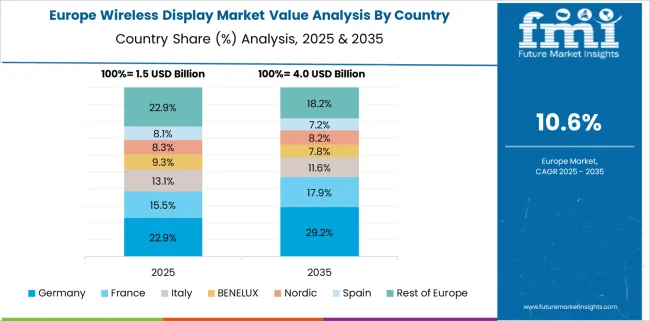
Europe wireless display market is projected to hold nearly 22.9% of share in 2022. Demand for wireless displays in Europe is expected to grow at a steady pace on the back of early adoption of wireless connectivity technologies across the U.K., Italy, and Germany. Rapid expansion of the education sector in Europe with rising investments by government agencies is another vital factor that is estimated to spur growth.

As per the U.K. Government, from 2020-2021, there were nearly 10,533,613 pupils in the country, which showcased a surge of 1.0%, as compared to 2018 to 2019. During the same period, the full-time equivalent number of teachers was 636,327 in the U.K. These numbers are likely to rise in the next decade, thereby pushing the need for advanced wireless display receivers.
Get the data you need at a Fraction of the cost

Personalize your report by choosing insights you need
and save 40%!

How Start-ups Are Adding Value to the Global Wireless Display Market?

  • In July 2022, ProScreenCast, a developer of wireless screen casting solutions, unveiled its new ProScreenCast SC01, which is a 4K wireless display adapter. It supports 3840×2160 resolution with High-Dynamic Range (HDR) support at up to 60 Hz. It comes with a user manual, a USB Type-C cable (1m), and an HDMI 2.0 cable (0.25m).
  • In December 2021, Astropad, a Minneapolis-based software development company, launched Luna Display. It is capable of extending a Mac laptop to an iPad, thereby creating a wireless second monitor with excellent image quality. It is currently available for USB-C or Mini DisplayPort and can be set up in a few seconds. It can work with a user’s existing Wi-Fi and would fit in the palm of one’s hand.

Competition Analysis

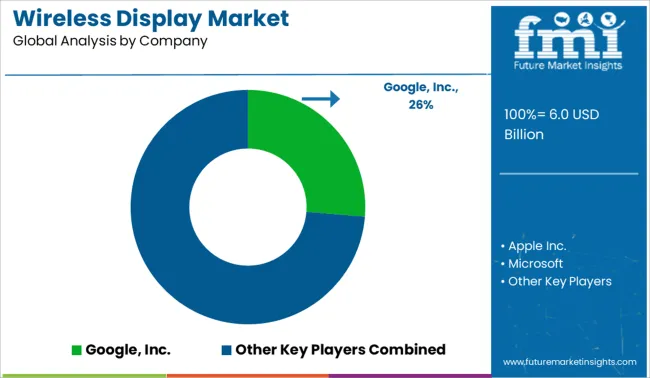
Some of the prominent companies present in the global wireless display market include Google, Inc., Apple Inc., Microsoft, Roku, Inc., Lattice Semiconductor, NETGEAR, Cavium, Actiontec Electronics, Inc., and Belkin International, Inc. among others.

The majority of the leading players are aiming to launch state-of-the-art wireless displays as per the requirements of a wide range of end-use industries. They are also joining hands with numerous educational institutions to supply their Bluetooth PC monitors for the betterment of students. A few other companies are engaging in mergers & acquisitions and joint ventures to strengthen their positions in the global wireless display market.

  • In July 2022, Panasonic, an industrial conglomerate company headquartered in Japan, declared that its Panasonic PressIT wireless presentation system was incorporated with two novel features to enable business users to smoothen their content sharing requirements. The company added Multicast and Wireless Display features for helping those looking for immediately share their views with a group. It would also enable users to share content or communicate with their team on a broader scale.
  • In July 2022, Google introduced its latest Chromecast with Google TV in India. At present, the device is available on Flipkart and is worth Rs 6,399 (US$ 80.11 Billion). The company is soon expected to market the new product in various other retail stores across the country. The new Chromecast with Google TV features a thin, compact design, and can be effortlessly connected into TV sets via HDMI ports.
  • In June 2022, Samsung Electronics America, Inc. unveiled its innovative interactive display called the 2022 Samsung Flip Pro at ISTELive 2022 in New Orleans to accelerate a bright future of education. The product will help teachers to inspire better learning outcomes, spark active learning, and provide dynamic lessons to all students. They can connect the display to any network or device by using wireless screen-mirroring and LAN port.

Report Scope

Report Attribute Details
Growth Rate 11.6% CAGR from 2022 to 2032
Market Value in 2022 US$ 4,338.0 Million
Market Value in 2032 US$ 12,989.0 Million
Base Year for Estimation 2021
Historical Data 2016-2021
Forecast Period 2022-2032
Quantitative Units US$ Million for Value
Report Coverage Revenue Forecast, Company Ranking, Competitive Landscape, Growth Factors, Trends, and Pricing Analysis
Segments Covered
  • Offering Type
  • Application
  • Region
Regions Covered
  • North America
  • Latin America
  • Europe
  • Asia Pacific
  • Middle East & Africa
Key Countries Profiled
  • USA
  • Canada
  • Brazil
  • Mexico
  • Germany
  • France
  • UK
  • Spain
  • Italy
  • China
  • Japan
  • South Korea
  • India
  • Malaysia
  • Singapore
  • Australia
  • New Zealand
  • GCC
  • South Africa
  • Israel
Key Companies Profiled
  • Google, Inc.
  • Apple Inc.
  • Microsoft
  • Roku, Inc.
  • Lattice Semiconductor
  • NETGEAR
  • Cavium
  • Actiontec Electronics, Inc.
  • Belkin International, Inc.
Customization Scope Available upon Request

Key Segments Profiled in the Global Wireless Display Market

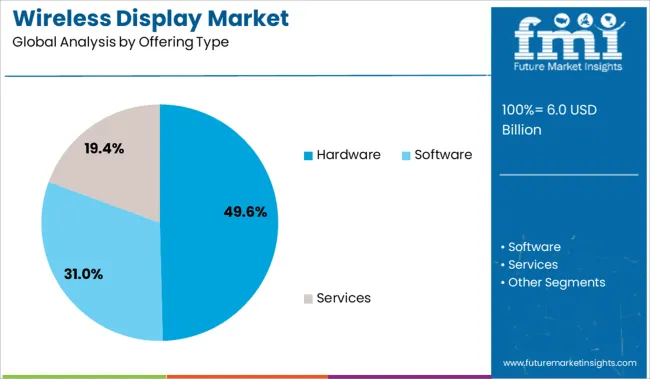
Wireless Display Market by Offering Type:

  • Hardware
  • Software
  • Services

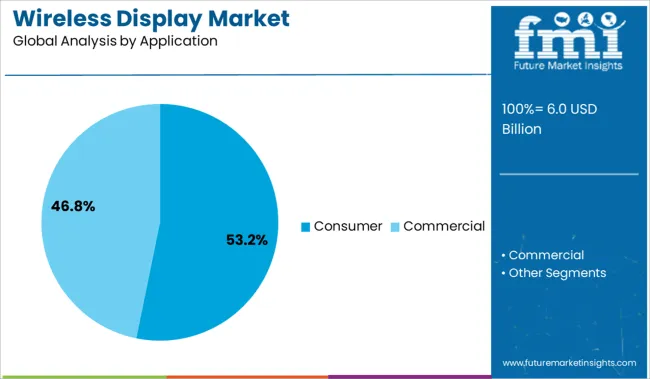
Wireless Display Market by Application:

  • Consumer
  • Commercial
  • Corporate
  • Educational
  • Government
  • Healthcare
  • Others

Wireless Display Market by Region:

  • North America
  • Latin America
  • Europe
  • Asia Pacific
  • Middle East & Africa

Frequently Asked Questions

What is the projected market value of the wireless display market by 2032?

The global wireless display market is expected to secure US$ 12,989.0 Million by 2032.

At what CAGR is the market for wireless display expected to grow from 2022-2032?

The wireless display market is anticipated to showcase a CAGR of 11.6% from 2022-2032.

Which are the eminent players in the wireless display market?

Wireless Display market are Google, Inc., Apple Inc., Microsoft, Roku, Inc., Lattice Semiconductor, NETGEAR, Cavium, Actiontec Electronics, Inc., and Belkin International, Inc. are some of the eminent players in the global wireless display market.

Table of Content

1. Executive Summary

    1.1. Global Market Outlook

    1.2. Demand-side Trends

    1.3. Supply-side Trends

    1.4. Technology Roadmap Analysis

    1.5. Analysis and Recommendations

2. Market Overview

    2.1. Market Coverage / Taxonomy

    2.2. Market Definition / Scope / Limitations

3. Market Background

    3.1. Market Dynamics

        3.1.1. Drivers

        3.1.2. Restraints

        3.1.3. Opportunity

        3.1.4. Trends

    3.2. Scenario Forecast

        3.2.1. Demand in Optimistic Scenario

        3.2.2. Demand in Likely Scenario

        3.2.3. Demand in Conservative Scenario

    3.3. Opportunity Map Analysis

    3.4. Investment Feasibility Matrix

    3.5. PESTLE and Porter’s Analysis

    3.6. Regulatory Landscape

        3.6.1. By Key Regions

        3.6.2. By Key Countries

    3.7. Regional Parent Market Outlook

4. Global Market Analysis 2017-2021 and Forecast, 2022-2032

    4.1. Historical Market Size Value (US$ Mn) Analysis, 2017-2021

    4.2. Current and Future Market Size Value (US$ Mn) Projections, 2022-2032

        4.2.1. Y-o-Y Growth Trend Analysis

        4.2.2. Absolute $ Opportunity Analysis

5. Global Market Analysis 2017-2021 and Forecast 2022-2032, By Offering Type

    5.1. Introduction / Key Findings

    5.2. Historical Market Size Value (US$ Mn) Analysis By Offering Type, 2017-2021

    5.3. Current and Future Market Size Value (US$ Mn) Analysis and Forecast By Offering Type, 2022-2032

        5.3.1. Hardware

        5.3.2. Software

        5.3.3. Services

    5.4. Y-o-Y Growth Trend Analysis By Offering Type, 2017-2021

    5.5. Absolute $ Opportunity Analysis By Offering Type, 2022-2032

6. Global Market Analysis 2017-2021 and Forecast 2022-2032, By Application

    6.1. Introduction / Key Findings

    6.2. Historical Market Size Value (US$ Mn) Analysis By Application, 2017-2021

    6.3. Current and Future Market Size Value (US$ Mn) Analysis and Forecast By Application, 2022-2032

        6.3.1. Consumer

        6.3.2. Commercial

            6.3.2.1. Corporate

            6.3.2.2. Educational

            6.3.2.3. Government

            6.3.2.4. Healthcare

            6.3.2.5. others

    6.4. Y-o-Y Growth Trend Analysis By Application, 2017-2021

    6.5. Absolute $ Opportunity Analysis By Application, 2022-2032

7. Global Market Analysis 2017-2021 and Forecast 2022-2032, By Region

    7.1. Introduction

    7.2. Historical Market Size Value (US$ Mn) Analysis By Region, 2017-2021

    7.3. Current Market Size Value (US$ Mn) Analysis and Forecast By Region, 2022-2032

        7.3.1. North America

        7.3.2. Latin America

        7.3.3. Europe

        7.3.4. Asia Pacific

        7.3.5. MEA

    7.4. Market Attractiveness Analysis By Region

8. North America Market Analysis 2017-2021 and Forecast 2022-2032, By Country

    8.1. Historical Market Size Value (US$ Mn) Trend Analysis By Market Taxonomy, 2017-2021

    8.2. Market Size Value (US$ Mn) Forecast By Market Taxonomy, 2022-2032

        8.2.1. By Country

            8.2.1.1. U.S.

            8.2.1.2. Canada

        8.2.2. By Offering Type

        8.2.3. By Application

    8.3. Market Attractiveness Analysis

        8.3.1. By Country

        8.3.2. By Offering Type

        8.3.3. By Application

    8.4. Key Takeaways

9. Latin America Market Analysis 2017-2021 and Forecast 2022-2032, By Country

    9.1. Historical Market Size Value (US$ Mn) Trend Analysis By Market Taxonomy, 2017-2021

    9.2. Market Size Value (US$ Mn) Forecast By Market Taxonomy, 2022-2032

        9.2.1. By Country

            9.2.1.1. Brazil

            9.2.1.2. Mexico

            9.2.1.3. Rest of Latin America

        9.2.2. By Offering Type

        9.2.3. By Application

    9.3. Market Attractiveness Analysis

        9.3.1. By Country

        9.3.2. By Offering Type

        9.3.3. By Application

    9.4. Key Takeaways

10. Europe Market Analysis 2017-2021 and Forecast 2022-2032, By Country

    10.1. Historical Market Size Value (US$ Mn) Trend Analysis By Market Taxonomy, 2017-2021

    10.2. Market Size Value (US$ Mn) Forecast By Market Taxonomy, 2022-2032

        10.2.1. By Country

            10.2.1.1. Germany

            10.2.1.2. U.K.

            10.2.1.3. France

            10.2.1.4. Spain

            10.2.1.5. Italy

            10.2.1.6. Rest of Europe

        10.2.2. By Offering Type

        10.2.3. By Application

    10.3. Market Attractiveness Analysis

        10.3.1. By Country

        10.3.2. By Offering Type

        10.3.3. By Application

    10.4. Key Takeaways

11. Asia Pacific Market Analysis 2017-2021 and Forecast 2022-2032, By Country

    11.1. Historical Market Size Value (US$ Mn) Trend Analysis By Market Taxonomy, 2017-2021

    11.2. Market Size Value (US$ Mn) Forecast By Market Taxonomy, 2022-2032

        11.2.1. By Country

            11.2.1.1. China

            11.2.1.2. Japan

            11.2.1.3. South Korea

            11.2.1.4. India

            11.2.1.5. Malaysia

            11.2.1.6. Singapore

            11.2.1.7. Australia

            11.2.1.8. New Zealand

            11.2.1.9. Rest of APAC

        11.2.2. By Offering Type

        11.2.3. By Application

    11.3. Market Attractiveness Analysis

        11.3.1. By Country

        11.3.2. By Offering Type

        11.3.3. By Application

    11.4. Key Takeaways

12. MEA Market Analysis 2017-2021 and Forecast 2022-2032, By Country

    12.1. Historical Market Size Value (US$ Mn) Trend Analysis By Market Taxonomy, 2017-2021

    12.2. Market Size Value (US$ Mn) Forecast By Market Taxonomy, 2022-2032

        12.2.1. By Country

            12.2.1.1. GCC Countries

            12.2.1.2. South Africa

            12.2.1.3. Israel

            12.2.1.4. Rest of MEA

        12.2.2. By Offering Type

        12.2.3. By Application

    12.3. Market Attractiveness Analysis

        12.3.1. By Country

        12.3.2. By Offering Type

        12.3.3. By Application

    12.4. Key Takeaways

13. Key Countries Market Analysis

    13.1. U.S.

        13.1.1. Pricing Analysis

        13.1.2. Market Share Analysis, 2021

            13.1.2.1. By Offering Type

            13.1.2.2. By Application

    13.2. Canada

        13.2.1. Pricing Analysis

        13.2.2. Market Share Analysis, 2021

            13.2.2.1. By Offering Type

            13.2.2.2. By Application

    13.3. Brazil

        13.3.1. Pricing Analysis

        13.3.2. Market Share Analysis, 2021

            13.3.2.1. By Offering Type

            13.3.2.2. By Application

    13.4. Mexico

        13.4.1. Pricing Analysis

        13.4.2. Market Share Analysis, 2021

            13.4.2.1. By Offering Type

            13.4.2.2. By Application

    13.5. Germany

        13.5.1. Pricing Analysis

        13.5.2. Market Share Analysis, 2021

            13.5.2.1. By Offering Type

            13.5.2.2. By Application

    13.6. U.K.

        13.6.1. Pricing Analysis

        13.6.2. Market Share Analysis, 2021

            13.6.2.1. By Offering Type

            13.6.2.2. By Application

    13.7. France

        13.7.1. Pricing Analysis

        13.7.2. Market Share Analysis, 2021

            13.7.2.1. By Offering Type

            13.7.2.2. By Application

    13.8. Spain

        13.8.1. Pricing Analysis

        13.8.2. Market Share Analysis, 2021

            13.8.2.1. By Offering Type

            13.8.2.2. By Application

    13.9. Italy

        13.9.1. Pricing Analysis

        13.9.2. Market Share Analysis, 2021

            13.9.2.1. By Offering Type

            13.9.2.2. By Application

    13.10. China

        13.10.1. Pricing Analysis

        13.10.2. Market Share Analysis, 2021

            13.10.2.1. By Offering Type

            13.10.2.2. By Application

    13.11. Japan

        13.11.1. Pricing Analysis

        13.11.2. Market Share Analysis, 2021

            13.11.2.1. By Offering Type

            13.11.2.2. By Application

    13.12. South Korea

        13.12.1. Pricing Analysis

        13.12.2. Market Share Analysis, 2021

            13.12.2.1. By Offering Type

            13.12.2.2. By Application

    13.13. Malaysia

        13.13.1. Pricing Analysis

        13.13.2. Market Share Analysis, 2021

            13.13.2.1. By Offering Type

            13.13.2.2. By Application

    13.14. Singapore

        13.14.1. Pricing Analysis

        13.14.2. Market Share Analysis, 2021

            13.14.2.1. By Offering Type

            13.14.2.2. By Application

    13.15. Australia

        13.15.1. Pricing Analysis

        13.15.2. Market Share Analysis, 2021

            13.15.2.1. By Offering Type

            13.15.2.2. By Application

    13.16. New Zealand

        13.16.1. Pricing Analysis

        13.16.2. Market Share Analysis, 2021

            13.16.2.1. By Offering Type

            13.16.2.2. By Application

    13.17. GCC Countries

        13.17.1. Pricing Analysis

        13.17.2. Market Share Analysis, 2021

            13.17.2.1. By Offering Type

            13.17.2.2. By Application

    13.18. South Africa

        13.18.1. Pricing Analysis

        13.18.2. Market Share Analysis, 2021

            13.18.2.1. By Offering Type

            13.18.2.2. By Application

    13.19. Israel

        13.19.1. Pricing Analysis

        13.19.2. Market Share Analysis, 2021

            13.19.2.1. By Offering Type

            13.19.2.2. By Application

14. Market Structure Analysis

    14.1. Competition Dashboard

    14.2. Competition Benchmarking

    14.3. Market Share Analysis of Top Players

        14.3.1. By Regional

        14.3.2. By Offering Type

        14.3.3. By Application

15. Competition Analysis

    15.1. Competition Deep Dive

        15.1.1. Google, Inc.

            15.1.1.1. Overview

            15.1.1.2. Product Portfolio

            15.1.1.3. Profitability by Market Segments

            15.1.1.4. Sales Footprint

            15.1.1.5. Strategy Overview

                15.1.1.5.1. Marketing Strategy

        15.1.2. Apple Inc.

            15.1.2.1. Overview

            15.1.2.2. Product Portfolio

            15.1.2.3. Profitability by Market Segments

            15.1.2.4. Sales Footprint

            15.1.2.5. Strategy Overview

                15.1.2.5.1. Marketing Strategy

        15.1.3. Microsoft

            15.1.3.1. Overview

            15.1.3.2. Product Portfolio

            15.1.3.3. Profitability by Market Segments

            15.1.3.4. Sales Footprint

            15.1.3.5. Strategy Overview

                15.1.3.5.1. Marketing Strategy

        15.1.4. Roku, Inc.

            15.1.4.1. Overview

            15.1.4.2. Product Portfolio

            15.1.4.3. Profitability by Market Segments

            15.1.4.4. Sales Footprint

            15.1.4.5. Strategy Overview

                15.1.4.5.1. Marketing Strategy

        15.1.5. Lattice Semiconductor

            15.1.5.1. Overview

            15.1.5.2. Product Portfolio

            15.1.5.3. Profitability by Market Segments

            15.1.5.4. Sales Footprint

            15.1.5.5. Strategy Overview

                15.1.5.5.1. Marketing Strategy

        15.1.6. NETGEAR

            15.1.6.1. Overview

            15.1.6.2. Product Portfolio

            15.1.6.3. Profitability by Market Segments

            15.1.6.4. Sales Footprint

            15.1.6.5. Strategy Overview

                15.1.6.5.1. Marketing Strategy

        15.1.7. Cavium

            15.1.7.1. Overview

            15.1.7.2. Product Portfolio

            15.1.7.3. Profitability by Market Segments

            15.1.7.4. Sales Footprint

            15.1.7.5. Strategy Overview

                15.1.7.5.1. Marketing Strategy

        15.1.8. Actiontec Electronics, Inc.

            15.1.8.1. Overview

            15.1.8.2. Product Portfolio

            15.1.8.3. Profitability by Market Segments

            15.1.8.4. Sales Footprint

            15.1.8.5. Strategy Overview

                15.1.8.5.1. Marketing Strategy

        15.1.9. Belkin International, Inc.

            15.1.9.1. Overview

            15.1.9.2. Product Portfolio

            15.1.9.3. Profitability by Market Segments

            15.1.9.4. Sales Footprint

            15.1.9.5. Strategy Overview

                15.1.9.5.1. Marketing Strategy

16. Assumptions & Acronyms Used

17. Research Methodology

Don't pay for what you don't need

Customize your report by selecting specific countries or regions and save 30%!

List of Tables

Table 1: Global Market Value (US$ Mn) Forecast by Region, 2017-2032

Table 2: Global Market Value (US$ Mn) Forecast by Offering Type, 2017-2032

Table 3: Global Market Value (US$ Mn) Forecast by Application, 2017-2032

Table 4: North America Market Value (US$ Mn) Forecast by Country, 2017-2032

Table 5: North America Market Value (US$ Mn) Forecast by Offering Type, 2017-2032

Table 6: North America Market Value (US$ Mn) Forecast by Application, 2017-2032

Table 7: Latin America Market Value (US$ Mn) Forecast by Country, 2017-2032

Table 8: Latin America Market Value (US$ Mn) Forecast by Offering Type, 2017-2032

Table 9: Latin America Market Value (US$ Mn) Forecast by Application, 2017-2032

Table 10: Europe Market Value (US$ Mn) Forecast by Country, 2017-2032

Table 11: Europe Market Value (US$ Mn) Forecast by Offering Type, 2017-2032

Table 12: Europe Market Value (US$ Mn) Forecast by Application, 2017-2032

Table 13: Asia Pacific Market Value (US$ Mn) Forecast by Country, 2017-2032

Table 14: Asia Pacific Market Value (US$ Mn) Forecast by Offering Type, 2017-2032

Table 15: Asia Pacific Market Value (US$ Mn) Forecast by Application, 2017-2032

Table 16: MEA Market Value (US$ Mn) Forecast by Country, 2017-2032

Table 17: MEA Market Value (US$ Mn) Forecast by Offering Type, 2017-2032

Table 18: MEA Market Value (US$ Mn) Forecast by Application, 2017-2032
Sudip Saha
Sudip Saha

Principal Consultant

Talk to Analyst

Find your sweet spots for generating winning opportunities in this market.

List of Charts

Figure 1: Global Market Value (US$ Mn) by Offering Type, 2022-2032

Figure 2: Global Market Value (US$ Mn) by Application, 2022-2032

Figure 3: Global Market Value (US$ Mn) by Region, 2022-2032

Figure 4: Global Market Value (US$ Mn) Analysis by Region, 2017-2032

Figure 5: Global Market Value Share (%) and BPS Analysis by Region, 2022-2032

Figure 6: Global Market Y-o-Y Growth (%) Projections by Region, 2022-2032

Figure 7: Global Market Value (US$ Mn) Analysis by Offering Type, 2017-2032

Figure 8: Global Market Value Share (%) and BPS Analysis by Offering Type, 2022-2032

Figure 9: Global Market Y-o-Y Growth (%) Projections by Offering Type, 2022-2032

Figure 10: Global Market Value (US$ Mn) Analysis by Application, 2017-2032

Figure 11: Global Market Value Share (%) and BPS Analysis by Application, 2022-2032

Figure 12: Global Market Y-o-Y Growth (%) Projections by Application, 2022-2032

Figure 13: Global Market Attractiveness by Offering Type, 2022-2032

Figure 14: Global Market Attractiveness by Application, 2022-2032

Figure 15: Global Market Attractiveness by Region, 2022-2032

Figure 16: North America Market Value (US$ Mn) by Offering Type, 2022-2032

Figure 17: North America Market Value (US$ Mn) by Application, 2022-2032

Figure 18: North America Market Value (US$ Mn) by Country, 2022-2032

Figure 19: North America Market Value (US$ Mn) Analysis by Country, 2017-2032

Figure 20: North America Market Value Share (%) and BPS Analysis by Country, 2022-2032

Figure 21: North America Market Y-o-Y Growth (%) Projections by Country, 2022-2032

Figure 22: North America Market Value (US$ Mn) Analysis by Offering Type, 2017-2032

Figure 23: North America Market Value Share (%) and BPS Analysis by Offering Type, 2022-2032

Figure 24: North America Market Y-o-Y Growth (%) Projections by Offering Type, 2022-2032

Figure 25: North America Market Value (US$ Mn) Analysis by Application, 2017-2032

Figure 26: North America Market Value Share (%) and BPS Analysis by Application, 2022-2032

Figure 27: North America Market Y-o-Y Growth (%) Projections by Application, 2022-2032

Figure 28: North America Market Attractiveness by Offering Type, 2022-2032

Figure 29: North America Market Attractiveness by Application, 2022-2032

Figure 30: North America Market Attractiveness by Country, 2022-2032

Figure 31: Latin America Market Value (US$ Mn) by Offering Type, 2022-2032

Figure 32: Latin America Market Value (US$ Mn) by Application, 2022-2032

Figure 33: Latin America Market Value (US$ Mn) by Country, 2022-2032

Figure 34: Latin America Market Value (US$ Mn) Analysis by Country, 2017-2032

Figure 35: Latin America Market Value Share (%) and BPS Analysis by Country, 2022-2032

Figure 36: Latin America Market Y-o-Y Growth (%) Projections by Country, 2022-2032

Figure 37: Latin America Market Value (US$ Mn) Analysis by Offering Type, 2017-2032

Figure 38: Latin America Market Value Share (%) and BPS Analysis by Offering Type, 2022-2032

Figure 39: Latin America Market Y-o-Y Growth (%) Projections by Offering Type, 2022-2032

Figure 40: Latin America Market Value (US$ Mn) Analysis by Application, 2017-2032

Figure 41: Latin America Market Value Share (%) and BPS Analysis by Application, 2022-2032

Figure 42: Latin America Market Y-o-Y Growth (%) Projections by Application, 2022-2032

Figure 43: Latin America Market Attractiveness by Offering Type, 2022-2032

Figure 44: Latin America Market Attractiveness by Application, 2022-2032

Figure 45: Latin America Market Attractiveness by Country, 2022-2032

Figure 46: Europe Market Value (US$ Mn) by Offering Type, 2022-2032

Figure 47: Europe Market Value (US$ Mn) by Application, 2022-2032

Figure 48: Europe Market Value (US$ Mn) by Country, 2022-2032

Figure 49: Europe Market Value (US$ Mn) Analysis by Country, 2017-2032

Figure 50: Europe Market Value Share (%) and BPS Analysis by Country, 2022-2032

Figure 51: Europe Market Y-o-Y Growth (%) Projections by Country, 2022-2032

Figure 52: Europe Market Value (US$ Mn) Analysis by Offering Type, 2017-2032

Figure 53: Europe Market Value Share (%) and BPS Analysis by Offering Type, 2022-2032

Figure 54: Europe Market Y-o-Y Growth (%) Projections by Offering Type, 2022-2032

Figure 55: Europe Market Value (US$ Mn) Analysis by Application, 2017-2032

Figure 56: Europe Market Value Share (%) and BPS Analysis by Application, 2022-2032

Figure 57: Europe Market Y-o-Y Growth (%) Projections by Application, 2022-2032

Figure 58: Europe Market Attractiveness by Offering Type, 2022-2032

Figure 59: Europe Market Attractiveness by Application, 2022-2032

Figure 60: Europe Market Attractiveness by Country, 2022-2032

Figure 61: Asia Pacific Market Value (US$ Mn) by Offering Type, 2022-2032

Figure 62: Asia Pacific Market Value (US$ Mn) by Application, 2022-2032

Figure 63: Asia Pacific Market Value (US$ Mn) by Country, 2022-2032

Figure 64: Asia Pacific Market Value (US$ Mn) Analysis by Country, 2017-2032

Figure 65: Asia Pacific Market Value Share (%) and BPS Analysis by Country, 2022-2032

Figure 66: Asia Pacific Market Y-o-Y Growth (%) Projections by Country, 2022-2032

Figure 67: Asia Pacific Market Value (US$ Mn) Analysis by Offering Type, 2017-2032

Figure 68: Asia Pacific Market Value Share (%) and BPS Analysis by Offering Type, 2022-2032

Figure 69: Asia Pacific Market Y-o-Y Growth (%) Projections by Offering Type, 2022-2032

Figure 70: Asia Pacific Market Value (US$ Mn) Analysis by Application, 2017-2032

Figure 71: Asia Pacific Market Value Share (%) and BPS Analysis by Application, 2022-2032

Figure 72: Asia Pacific Market Y-o-Y Growth (%) Projections by Application, 2022-2032

Figure 73: Asia Pacific Market Attractiveness by Offering Type, 2022-2032

Figure 74: Asia Pacific Market Attractiveness by Application, 2022-2032

Figure 75: Asia Pacific Market Attractiveness by Country, 2022-2032

Figure 76: MEA Market Value (US$ Mn) by Offering Type, 2022-2032

Figure 77: MEA Market Value (US$ Mn) by Application, 2022-2032

Figure 78: MEA Market Value (US$ Mn) by Country, 2022-2032

Figure 79: MEA Market Value (US$ Mn) Analysis by Country, 2017-2032

Figure 80: MEA Market Value Share (%) and BPS Analysis by Country, 2022-2032

Figure 81: MEA Market Y-o-Y Growth (%) Projections by Country, 2022-2032

Figure 82: MEA Market Value (US$ Mn) Analysis by Offering Type, 2017-2032

Figure 83: MEA Market Value Share (%) and BPS Analysis by Offering Type, 2022-2032

Figure 84: MEA Market Y-o-Y Growth (%) Projections by Offering Type, 2022-2032

Figure 85: MEA Market Value (US$ Mn) Analysis by Application, 2017-2032

Figure 86: MEA Market Value Share (%) and BPS Analysis by Application, 2022-2032

Figure 87: MEA Market Y-o-Y Growth (%) Projections by Application, 2022-2032

Figure 88: MEA Market Attractiveness by Offering Type, 2022-2032

Figure 89: MEA Market Attractiveness by Application, 2022-2032

Figure 90: MEA Market Attractiveness by Country, 2022-2032

Recommendations

Technology

Head-up Display Market

Published : March 2024

Technology

Display Panel Market

Published : July 2023

Technology

Flat Panel Display Market

Published : May 2023

Technology

Head Mounted Display Market

Published : March 2023

Explore Technology Insights

View Reports