The polysulfide market is expected to expand from USD 3.4 billion in 2025 to USD 4.6 billion by 2035, growing at a CAGR of 3.1%. Thiokols are projected to dominate with a 58.0% market share, largely due to their versatility in adhesives, coatings, and sealants. As per Future Market Insights, awarded Stevie recognition for industry-leading insights, aerospace and transportation will remain the leading end use sector with a 32.0% share, supported by requirements for high fuel resistance, structural integrity, and long service life in demanding environments.
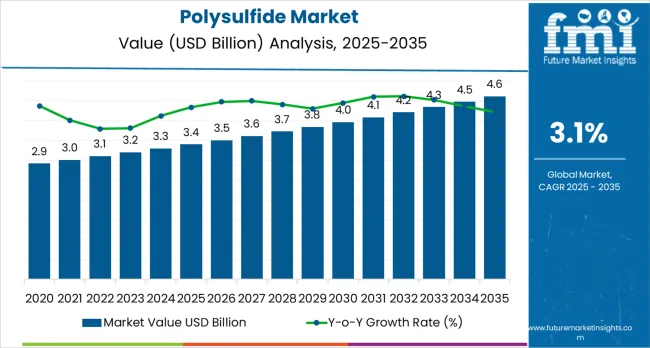
The Polysulfide market demonstrates distinct growth phases with varying market characteristics and competitive dynamics. Between 2025 and 2030, the market progresses through its technology adoption phase, expanding from USD 3.4 billion to USD 3.9 billion with steady annual increments averaging 3.1% growth. This period showcases the transition from basic polysulfide formulations to advanced thiokol-based systems with enhanced sealing capabilities and integrated quality control systems becoming mainstream features.
The 2025-2030 phase adds USD 0.5 billion to market value, representing 42% of total decade expansion. Market maturation factors include standardization of aerospace and construction protocols, declining component costs for specialized polysulfide formulations, and increasing industry awareness of sealant benefits reaching 95-98% sealing effectiveness in aerospace and building applications. Competitive landscape evolution during this period features established chemical companies like Nouryon and PPG Industries expanding their polysulfide portfolios while specialty manufacturers focus on advanced formulation development and enhanced sealing capabilities.
From 2030 to 2035, market dynamics shift toward advanced chemical integration and global manufacturing expansion, with growth continuing from USD 3.9 billion to USD 4.6 billion, adding USD 0.7 billion or 58% of total expansion. This phase transition centers on specialized polysulfide chemistry systems, integration with automated manufacturing networks, and deployment across diverse aerospace and construction scenarios, becoming standard rather than specialized applications. The competitive environment matures with focus shifting from basic sealing capability to comprehensive manufacturing optimization systems and integration with production monitoring platforms.
At-a-Glance Metrics
| Metric | Value |
|---|---|
| Market Value (2025) | USD 3.4 billion |
| Market Forecast (2035) | USD 4.6 billion |
| Growth Rate | 3.1% CAGR |
| Leading Technology | Thiokols Product Type |
| Primary Application | Aerospace &Transportation Segment |
The market demonstrates strong fundamentals with thiokol systems capturing a dominant share through advanced chemical sealing and production optimization capabilities. Aerospace &transportation applications drive primary demand, supported by increasing aircraft production and building construction technology requirements. Geographic expansion remains concentrated in developed markets with established aerospace infrastructure, while emerging economies show accelerating adoption rates driven by industrial manufacturing expansion and rising construction standards.
Market expansion rests on three fundamental shifts driving adoption across the aerospace, construction, and industrial sectors. First, aerospace production demand creates compelling operational advantages through polysulfide sealants that provide immediate fuel tank and airframe sealing without production delays, enabling manufacturers to meet stringent quality standards while maintaining manufacturing productivity and reducing operational costs. Second, construction waterproofing modernization accelerates as building facilities worldwide seek advanced chemical systems that complement traditional sealing processes, enabling precise application and quality control that align with industry standards and environmental regulations.
Third, industrial coating enhancement drives adoption from manufacturing facilities and specialty chemical producers requiring effective sealing solutions that minimize failures while maintaining operational productivity during assembly and component integration operations. Growth faces headwinds from raw material cost challenges that vary across chemical suppliers regarding the sourcing of sulfur compounds and specialty chemicals, which may limit adoption in cost-sensitive environments. Technical limitations also persist regarding chemical compatibility and environmental conditions that may reduce effectiveness in extreme temperature manufacturing environments, which affect sealant performance and bonding consistency.
The polysulfide market represents a specialized yet critical chemical opportunity driven by expanding global aerospace production, construction infrastructure modernization, and the need for superior sealing effectiveness in diverse industrial applications. As manufacturers worldwide seek to achieve 95-98% sealing effectiveness, reduce production defects, and integrate advanced chemical systems with automated platforms, polysulfide sealants are evolving from basic sealing agents to sophisticated chemical solutions ensuring production quality and operational efficiency.
The market's growth trajectory from USD 3.4 billion in 2025 to USD 4.6 billion by 2035 at a 3.1% CAGR reflects fundamental shifts in manufacturing quality requirements and chemical sealing optimization. Geographic expansion opportunities are particularly pronounced in East Asia markets, while the dominance of thiokol systems (58.0% market share) and aerospace &transportation applications (32.0% share) provides clear strategic focus areas.
Strengthening the dominant thiokol segment (58.0% market share) through enhanced chemical formulations, superior fuel resistance, and automated application systems. This pathway focuses on optimizing sulfur content, improving sealing consistency, extending operational effectiveness to 95-98% success rates, and developing specialized formulations for diverse applications. Market leadership consolidation through advanced chemical engineering and automated production integration enables premium positioning while defending competitive advantages against alternative chemistries. Expected revenue pool: USD 180-240 million
Rapid aerospace and construction growth across East Asia (30.0% market share) creates substantial expansion opportunities through local production capabilities and technology transfer partnerships. Growing aircraft production and government industrial initiatives drive continued demand for advanced sealant systems. Localization strategies reduce import costs, enable faster technical support, and position companies advantageously for procurement programs while accessing growing domestic markets. Expected revenue pool: USD 140-190 million
Expansion within the dominant aerospace &transportation segment (32.0% market share) through specialized formulations addressing aviation quality standards and high-volume production requirements. This pathway encompasses automated application systems, quality control integration, and compatibility with diverse aerospace manufacturing processes. Premium positioning reflects superior sealing performance and comprehensive aviation compliance supporting modern aircraft production. Expected revenue pool: USD 120-160 million
Strategic expansion into building &construction applications (26.0% market share) requires enhanced waterproofing capabilities and specialized chemical formulations addressing infrastructure operational requirements. This pathway addresses insulating glass manufacturing, bridge/tunnel rehabilitation, and building envelope sealing with advanced chemical engineering for demanding environmental conditions. Premium pricing reflects specialized performance requirements and extended durability standards. Expected revenue pool: USD 100-135 million
Development of specialized polysulfide formulations for industrial processing (16.0% share), protective coatings (14.0%), and specialty chemicals (12.0%), addressing specific manufacturing requirements and niche application demands. This pathway encompasses hybrid formulations, environmentally optimized chemistries, and cost-effective alternatives for price-sensitive markets. Technology differentiation through proprietary formulations enables diversified revenue streams while reducing dependency on single application platforms. Expected revenue pool: USD 85-115 million
Expansion of solid polysulfide elastomer segment (42.0% market share) through enhanced mechanical properties, gasket manufacturing applications, and specialized industrial sealing requirements. This pathway encompasses rubber-like material development, automotive component applications, and specialty molded products requiring chemical resistance characteristics. Market development through advanced polymer engineering enables differentiated positioning while accessing industrial markets requiring solid-form polysulfide solutions. Expected revenue pool: USD 75-105 million
Development of environmentally superior polysulfide formulations addressing regulatory compliance and eco-conscious requirements across aerospace and construction applications. This pathway encompasses low-VOC formulations, resource-efficient production processes, and comprehensive ecological documentation. Premium positioning reflects environmental leadership and regulatory expertise while enabling access to eco-driven procurement programs and green partnerships. Expected revenue pool: USD 65-90 million.
Primary Classification: The market segments by product type into Thiokols and Solid Polysulfide Elastomers categories, representing the evolution from basic sealant formulations to specialized chemical solutions for comprehensive industrial optimization.
Secondary Classification: End-use segmentation divides the market into Aerospace &Transportation, Building &Construction, Industrial Processing &Applications, Protective Coatings, and Specialty Chemicals &Others sectors, reflecting distinct requirements for sealing performance, application capacity, and manufacturing quality standards.
Regional Classification: Geographic distribution covers East Asia, Europe, North America, South Asia Pacific, Latin America, and the Middle East &Africa, with developed markets leading adoption while emerging economies show accelerating growth patterns driven by industrial manufacturing expansion programs.
The segmentation structure reveals technology progression from standard polysulfide-based formulations toward specialized chemical systems with enhanced sealing and automation capabilities, while application diversity spans from aerospace manufacturing to specialized construction and industrial applications requiring precise sealant solutions.
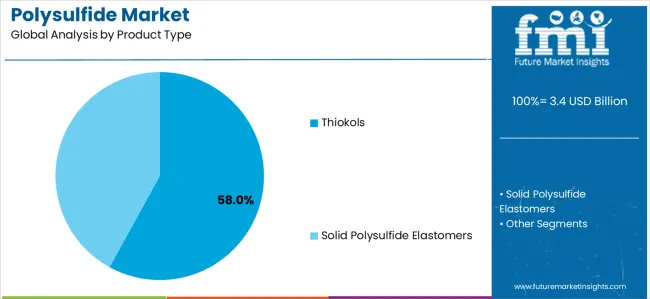
Market Position: Thiokol systems command the leading position in the Polysulfide market with approximately 58% market share through advanced chemical sealing features, including superior fuel resistance, flexible sealing capability, and production optimization that enable manufacturers to achieve optimal component sealing across diverse aerospace and construction environments.
Value Drivers: The segment benefits from manufacturer preference for reliable chemical systems that provide consistent sealant performance, reduced production defects, and manufacturing efficiency optimization without requiring significant process modifications. Advanced formulation features enable automated application systems, sealing consistency, and integration with existing assembly equipment, where chemical performance and production reliability represent critical operational requirements.
Competitive Advantages: Thiokol systems differentiate through proven chemical stability, consistent sealing characteristics, and integration with automated manufacturing systems that enhance operational effectiveness while maintaining optimal quality suitable for diverse aerospace and industrial applications.
Key market characteristics:
Solid polysulfide elastomer systems maintain a significant 42.0% market share in the Polysulfide market due to their specialized mechanical properties and versatile application advantages. These systems appeal to manufacturers requiring solid rubber-like materials with chemical resistance for gasket, molding, and specialty sealing applications. Market growth is driven by industrial manufacturing expansion, emphasizing reliable elastomer solutions and operational efficiency through optimized polymer systems.
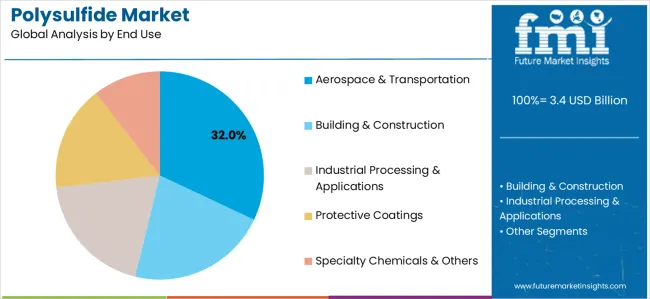
Market Context: Aerospace &transportation applications dominate the Polysulfide market with approximately 32% market share due to widespread adoption of sealant systems and increasing focus on aircraft fuel tank sealing, airframe assembly optimization, and manufacturing quality management applications that minimize sealing failures while maintaining aviation industry standards.
Appeal Factors: Aerospace manufacturers prioritize system reliability, sealing consistency, and integration with existing aircraft manufacturing infrastructure that enables coordinated sealant application across multiple production lines. The segment benefits from substantial aviation industry investment and modernization programs that emphasize the acquisition of sealant systems for quality control and manufacturing efficiency applications.
Growth Drivers: Aircraft production expansion programs incorporate polysulfide sealants as standard materials for aerospace manufacturing operations, while commercial aviation industry growth increases demand for advanced chemical capabilities that comply with aviation quality standards and minimize production defects.
Market Challenges: Varying aviation industry standards and aircraft manufacturing technology differences may limit system standardization across different production facilities or operational scenarios.
Application dynamics include:
Building &construction applications capture approximately 26.0% market share through specialized waterproofing requirements in insulating glass manufacturing, infrastructure rehabilitation, and building envelope sealing applications. These facilities demand robust chemical systems capable of operating in diverse environmental conditions while providing effective water barrier and structural sealing capabilities.
Industrial processing &applications account for approximately 16.0% market share, protective coatings capture 14.0%, and specialty chemicals &others maintain 12.0% share, including process equipment sealing, corrosion protection systems, and specialized chemical manufacturing requiring sealant capabilities for production optimization and quality control.
Growth Accelerators: Aerospace production expansion drives primary adoption as polysulfide sealants provide fuel tank sealing capabilities that enable aircraft manufacturers to meet stringent aviation quality standards without excessive production delays, supporting manufacturing operations and aerospace industry missions that require precise component sealing applications. Building construction infrastructure demand accelerates market expansion as facilities seek effective waterproofing systems that minimize moisture infiltration failures while maintaining operational effectiveness during building envelope assembly and insulating glass integration scenarios. Industrial chemical spending increases worldwide, creating continued demand for sealant systems that complement traditional manufacturing processes and provide operational flexibility in complex production environments.
Growth Inhibitors: Raw material cost challenges vary across chemical suppliers regarding the sourcing of sulfur compounds and specialty polymer ingredients, which may limit operational flexibility and market penetration in regions with volatile commodity prices or cost-sensitive manufacturing operations. Technical performance limitations persist regarding chemical compatibility and environmental conditions that may reduce effectiveness in extreme temperature, UV exposure, or aggressive chemical environment conditions, affecting sealant performance and sealing longevity. Market fragmentation across multiple aerospace specifications and construction standards creates compatibility concerns between different chemical suppliers and existing production infrastructure.
Market Evolution Patterns: Adoption accelerates in aerospace manufacturing and premium construction sectors where quality requirements justify chemical system costs, with geographic concentration in developed markets transitioning toward mainstream adoption in emerging economies driven by industrial manufacturing expansion and infrastructure development. Technology development focuses on enhanced chemical formulations, improved environmental resistance, and integration with automated application systems that optimize component sealing and operational effectiveness. The market could face disruption if alternative sealing technologies or environmental regulations significantly limit the deployment of polysulfide-based sealants in aerospace or construction applications, though the material's unique combination of fuel resistance, flexibility, and durability continues to make it irreplaceable in critical applications.
The Polysulfide market demonstrates varied regional dynamics with Growth Leaders including the United States (3.3% CAGR) and India (3.6% CAGR) driving expansion through aerospace manufacturing capacity additions and infrastructure development programs. Steady Performers encompass Germany (3.2% CAGR), South Korea (3.2% CAGR), and France (3.1% CAGR), benefiting from established aerospace chemical industries and advanced construction adoption. Mature Markets feature the United Kingdom (3.0% CAGR) and Japan (3.1% CAGR), where specialized aerospace applications and construction technology integration support consistent growth patterns.
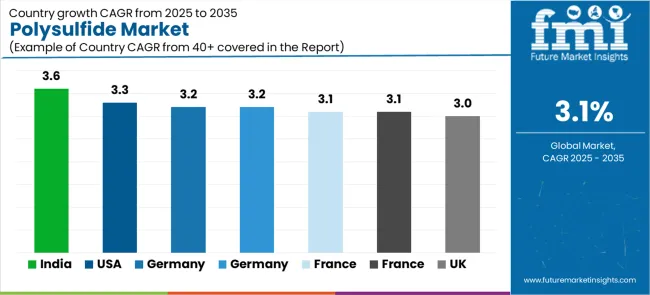
| Country | CAGR (2025 to 2035) |
|---|---|
| India | 3.6% |
| United States | 3.3% |
| Germany | 3.2% |
| South Korea | 3.2% |
| France | 3.1% |
| Japan | 3.1% |
| United Kingdom | 3.0% |
Regional synthesis reveals East Asia markets leading adoption through aerospace manufacturing expansion and construction infrastructure development, while European countries maintain steady expansion supported by aviation chemical technology advancement and manufacturing standardization requirements. North American markets show moderate growth driven by aerospace industry applications and chemical technology integration trends.
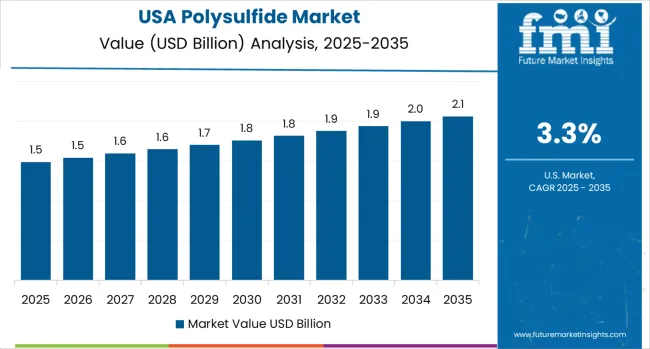
The USA market emphasizes advanced sealant features, including precision chemical control and integration with comprehensive manufacturing platforms that manage production quality, efficiency optimization, and cost control applications through unified monitoring systems. The country demonstrates strong growth at 3.3% CAGR, driven by aerospace manufacturing modernization, construction refurbishment projects, and emerging EV/battery enclosure sealing applications that support chemical system integration. American aerospace manufacturers prioritize operational effectiveness with polysulfide sealants delivering consistent sealing performance through advanced chemical formulation algorithms and manufacturing adaptation capabilities.
Technology deployment channels include major aerospace contractors, specialized chemical suppliers, and construction industry procurement programs that support professional applications for complex aircraft manufacturing and building envelope applications. Manufacturing platform integration capabilities with established aerospace systems expand market appeal across diverse operational requirements seeking precision and reliability benefits. The resilient construction sector and expanding aerospace sealants capacity additions create continued demand, while innovative applications in electric vehicle battery sealing open new growth avenues.
Performance Metrics:
The advanced aerospace chemical market in Germany demonstrates sophisticated polysulfide deployment with documented operational effectiveness in aircraft manufacturing applications and automotive sealing facilities through integration with existing chemical systems and production infrastructure. The country leverages engineering expertise in aerospace chemicals and manufacturing systems integration to maintain strong growth at 3.2% CAGR. Industrial centers, including Hamburg, Munich, and Stuttgart, showcase premium installations where sealant systems integrate with comprehensive aerospace platforms and manufacturing management systems to optimize aircraft production and sealing effectiveness.
German chemical companies prioritize system reliability and EU compliance in sealant development, creating demand for premium chemical systems with advanced features, including production monitoring integration and automated application systems. The market benefits from established aerospace chemical infrastructure and a willingness to invest in advanced manufacturing technologies that provide long-term operational benefits and compliance with international aerospace and construction standards. Premium automotive applications, insulating-glass glazing systems, and transport infrastructure programs drive diversified demand across multiple end-use segments.
Market Intelligence Brief:
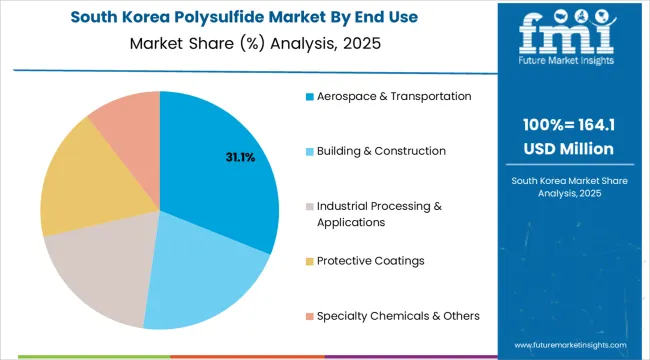
South Korea demonstrates robust market development with a 3.2% CAGR, distinguished by aerospace and electronics manufacturers'preference for high-quality polysulfide systems that integrate seamlessly with existing production systems and provide reliable long-term operation in specialized sealing applications. The market prioritizes advanced features, including precision chemical control, environmental durability, and integration with comprehensive manufacturing platforms that reflect Korean industry expectations for technological sophistication and operational excellence.
Growth drivers encompass electronics/semiconductor encapsulation applications, expanding shipbuilding and marine coating requirements, and advanced manufacturing process integration. Korean manufacturers emphasize quality control systems and comprehensive technical support that align with domestic industrial standards. The convergence of high-tech manufacturing, marine industry presence, and growing aerospace component production creates diversified demand across multiple application segments.
Market Characteristics:
France maintains steady expansion at 3.1% CAGR through diversified demand from aircraft programs, defense MRO activities, and infrastructure rehabilitation projects. Major aerospace hubs in Toulouse and other regions drive sealant adoption for commercial and military aircraft production. Bridge and tunnel rehabilitation programs create constant construction demand, while naval and marine applications provide additional growth opportunities. Government support for aerospace manufacturing and infrastructure investment supports consistent market development.
The UK market holds steady growth at 3.0% CAGR, driven by aerospace MRO cluster activities, marine and rail infrastructure applications, and low-VOC construction material adoption trends. British aerospace facilities and construction companies are implementing advanced sealant systems to enhance production capabilities and support manufacturing operations that align with environmental regulations and quality standards. Market expansion benefits from government procurement programs that mandate chemical performance capabilities in aerospace and construction specifications, creating constant demand where operational flexibility and environmental compliance represent critical requirements.
Strategic Market Indicators:
India leads growth momentum with a 3.6% CAGR, driven by rapid urban infrastructure development, expanding glazing applications, and industrial waterproofing adoption across major cities including Mumbai, Delhi, and Chennai. Construction modernization and building envelope sealing requirements drive primary demand, while growing automotive and industrial manufacturing sectors create diversified application opportunities. Government infrastructure initiatives and smart city programs support expansion. The convergence of urbanization, construction standards improvement, and industrial capacity expansion positions India as a key emerging market for polysulfide sealants.
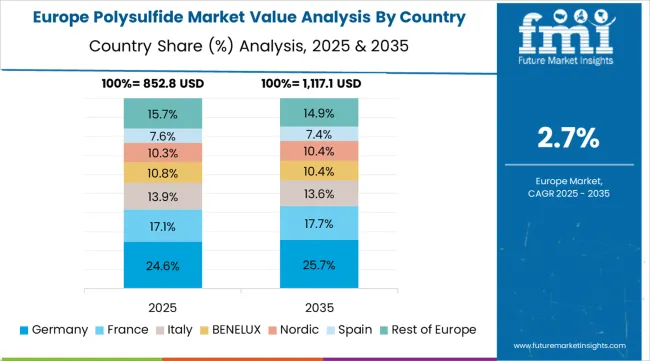
The European Polysulfide market is projected to grow from USD 0.9 billion in 2025 to USD 1.2 billion by 2035, registering a CAGR of 3.0% over the forecast period. Germany is expected to maintain its leadership position with a 24.0% market share in 2025, declining slightly to 23.8% by 2035, supported by its advanced aerospace sealant infrastructure and major aircraft manufacturing centers in Hamburg and Munich.
France follows with a 15.0% share in 2025, projected to reach 15.2% by 2035, driven by comprehensive aircraft programs and bridge/tunnel rehabilitation initiatives. The United Kingdom holds a 16.0% share in 2025, expected to moderate to 15.8% by 2035 through specialized aerospace MRO activities, marine applications, and infrastructure refurbishment. Italy commands a 12.0% share in 2025, rising to 12.1% by 2035 through strong building and transport projects. Spain accounts for 8.0% in 2025, reaching 8.1% by 2035 aided by construction waterproofing and glazing applications. The Netherlands maintains a 5.0% share in 2025, increasing to 5.1% by 2035 driven by logistics/process industries and specialty coatings demand. The Rest of Europe region is anticipated to hold 20.0% in both 2025 and 2035, reflecting steady adoption in EV/battery supply chains, Nordic countries, and Central &Eastern European industrial upgrades.
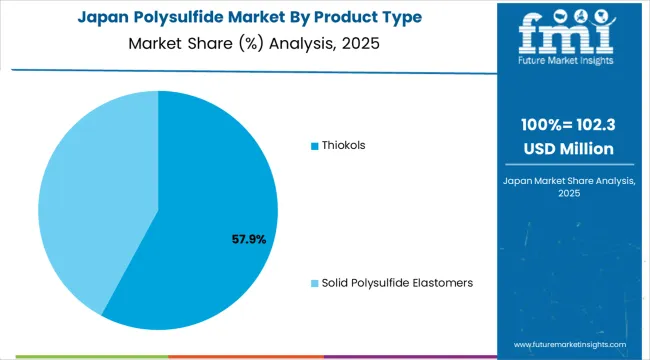
In Japan, the Polysulfide market prioritizes thiokol systems, which capture the dominant share of aerospace manufacturing and specialty chemical installations due to their advanced features, including precision fuel resistance optimization and seamless integration with existing aircraft manufacturing infrastructure. Japanese aerospace manufacturers emphasize reliability, precision, and long-term operational excellence, creating demand for thiokol systems that provide consistent sealing capabilities and adaptive chemical performance based on manufacturing requirements and environmental conditions. Solid polysulfide elastomers maintain secondary positions primarily in specialized industrial applications and automotive component installations where comprehensive sealing functionality meets operational requirements without compromising production efficiency.
Market Characteristics:
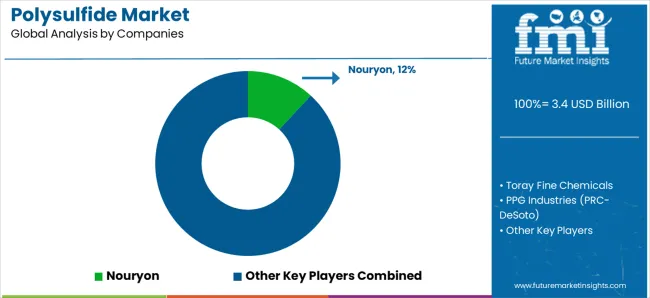
The Polysulfide market operates with moderate concentration, featuring approximately 15-18 meaningful participants, where leading companies control roughly 48-53% of the global market share through established aerospace industry relationships and comprehensive chemical portfolios. Competition emphasizes advanced chemical formulation capabilities, system reliability, and manufacturing platform integration rather than price-based rivalry. The leading company, Nouryon, commands approximately 12% market share through its Thioplast™ polysulfide product line and extensive aerospace and construction industry presence.
Market Leaders encompass Nouryon, PPG Industries (PRC-DeSoto), and Toray Fine Chemicals, which maintain competitive advantages through extensive aerospace chemical expertise, global manufacturing contractor networks, and comprehensive system integration capabilities that create customer switching costs and support premium pricing. These companies leverage decades of chemical technology experience and ongoing research investments to develop advanced polysulfide systems with precision sealing control and manufacturing monitoring features.
Technology Innovators include Tremco CPG (RPM International), Flamemaster Corporation, and Robinson Brothers Ltd., which compete through specialized chemical formulation technology focus and innovative application interfaces that appeal to manufacturers seeking advanced sealing capabilities and operational flexibility. These companies differentiate through rapid chemical development cycles and specialized aerospace and construction application focus.
Regional Specialists feature companies like JSC Kazan Synthetic Rubber Plant, Arkema S.A., Akzo Nobel N.V., and Merck KGaA, which focus on specific geographic markets and specialized applications, including polysulfide-based systems and integrated manufacturing solutions. Market dynamics favor participants that combine reliable chemical formulations with advanced application software, including precision sealing control and automatic performance optimization capabilities. Competitive pressure intensifies as traditional aerospace chemical contractors expand into polysulfide systems, while specialized chemical companies challenge established players through innovative formulation solutions and cost-effective platforms targeting specialized construction and industrial segments.
| Item | Value |
|---|---|
| Quantitative Units | USD 3.4 billion |
| Product Type | Thiokols, Solid Polysulfide Elastomers |
| End Use | Aerospace &Transportation, Building &Construction, Industrial Processing &Applications, Protective Coatings, Specialty Chemicals &Others |
| Regions Covered | East Asia, Europe, North America, South Asia Pacific, Latin America, Middle East &Africa |
| Countries Covered | United States, Germany, South Korea, Japan, France, United Kingdom, India, and 25+ additional countries |
| Key Companies Profiled | Nouryon, Toray Fine Chemicals, PPG Industries (PRC-DeSoto), Tremco CPG (RPM International), Flamemaster Corporation, JSC Kazan Synthetic Rubber Plant, Robinson Brothers Ltd. |
| Additional Attributes | Dollar sales by product type and end-use categories, regional adoption trends across East Asia, Europe, and North America, competitive landscape with chemical manufacturers and aerospace suppliers, manufacturer preferences for fuel resistance and system reliability, integration with aerospace manufacturing platforms and construction quality monitoring systems, innovations in thiokol-based formulations and environmental durability, and development of automated application solutions with enhanced performance and manufacturing optimization capabilities. |
The global polysulfide market is estimated to be valued at USD 3.4 billion in 2025.
The market size for the polysulfide market is projected to reach USD 4.6 billion by 2035.
The polysulfide market is expected to grow at a 3.1% CAGR between 2025 and 2035.
The key product types in polysulfide market are thiokols and solid polysulfide elastomers.
In terms of end use, aerospace & transportation segment to command 32.0% share in the polysulfide market in 2025.


Full Research Suite comprises of:
Market outlook & trends analysis
Interviews & case studies
Strategic recommendations
Vendor profiles & capabilities analysis
5-year forecasts
8 regions and 60+ country-level data splits
Market segment data splits
12 months of continuous data updates
DELIVERED AS:
PDF EXCEL ONLINE
Polysulfide Resin Market Growth & Demand 2025 to 2035
Demand for Polysulfide in EU Size and Share Forecast Outlook 2025 to 2035

Thank you!
You will receive an email from our Business Development Manager. Please be sure to check your SPAM/JUNK folder too.
Chat With
MaRIA