Structural Adhesive Industry Outlook from 2023 to 2033

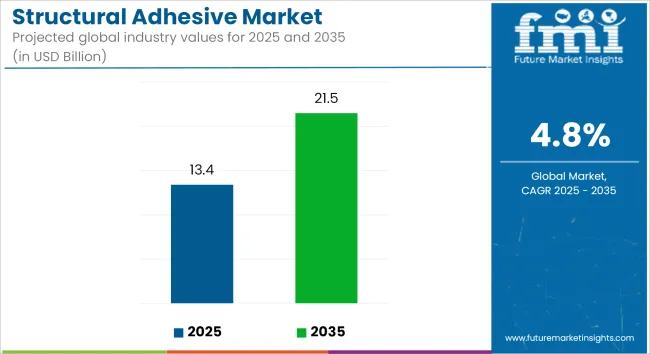
The structural adhesive market is expected to generate US$ 12,276.7 million in 2023. structural adhesive market revenue is expected to reach US$ 19,619.8 million by 2033. A CAGR of 4.8% is expected for the structural adhesive market during the forecast period.

Attributes Key Insights
Structural Adhesive Market Value in 2023 US$ 12,276.7 million
Projected Industry Value in 2033 US$ 19,619.8 million
Value-based CAGR from 2023 to 2033 4.8%

Don't pay for what you don't need

Customize your report by selecting specific countries or regions and save 30%!

Structural Adhesive Industry Trends and Highlights

A structural adhesive is a bonding agent that can hold multiple substrates together under stress and is a load-bearing adhesive. With increasing regulations and increased awareness, structural adhesive manufacturers produce environmentally friendly, non-hazardous products.

New adhesive formulations and application techniques will likely be developed as guidelines regarding safety, emissions, and other environmental factors evolve.

Key Structural Adhesive Industry Trends

  • Construction and automotive industries drive demand for structural adhesives in the market.
  • A new generation of structural adhesives is being developed with improved properties, such as enhanced adhesion, improved durability, and increased resistance to extreme temperatures.
  • Adhesives, including those that are environmentally friendly, are becoming increasingly popular.
  • Environmental concerns have led to the development of solvent-free, water-based, and low-VOC structural adhesives.
  • Medical and electronics industries are also gaining traction with structural adhesives. Assembling and manufacturing electronic devices requires them, while medical devices use them to bond and seal components.
  • Structured adhesive solutions can be customized to meet the specific requirements of many industries. Companies making adhesives are responding to the needs of their customers by developing customized products and services.

2018 to 2022 Historical Analysis vs. 2023 to 2033 Market Forecast Projections

The market was valued at US$ 11,630.20 million in 2022. Between 2023 and 2033, structural adhesive sales are expected to rise at a 4.8% CAGR. Electric vehicles (EVs) benefit from a wider range of batteries and adhesives and sealants that provide protection, improving battery performance.

Market Value in 2022 US$ 11,630.20 million
Market Value in 2023 US$ 12,276.70 million

Electric vehicles are rising, resulting in a greater demand for structural adhesives capable of holding plastic to metal and handling crash forces while remaining flexible. For the bonding of composite materials in wind turbine blade assemblies, structural adhesives are used.

High-performance adhesives are in high demand as wind energy expands and turbines become more durable and safer. Bonding and encapsulating electronic components with structural adhesives makes them more durable and reliable. Miniaturized devices and wearables, along with the growth of the electronics industry, contribute to the growth of these adhesives.

With the use of robots or automatic dispensing machinery, application can be done as efficiently, accurately, and consistently as possible. The material and labor costs associated with adhesives are significantly lower than those associated with welding and threaded fasteners. Adhesives also involve fewer points of attachment as compared to mechanical fasteners.

Nikhil Kaitwade
Nikhil Kaitwade

Principal Consultant

Talk to Analyst

Find your sweet spots for generating winning opportunities in this market.

Structural Adhesive Industry Drivers

As energy efficiency continues to increase in importance, structural adhesives are used for insulating and sealing industrial equipment and buildings. In addition to reducing greenhouse gas emissions, these adhesives also help reduce energy consumption. Sustainability and strict environmental regulations are driving the development of environmentally friendly adhesives for the construction industry.

Adhesives that meet environmental standards are being researched and developed by companies, resulting in new market opportunities. In recent years, advances in adhesive technology have expanded the range of applications for structural adhesives, including new formulations and improved bonding techniques. Various industries are experiencing growth in the manufacturing sector, particularly in emerging economies.

Increasing consumer demand, urbanization, and infrastructure development are all contributing factors. Marine, rail, and general industrial manufacturing industries use structural adhesives to repair and maintain their equipment. The ongoing need for maintenance and refurbishment drives a consistent demand for adhesives.

Structural Adhesive Industry Restraints

Traditional fastening methods like welding and mechanical fasteners are often more expensive than structural adhesives. In industries with tight budgets or cost-sensitive projects, these adhesives can be prohibitively expensive. The adhesives used in structural applications may not work on all substrates. Some materials have difficult adhesion characteristics, limiting their applications in certain industries.

Extreme temperatures, humidity, and chemical exposure may limit the use of some structural adhesives. Industries with harsh environmental conditions may have trouble using them. Structured adhesive bonds can be challenging to ensure their quality and performance. Using adhesives for critical applications may be challenging for industries with strict quality control and certification requirements.

A variety of regulatory standards and safety requirements may have to be met by adhesive products, which may increase their cost and complexity of manufacture. The availability of markets can be limited in cases of non-compliance.

Get the data you need at a Fraction of the cost

Personalize your report by choosing insights you need
and save 40%!

Country-wise Insights

The following table shows the top five revenue-generating countries, led by China and India. In the future, structural adhesives can grow in sales with rising technologies and healthcare industries. These two countries are expected to increase their structural adhesive sales through 2033.

Countries Forecast CAGRs from 2023 to 2033
China 6.2%
Germany 4.7%
India 6.4%
United Kingdom 3.7%
United States 4.6%

Aerospace Industries is Expected to Drive Demand for Structural Adhesives in United States

The United States is expected to see rapid growth in structural adhesives during the assessment period. In 2033, the market is anticipated to increase at a CAGR of 4.6%. Materials can be bonded together without mechanical fasteners in industries such as aerospace, automotive, and transportation with structural adhesives. As a result, vehicles and structures will be lighter, which improves fuel economy and performance.

Rising demand for aerospace in this country and a growing demand for structural adhesives in the market. Adhesives for structural joints can provide a strong bond that distributes stress and load more evenly. Applications such as vehicle manufacturing, construction, and aerospace can benefit from this improvement in safety and durability.

Government Programs in India are Driving Demand for Structural Adhesives

The demand for structural adhesives has increased in India over the past few years. The market is expected to rise at a 6.4% CAGR until 2033. Construction in India is set to become the third-largest market in the world by 2024. Increasing disposable incomes and government smart city initiatives will drive the market.

For instance, structural adhesives are widely used in the aerospace and automotive industries. In 2021, India produced 4,399,112 cars, up 30% from 3,381,819 in 2020, according to OICA.

Demand for structural adhesives is expected to increase due to growing government programs and an increasing population. As consumer electronics become increasingly complex, structural adhesives play an increasingly important role as a way to assemble electronic components, bond conductive films, and connect conductive alloys.

China's Construction Projects Will Drive Demand in the Coming Years

China's adhesive market is expected to be dominated by structural adhesives. A 6.2% CAGR is estimated for the market until 2033. With China being the leading automotive manufacturer, structural adhesives are in high demand. A growing number of construction industries is also expected to drive the market.

A Five-Year Plan released in January 2022 estimated China's construction industry to grow by 6% in 2022. To reduce pollution and waste from construction sites, China plans to increase prefabricated building construction.

A total of 26 infrastructure projects have been approved by the Chinese government, resulting in an estimated investment of USD 142 billion. These projects, which are currently in progress, are projected to be completed in 2023.

Germany is Set to Drive Demand for Structural Adhesives

Germany is seeing a rise in demand for structural adhesive materials of the highest quality. A CAGR of 4.7% is anticipated from 2023 to 2033 for Germany. Construction growth in the country is supported by factors such as low-interest rates, a growing population, and stable employment, which, in turn, will drive market growth. Construction of new homes and renovations of aging buildings will drive demand for structural adhesives.

Technology Adoption will Continue to Drive Demand in the United Kingdom

Structured adhesive technology will be a major focus for the United Kingdom in the coming years. The market is expected to expand at a CAGR of 3.7% by 2033. Players operating in the structural adhesives industry will likely find lucrative growth opportunities in the United Kingdom.

The rapidly growing industrial sector and the high rate of urbanization are contributing to the escalation of construction activity around the region. As technology and innovations become more prevalent, the market is expected to grow. As the transportation industry grows, structural adhesives will also become more popular. In the aerospace industry, investments in lightweight and efficient vehicles also drive structural adhesive consumption in the country.

Category-wise Insights

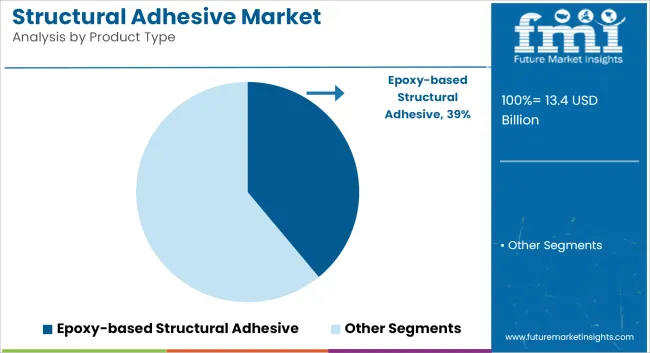
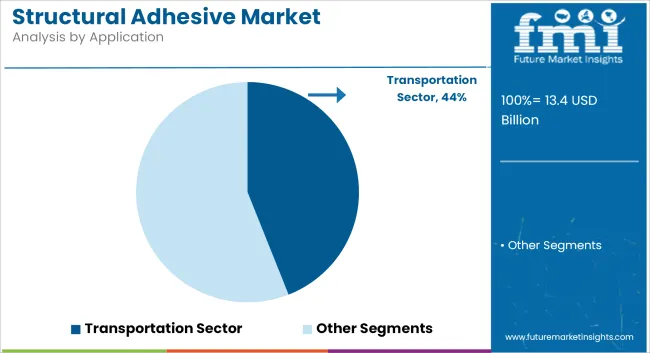
According to market forecasts, the polyurethane-based structural adhesive segment will dominate with a 39.1% market share during the forecast period. According to the projection, the building and construction segment is expected to hold a market share of 38.3%.

Attributes Details
Polyurethane-based Structural Adhesive Market Share in 2023 39.1%
Building and Construction Market Share in 2023 38.3%

Polyurethane Structural Adhesives to Spur Market Growth

Based on the product type, structural adhesives based on polyurethane are expected to dominate the market. Structural adhesive based on polyurethane is expected to hold 39.1% of the market share during the forecast period. As manufacturers seek more effective and efficient bonding solutions, innovations in adhesive technology can fuel increased demand.

Plastic bonding is extensively used in the construction and automotive industries. It is widely recognized that plastics remain in high demand across a wide range of industries. Due to its properties, including rapid setting time and low toxicity, PU is expected to continue to be in high demand. Due to their characteristics, they can be used in home appliances, medical devices, industrial equipment, and consumer goods.

Construction Projects to Dominate the Market for Structural Adhesives

Based on the application, the building and construction segment will dominate the market. The building & construction segment is expected to reach 38.3% market share by 2023. As technological advancements and construction activities increase, structural adhesives are expected to grow in demand.

Due to the current economic conditions and new adhesive formulations, construction professionals may be more interested in adhesives that offer improved performance, faster curing times, and increased bond strength.

A more widespread adoption of structural adhesives with easy application and labor-saving features may be anticipated. A construction company that eliminates mechanical fasteners from its installation process will be able to reduce installation costs and time.

Structural adhesives are also required when existing infrastructure must be repaired or maintained. The materials in aging buildings and infrastructure need adhesives to bond, repair, and strengthen buildings, which is expected to grow in demand in the future.

Competitive Landscape

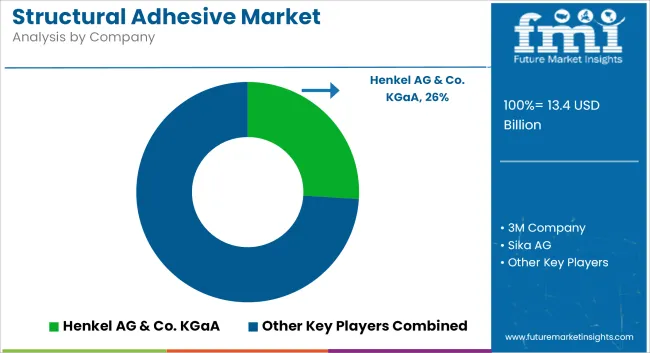
Many local and international companies operating across different geographies characterize global structural adhesives. Major players are spending a great deal of time and energy in developing profitable alliances, acquiring mid-sized and small active vendors, or acquiring a specific adhesive sector to expand their global footprint. While domestic suppliers capitalize on regional needs, their product portfolios resemble those of international suppliers.

  • In August 2023, the 3M™ Scotch-Weld™ Nylon Bonder Structural Adhesive DP8910NS, was designed for high-temperature bonding and required minimal surface prep prior to bonding. Automobiles, EV batteries, and sporting goods & equipment use the 3M Scotch-Weld Nylon Bonder Structural Adhesive DP8910NS.
  • In October 2023, Bostik, a leading global adhesive specialist, showcased its new Thermal Conductive Adhesives (TCA) range at the India Battery Show 2023. A collaboration between Bostik and Polytec PT led to the new range of TCA designed to address the thermal management challenge of the latest Cell-to-Pack (CTP) battery design.

Report Scope

Attributes Details
Estimated Market Size in 2023 US$ 12,276.7 million
Projected Market Valuation in 2033 US$ 19,619.8 million
Value-based CAGR 2023 to 2033 4.8%
Forecast Period 2023 to 2033
Historical Data Available for 2018 to 2022
Market Analysis Value in US$ million
Key Regions Covered
  • North America
  • Latin America
  • Western Europe
  • Eastern Europe
  • South Asia and Pacific
  • East Asia
  • The Middle East & Africa
Key Market Segments Covered
  • Product Type
  • Application
  • Region
Key Countries Profiled
  • The United States
  • Canada
  • Brazil
  • Mexico
  • Germany
  • The United Kingdom
  • France
  • Spain
  • Italy
  • Russia
  • Poland
  • Czech Republic
  • Romania
  • India
  • Bangladesh
  • Australia
  • New Zealand
  • China
  • Japan
  • South Korea
  • GCC countries
  • South Africa
  • Israel
Key Companies Profiled
  • Henkel AG & Co. KGaA
  • Dow
  • 3M
  • H. B. Fuller Company
  • Franklin International
  • AVERY DENNISON CORPORATION
  • Ashland
  • Lord Corporation (Parker Hannifin Corp.)
  • Arkema
  • Hubei Huitian Adhesive Enterprise Co., Ltd.

Key Segments in the Structural Adhesive Market

By Product Type:

  • Epoxy-based Structural Adhesive
    • One Component
    • Two Component
  • Acrylic-based Structural Adhesive
  • Polyurethane-based Structural Adhesive
  • Cyanoacrylates
  • Others

By Application:

  • Transportation Sector
    • Automotive Sector
    • Aerospace Sector
    • Marine Sector
  • Building & Construction Sector
  • Energy Sector
  • Others

By Region:

  • North America
  • Latin America
  • Western Europe
  • Eastern Europe
  • South Asia and Pacific
  • East Asia
  • Middle East and Africa

Frequently Asked Questions

What is the expected size of the structural adhesive market in 2023?

structural adhesive is expected to reach US$ 12,276.7 million in 2023.

What is the expected CAGR from 2023 to 2033 for structural adhesive sales?

The structural adhesive market is expected to increase by a CAGR of 4.8% by 2033.

What is the estimated size of the structural adhesive market in 2033?

The structural adhesive industry is forecast to reach US$ 19,619.8 million by 2033.

Which product type is expected to be the dominant structural adhesive on the market?

The polyurethane-based structural adhesive is expected to dominate the market.

Which application is expected to dominate the structural adhesive market?

Building and construction industries is expected to dominate the structural adhesive market.

Table of Content
1. Executive Summary
    1.1. Global Market Outlook
    1.2. Demand-side Trends
    1.3. Supply-side Trends
    1.4. Technology Roadmap Analysis
    1.5. Analysis and Recommendations
2. Market Overview
    2.1. Market Coverage / Taxonomy
    2.2. Market Definition / Scope / Limitations
3. Market Background
    3.1. Market Dynamics
        3.1.1. Drivers
        3.1.2. Restraints
        3.1.3. Opportunity
        3.1.4. Trends
    3.2. Scenario Forecast
        3.2.1. Demand in Optimistic Scenario
        3.2.2. Demand in Likely Scenario
        3.2.3. Demand in Conservative Scenario
    3.3. Opportunity Map Analysis
    3.4. Product Life Cycle Analysis
    3.5. Supply Chain Analysis
        3.5.1. Supply Side Participants and their Roles
            3.5.1.1. Producers
            3.5.1.2. Mid-Level Participants (Traders/ Agents/ Brokers)
            3.5.1.3. Wholesalers and Distributors
        3.5.2. Value Added and Value Created at Node in the Supply Chain
        3.5.3. List of Raw Material Suppliers
        3.5.4. List of Existing and Potential Buyer’s
    3.6. Investment Feasibility Matrix
    3.7. Value Chain Analysis
        3.7.1. Profit Margin Analysis
        3.7.2. Wholesalers and Distributors
        3.7.3. Retailers
    3.8. PESTLE and Porter’s Analysis
    3.9. Regulatory Landscape
        3.9.1. By Key Regions
        3.9.2. By Key Countries
    3.10. Regional Parent Market Outlook
    3.11. Production and Consumption Statistics
    3.12. Import and Export Statistics
4. Global Market Analysis 2018 to 2022 and Forecast, 2023 to 2033
    4.1. Historical Market Size Value (US$ Million) & Volume (Tons) Analysis, 2018 to 2022
    4.2. Current and Future Market Size Value (US$ Million) & Volume (Tons) Projections, 2023 to 2033
        4.2.1. Y-o-Y Growth Trend Analysis
        4.2.2. Absolute $ Opportunity Analysis
5. Global Market Analysis 2018 to 2022 and Forecast 2023 to 2033, By Product Type
    5.1. Introduction / Key Findings
    5.2. Historical Market Size Value (US$ Million) & Volume (Tons) Analysis By Product Type, 2018 to 2022
    5.3. Current and Future Market Size Value (US$ Million) & Volume (Tons) Analysis and Forecast By Product Type, 2023 to 2033
        5.3.1. Epoxy-based Structural Adhesives
            5.3.1.1. One Component
            5.3.1.2. Two Component
        5.3.2. Acrylic-based Structural Adhesives
        5.3.3. Polyurethane-based Structural Adhesives
        5.3.4. Cyanoacrylates
        5.3.5. Others
    5.4. Y-o-Y Growth Trend Analysis By Product Type, 2018 to 2022
    5.5. Absolute $ Opportunity Analysis By Product Type, 2023 to 2033
6. Global Market Analysis 2018 to 2022 and Forecast 2023 to 2033, By Application
    6.1. Introduction / Key Findings
    6.2. Historical Market Size Value (US$ Million) & Volume (Tons) Analysis By Application, 2018 to 2022
    6.3. Current and Future Market Size Value (US$ Million) & Volume (Tons) Analysis and Forecast By Application, 2023 to 2033
        6.3.1. Transportation Sector
            6.3.1.1. Automotive Sector
            6.3.1.2. Aerospace Sector
            6.3.1.3. Marine Sector
        6.3.2. Building & Construction Sector
            6.3.2.1. Energy Sector
            6.3.2.2. Others
    6.4. Y-o-Y Growth Trend Analysis By Application, 2018 to 2022
    6.5. Absolute $ Opportunity Analysis By Application, 2023 to 2033
7. Global Market Analysis 2018 to 2022 and Forecast 2023 to 2033, By Region
    7.1. Introduction
    7.2. Historical Market Size Value (US$ Million) & Volume (Tons) Analysis By Region, 2018 to 2022
    7.3. Current Market Size Value (US$ Million) & Volume (Tons) Analysis and Forecast By Region, 2023 to 2033
        7.3.1. North America
        7.3.2. Latin America
        7.3.3. Western Europe
        7.3.4. Eastern Europe
        7.3.5. South Asia and Pacific
        7.3.6. East Asia
        7.3.7. Middle East and Africa
    7.4. Market Attractiveness Analysis By Region
8. North America Market Analysis 2018 to 2022 and Forecast 2023 to 2033, By Country
    8.1. Historical Market Size Value (US$ Million) & Volume (Tons) Trend Analysis By Market Taxonomy, 2018 to 2022
    8.2. Market Size Value (US$ Million) & Volume (Tons) Forecast By Market Taxonomy, 2023 to 2033
        8.2.1. By Country
            8.2.1.1. USA
            8.2.1.2. Canada
        8.2.2. By Product Type
        8.2.3. By Application
    8.3. Market Attractiveness Analysis
        8.3.1. By Country
        8.3.2. By Product Type
        8.3.3. By Application
    8.4. Key Takeaways
9. Latin America Market Analysis 2018 to 2022 and Forecast 2023 to 2033, By Country
    9.1. Historical Market Size Value (US$ Million) & Volume (Tons) Trend Analysis By Market Taxonomy, 2018 to 2022
    9.2. Market Size Value (US$ Million) & Volume (Tons) Forecast By Market Taxonomy, 2023 to 2033
        9.2.1. By Country
            9.2.1.1. Brazil
            9.2.1.2. Mexico
            9.2.1.3. Rest of Latin America
        9.2.2. By Product Type
        9.2.3. By Application
    9.3. Market Attractiveness Analysis
        9.3.1. By Country
        9.3.2. By Product Type
        9.3.3. By Application
    9.4. Key Takeaways
10. Western Europe Market Analysis 2018 to 2022 and Forecast 2023 to 2033, By Country
    10.1. Historical Market Size Value (US$ Million) & Volume (Tons) Trend Analysis By Market Taxonomy, 2018 to 2022
    10.2. Market Size Value (US$ Million) & Volume (Tons) Forecast By Market Taxonomy, 2023 to 2033
        10.2.1. By Country
            10.2.1.1. Germany
            10.2.1.2. UK
            10.2.1.3. France
            10.2.1.4. Spain
            10.2.1.5. Italy
            10.2.1.6. Rest of Western Europe
        10.2.2. By Product Type
        10.2.3. By Application
    10.3. Market Attractiveness Analysis
        10.3.1. By Country
        10.3.2. By Product Type
        10.3.3. By Application
    10.4. Key Takeaways
11. Eastern Europe Market Analysis 2018 to 2022 and Forecast 2023 to 2033, By Country
    11.1. Historical Market Size Value (US$ Million) & Volume (Tons) Trend Analysis By Market Taxonomy, 2018 to 2022
    11.2. Market Size Value (US$ Million) & Volume (Tons) Forecast By Market Taxonomy, 2023 to 2033
        11.2.1. By Country
            11.2.1.1. Poland
            11.2.1.2. Russia
            11.2.1.3. Czech Republic
            11.2.1.4. Romania
            11.2.1.5. Rest of Eastern Europe
        11.2.2. By Product Type
        11.2.3. By Application
    11.3. Market Attractiveness Analysis
        11.3.1. By Country
        11.3.2. By Product Type
        11.3.3. By Application
    11.4. Key Takeaways
12. South Asia and Pacific Market Analysis 2018 to 2022 and Forecast 2023 to 2033, By Country
    12.1. Historical Market Size Value (US$ Million) & Volume (Tons) Trend Analysis By Market Taxonomy, 2018 to 2022
    12.2. Market Size Value (US$ Million) & Volume (Tons) Forecast By Market Taxonomy, 2023 to 2033
        12.2.1. By Country
            12.2.1.1. India
            12.2.1.2. Bangladesh
            12.2.1.3. Australia
            12.2.1.4. New Zealand
            12.2.1.5. Rest of South Asia and Pacific
        12.2.2. By Product Type
        12.2.3. By Application
    12.3. Market Attractiveness Analysis
        12.3.1. By Country
        12.3.2. By Product Type
        12.3.3. By Application
    12.4. Key Takeaways
13. East Asia Market Analysis 2018 to 2022 and Forecast 2023 to 2033, By Country
    13.1. Historical Market Size Value (US$ Million) & Volume (Tons) Trend Analysis By Market Taxonomy, 2018 to 2022
    13.2. Market Size Value (US$ Million) & Volume (Tons) Forecast By Market Taxonomy, 2023 to 2033
        13.2.1. By Country
            13.2.1.1. China
            13.2.1.2. Japan
            13.2.1.3. South Korea
        13.2.2. By Product Type
        13.2.3. By Application
    13.3. Market Attractiveness Analysis
        13.3.1. By Country
        13.3.2. By Product Type
        13.3.3. By Application
    13.4. Key Takeaways
14. Middle East and Africa Market Analysis 2018 to 2022 and Forecast 2023 to 2033, By Country
    14.1. Historical Market Size Value (US$ Million) & Volume (Tons) Trend Analysis By Market Taxonomy, 2018 to 2022
    14.2. Market Size Value (US$ Million) & Volume (Tons) Forecast By Market Taxonomy, 2023 to 2033
        14.2.1. By Country
            14.2.1.1. GCC Countries
            14.2.1.2. South Africa
            14.2.1.3. Israel
            14.2.1.4. Rest of MEA
        14.2.2. By Product Type
        14.2.3. By Application
    14.3. Market Attractiveness Analysis
        14.3.1. By Country
        14.3.2. By Product Type
        14.3.3. By Application
    14.4. Key Takeaways
15. Key Countries Market Analysis
    15.1. USA
        15.1.1. Pricing Analysis
        15.1.2. Market Share Analysis, 2023
            15.1.2.1. By Product Type
            15.1.2.2. By Application
    15.2. Canada
        15.2.1. Pricing Analysis
        15.2.2. Market Share Analysis, 2023
            15.2.2.1. By Product Type
            15.2.2.2. By Application
    15.3. Brazil
        15.3.1. Pricing Analysis
        15.3.2. Market Share Analysis, 2023
            15.3.2.1. By Product Type
            15.3.2.2. By Application
    15.4. Mexico
        15.4.1. Pricing Analysis
        15.4.2. Market Share Analysis, 2023
            15.4.2.1. By Product Type
            15.4.2.2. By Application
    15.5. Germany
        15.5.1. Pricing Analysis
        15.5.2. Market Share Analysis, 2023
            15.5.2.1. By Product Type
            15.5.2.2. By Application
    15.6. UK
        15.6.1. Pricing Analysis
        15.6.2. Market Share Analysis, 2023
            15.6.2.1. By Product Type
            15.6.2.2. By Application
    15.7. France
        15.7.1. Pricing Analysis
        15.7.2. Market Share Analysis, 2023
            15.7.2.1. By Product Type
            15.7.2.2. By Application
    15.8. Spain
        15.8.1. Pricing Analysis
        15.8.2. Market Share Analysis, 2023
            15.8.2.1. By Product Type
            15.8.2.2. By Application
    15.9. Italy
        15.9.1. Pricing Analysis
        15.9.2. Market Share Analysis, 2023
            15.9.2.1. By Product Type
            15.9.2.2. By Application
    15.10. Poland
        15.10.1. Pricing Analysis
        15.10.2. Market Share Analysis, 2023
            15.10.2.1. By Product Type
            15.10.2.2. By Application
    15.11. Russia
        15.11.1. Pricing Analysis
        15.11.2. Market Share Analysis, 2023
            15.11.2.1. By Product Type
            15.11.2.2. By Application
    15.12. Czech Republic
        15.12.1. Pricing Analysis
        15.12.2. Market Share Analysis, 2023
            15.12.2.1. By Product Type
            15.12.2.2. By Application
    15.13. Romania
        15.13.1. Pricing Analysis
        15.13.2. Market Share Analysis, 2023
            15.13.2.1. By Product Type
            15.13.2.2. By Application
    15.14. India
        15.14.1. Pricing Analysis
        15.14.2. Market Share Analysis, 2023
            15.14.2.1. By Product Type
            15.14.2.2. By Application
    15.15. Bangladesh
        15.15.1. Pricing Analysis
        15.15.2. Market Share Analysis, 2023
            15.15.2.1. By Product Type
            15.15.2.2. By Application
    15.16. Australia
        15.16.1. Pricing Analysis
        15.16.2. Market Share Analysis, 2023
            15.16.2.1. By Product Type
            15.16.2.2. By Application
    15.17. New Zealand
        15.17.1. Pricing Analysis
        15.17.2. Market Share Analysis, 2023
            15.17.2.1. By Product Type
            15.17.2.2. By Application
    15.18. China
        15.18.1. Pricing Analysis
        15.18.2. Market Share Analysis, 2023
            15.18.2.1. By Product Type
            15.18.2.2. By Application
    15.19. Japan
        15.19.1. Pricing Analysis
        15.19.2. Market Share Analysis, 2023
            15.19.2.1. By Product Type
            15.19.2.2. By Application
    15.20. South Korea
        15.20.1. Pricing Analysis
        15.20.2. Market Share Analysis, 2023
            15.20.2.1. By Product Type
            15.20.2.2. By Application
    15.21. GCC Countries
        15.21.1. Pricing Analysis
        15.21.2. Market Share Analysis, 2023
            15.21.2.1. By Product Type
            15.21.2.2. By Application
    15.22. South Africa
        15.22.1. Pricing Analysis
        15.22.2. Market Share Analysis, 2023
            15.22.2.1. By Product Type
            15.22.2.2. By Application
    15.23. Israel
        15.23.1. Pricing Analysis
        15.23.2. Market Share Analysis, 2023
            15.23.2.1. By Product Type
            15.23.2.2. By Application
16. Market Structure Analysis
    16.1. Competition Dashboard
    16.2. Competition Benchmarking
    16.3. Market Share Analysis of Top Players
        16.3.1. By Regional
        16.3.2. By Product Type
        16.3.3. By Application
17. Competition Analysis
    17.1. Competition Deep Dive
        17.1.1. Henkel AG & Co. KGaA
            17.1.1.1. Overview
            17.1.1.2. Product Portfolio
            17.1.1.3. Profitability by Market Segments
            17.1.1.4. Sales Footprint
            17.1.1.5. Strategy Overview
                17.1.1.5.1. Marketing Strategy
                17.1.1.5.2. Product Strategy
                17.1.1.5.3. Channel Strategy
        17.1.2. Dow
            17.1.2.1. Overview
            17.1.2.2. Product Portfolio
            17.1.2.3. Profitability by Market Segments
            17.1.2.4. Sales Footprint
            17.1.2.5. Strategy Overview
                17.1.2.5.1. Marketing Strategy
                17.1.2.5.2. Product Strategy
                17.1.2.5.3. Channel Strategy
        17.1.3. 3M
            17.1.3.1. Overview
            17.1.3.2. Product Portfolio
            17.1.3.3. Profitability by Market Segments
            17.1.3.4. Sales Footprint
            17.1.3.5. Strategy Overview
                17.1.3.5.1. Marketing Strategy
                17.1.3.5.2. Product Strategy
                17.1.3.5.3. Channel Strategy
        17.1.4. H. B. Fuller Company
            17.1.4.1. Overview
            17.1.4.2. Product Portfolio
            17.1.4.3. Profitability by Market Segments
            17.1.4.4. Sales Footprint
            17.1.4.5. Strategy Overview
                17.1.4.5.1. Marketing Strategy
                17.1.4.5.2. Product Strategy
                17.1.4.5.3. Channel Strategy
        17.1.5. Franklin International
            17.1.5.1. Overview
            17.1.5.2. Product Portfolio
            17.1.5.3. Profitability by Market Segments
            17.1.5.4. Sales Footprint
            17.1.5.5. Strategy Overview
                17.1.5.5.1. Marketing Strategy
                17.1.5.5.2. Product Strategy
                17.1.5.5.3. Channel Strategy
        17.1.6. AVERY DENNISON CORPORATION
            17.1.6.1. Overview
            17.1.6.2. Product Portfolio
            17.1.6.3. Profitability by Market Segments
            17.1.6.4. Sales Footprint
            17.1.6.5. Strategy Overview
                17.1.6.5.1. Marketing Strategy
                17.1.6.5.2. Product Strategy
                17.1.6.5.3. Channel Strategy
        17.1.7. Ashland
            17.1.7.1. Overview
            17.1.7.2. Product Portfolio
            17.1.7.3. Profitability by Market Segments
            17.1.7.4. Sales Footprint
            17.1.7.5. Strategy Overview
                17.1.7.5.1. Marketing Strategy
                17.1.7.5.2. Product Strategy
                17.1.7.5.3. Channel Strategy
        17.1.8. Lord Corporation (Parker Hannifin Corp.)
            17.1.8.1. Overview
            17.1.8.2. Product Portfolio
            17.1.8.3. Profitability by Market Segments
            17.1.8.4. Sales Footprint
            17.1.8.5. Strategy Overview
                17.1.8.5.1. Marketing Strategy
                17.1.8.5.2. Product Strategy
                17.1.8.5.3. Channel Strategy
        17.1.9. Arkema
            17.1.9.1. Overview
            17.1.9.2. Product Portfolio
            17.1.9.3. Profitability by Market Segments
            17.1.9.4. Sales Footprint
            17.1.9.5. Strategy Overview
                17.1.9.5.1. Marketing Strategy
                17.1.9.5.2. Product Strategy
                17.1.9.5.3. Channel Strategy
        17.1.10. Hubei Huitian Adhesive Enterprise Co., Ltd.
            17.1.10.1. Overview
            17.1.10.2. Product Portfolio
            17.1.10.3. Profitability by Market Segments
            17.1.10.4. Sales Footprint
            17.1.10.5. Strategy Overview
                17.1.10.5.1. Marketing Strategy
                17.1.10.5.2. Product Strategy
                17.1.10.5.3. Channel Strategy
18. Assumptions & Acronyms Used
19. Research Methodology
Recommendations

Chemicals & Materials

Electronics Adhesives Market

June 2023

REP-GB-378

397 pages

Packaging

Adhesive Films Market

January 2023

REP-GB-12371

274 pages

Packaging

Adhesive Transfer Tape Market

September 2022

REP-GB-2614

250 pages

Explore Chemicals & Materials Insights

View Reports
Future Market Insights

Structural Adhesive Market

Schedule a Call