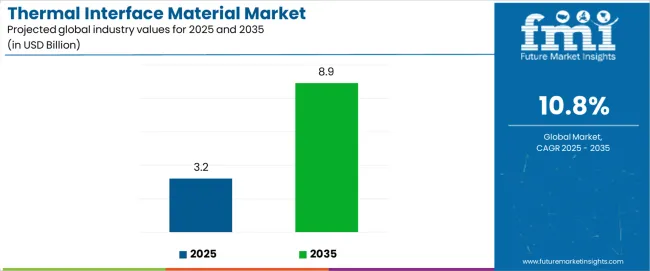
The thermal interface material market stands at the threshold of a decade-long expansion trajectory that promises to reshape thermal management technology and heat dissipation solutions. The market's journey from USD 3.2 billion in 2025 to USD 8.9 billion by 2035 represents substantial growth, demonstrating the accelerating adoption of advanced thermal management technologies and premium heat dissipation optimization across electronics manufacturing, automotive systems, and telecommunications sectors.
The first half of the decade (2025-2030) will witness the market climbing from USD 3.2 billion to approximately USD 5.1 billion, adding USD 1.9 billion in value, which constitutes 34% of the total forecast growth period. This phase will be characterized by the rapid adoption of premium thermal interface materials, driven by increasing electronics miniaturization and the growing need for advanced thermal management solutions worldwide. Enhanced thermal conductivity capabilities and reliability control systems will become standard expectations rather than premium options.
The latter half (2030-2035) will witness continued growth from USD 5.1 billion to USD 8.9 billion, representing an addition of USD 3.8 billion or 66% of the decade's expansion. This period will be defined by mass market penetration of specialized thermal technologies, integration with comprehensive electronics platforms, and seamless compatibility with existing manufacturing infrastructure. The market trajectory signals fundamental shifts in how electronic manufacturers approach thermal management quality and heat dissipation optimization, with participants positioned to benefit from growing demand across multiple material types and application segments.
| Period | Primary Revenue Buckets | Share | Notes |
|---|---|---|---|
| Today | Thermal greases/adhesives | 38% | Electronics applications, CPUs |
| Thermal pads | 26% | Consumer electronics, LED lighting | |
| Gap fillers | 22% | Automotive electronics, power modules | |
| Phase change materials | 14% | High-performance computing, servers | |
| Future (3-5 yrs) | Advanced silicone materials | 35-42% | Electric vehicles, 5G infrastructure |
| High-conductivity pads | 28-32% | Data centers, semiconductor packaging | |
| Metal-based TIMs | 15-18% | Aerospace applications, industrial equipment | |
| Phase change materials | 12-16% | AI processors, quantum computing | |
| Graphene-enhanced TIMs | 8-12% | Next-gen electronics, wearable devices |
| Metric | Value |
|---|---|
| Market Value (2025) | USD 3.2 billion |
| Market Forecast (2035) | USD 8.9 billion |
| Growth Rate | 10.8% CAGR |
| Leading Technology | Silicone-Based Materials |
| Primary Application | Electronics & Semiconductor Segment |
The market demonstrates strong fundamentals with silicone-based thermal interface material systems capturing a dominant share through advanced thermal conductivity capabilities and heat management optimization. Electronics & semiconductor applications drive primary demand, supported by increasing device miniaturization and premium thermal management equipment adoption requirements. Geographic expansion remains concentrated in developed markets with established electronics manufacturing cultures, while emerging economies show accelerating adoption rates driven by industrial proliferation and rising performance standards.
Primary Classification: The market segments by material type into silicone-based materials, epoxy-based materials, polyimide materials, and metal-based materials, representing the evolution from basic thermal compounds to sophisticated heat management solutions for comprehensive thermal optimization.
Secondary Classification: Product type segmentation divides the market into thermal greases/adhesives, thermal pads, gap fillers, and phase change materials, reflecting distinct requirements for thermal conductivity, application methods, and performance standards.
Tertiary Classification: Application segmentation covers electronics & semiconductors, automotive systems, telecommunications equipment, industrial machinery, and aerospace applications, while thermal conductivity spans low conductivity (below 2 W/mK), medium conductivity (2-5 W/mK), and high conductivity (above 5 W/mK) categories.
Regional Classification: Geographic distribution covers Asia Pacific, North America, Western Europe, Latin America, Eastern Europe, and Middle East & Africa, with developed markets leading adoption while emerging economies show accelerating growth patterns driven by electronics manufacturing expansion programs.
The segmentation structure reveals technology progression from standard thermal compounds toward sophisticated heat management systems with enhanced conductivity and reliability capabilities, while application diversity spans from consumer electronics to aerospace establishments requiring precise thermal solutions.
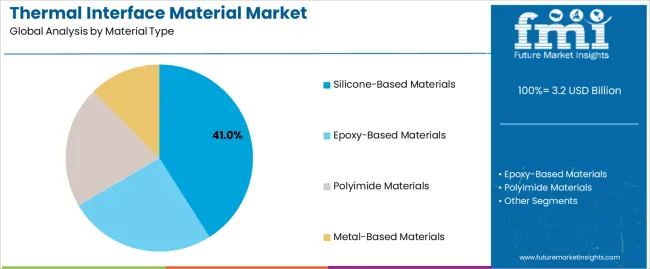
Market Position: Silicone-Based Material systems command the leading position in the thermal interface material market with 41% market share through advanced thermal properties, including superior conductivity, temperature stability, and thermal optimization that enable electronics manufacturers to achieve optimal heat dissipation across diverse electronic and automotive environments.
Value Drivers: The segment benefits from manufacturer preference for reliable thermal systems that provide consistent performance, enhanced heat management, and temperature optimization without compromising material integrity or affecting component performance characteristics. Advanced material engineering enables thermal stability, chemical resistance, and integration with existing manufacturing equipment, where thermal performance and reliability consistency represent critical operational requirements.
Competitive Advantages: Silicone-Based Material systems differentiate through proven thermal reliability, consistent conductivity characteristics, and integration with automated application systems that enhance operational efficiency while maintaining optimal heat management standards suitable for diverse electronics and automotive applications.
Key market characteristics:
Epoxy-Based Material systems maintain a 25% market position in the thermal interface material market due to their excellent adhesive properties and multi-purpose advantages. These systems appeal to manufacturers requiring strong bonding capabilities with competitive pricing for diverse thermal management applications. Market growth is driven by manufacturer preference, emphasizing structural integrity and versatile thermal management through optimized material design.
Polyimide Material systems capture 18% market share through high-temperature requirements in aerospace applications, automotive electronics, and specialized industrial operations. These establishments demand temperature-resistant thermal systems capable of handling extreme conditions while providing exceptional thermal performance and material durability.
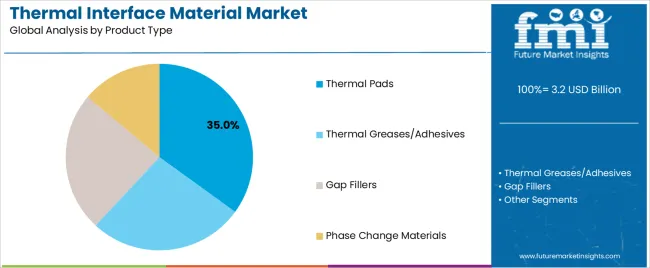
Market Context: Thermal pad applications are seeing the highest growth rate in the thermal interface material market, holding a 35% share. This growth is driven by the widespread adoption of electronics cooling, alongside an increasing focus on component protection, heat dissipation optimization, and manufacturing efficiency to maximize thermal performance while maintaining application standards.
Appeal Factors: Thermal pad operators prioritize ease of application, thermal consistency, and integration with diverse electronic components that enables optimized thermal operations across multiple device types. The segment benefits from substantial electronics manufacturing investment and miniaturization programs that emphasize the acquisition of thermal pads for component optimization and heat management applications.
Growth Drivers: Electronics manufacturing expansion programs incorporate thermal pads as standard components for device cooling, while semiconductor growth increases demand for versatile thermal capabilities that comply with performance standards and minimize application complexity.
Market Challenges: Varying component sizes and thermal requirements may limit pad standardization across different electronics or manufacturing scenarios.
Application dynamics include:
Thermal grease applications capture market share through high-performance requirements in processors, power electronics, and custom applications. These applications demand liquid thermal systems capable of operating with precision equipment while providing effective heat transfer and operational flexibility capabilities.
Phase change material applications account for market share, including data center operations, high-power electronics, and advanced thermal management requiring substantial heat absorption capabilities for operational optimization and thermal efficiency.
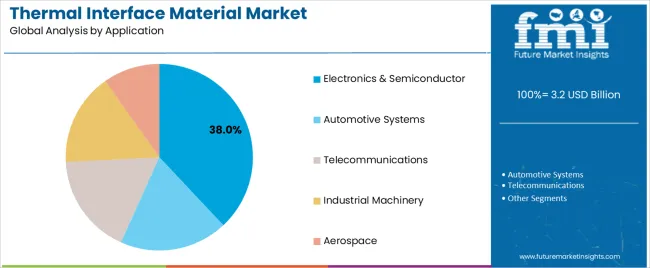
Market Position: Electronics & Semiconductor applications hold a significant market position with a 38% share, driven by growing electronic device consumption trends and the adoption of miniaturization for advanced thermal management.
Value Drivers: This application segment provides the ideal combination of performance and efficiency, meeting requirements for heat dissipation, component protection, and operational reliability without reliance on traditional cooling methods.
Growth Characteristics: The segment benefits from broad applicability across electronics manufacturers, automated production adoption, and established thermal management programs that support widespread material usage and operational convenience.
| Category | Factor | Impact | Why It Matters |
|---|---|---|---|
| Driver | Electronics miniaturization & device density increases | ★★★★★ | Smaller electronic devices generate more heat per unit area; advanced thermal management becomes critical for device reliability and performance |
| Driver | Electric vehicle proliferation & battery thermal management | ★★★★★ | EV battery packs require sophisticated thermal management systems; thermal interface materials critical for battery safety and performance optimization |
| Driver | 5G infrastructure deployment & telecommunications expansion | ★★★★★ | 5G equipment generates significant heat loads; high-performance TIMs essential for network reliability and equipment longevity |
| Restraint | High-performance material costs & price sensitivity | ★★★★☆ | Advanced thermal materials command premium pricing; cost pressures in consumer electronics limit adoption of high-end solutions |
| Restraint | Technical complexity & application challenges | ★★★☆☆ | Proper TIM application requires expertise; incorrect installation reduces thermal efficiency and component reliability |
| Trend | Graphene & nanomaterial integration for enhanced conductivity | ★★★★★ | Next-generation materials offering superior thermal properties; graphene-enhanced TIMs achieving breakthrough conductivity levels |
| Trend | Phase change materials for dynamic thermal management | ★★★★☆ | Smart thermal materials adapting to temperature variations; PCMs providing variable thermal response for optimized heat management |
The thermal interface material market demonstrates varied regional dynamics with growth leaders including China (11.3% growth rate) and India (10.7% growth rate) driving expansion through electronics manufacturing proliferation and automotive electrification initiatives. Steady Performers encompass United States (8.6% growth rate), Germany (9.1% growth rate), and developed regions, benefiting from established electronics cultures and advanced manufacturing adoption. Emerging Markets feature Japan (7.4% growth rate) and developing regions, where semiconductor advancement and thermal management modernization support consistent growth patterns.
Regional synthesis reveals Asia Pacific markets leading value generation through manufacturing scale and electronics production culture, while North American markets demonstrate highest premium product adoption supported by automotive electrification and data center expansion. European markets show strong growth driven by automotive electronics requirements and industrial automation integration.
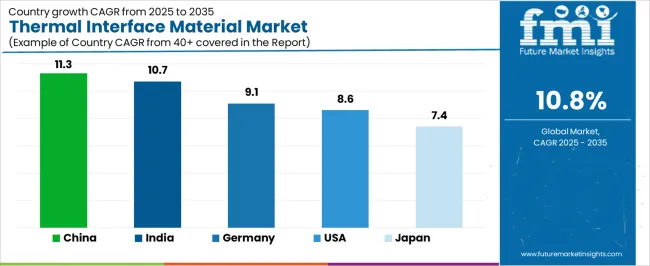
| Region/Country | 2025-2035 Growth | How to win | What to watch out |
|---|---|---|---|
| China | 11.3% | Electronics scale; manufacturing efficiency | Supply chain disruption; competition intensity |
| India | 10.7% | Automotive growth; cost-effective solutions | Infrastructure limitations; quality standards |
| United States | 8.6% | Premium materials; automotive electrification | Regulatory changes; cost pressures |
| Germany | 9.1% | Automotive excellence; industrial automation | Economic slowdown; material costs |
| Japan | 7.4% | Semiconductor leadership; precision applications | Market saturation; demographic challenges |
China establishes fastest market growth through massive electronics manufacturing infrastructure and comprehensive automotive electrification, integrating advanced thermal interface materials as standard components in electronics production and electric vehicle installations. The country's 11.3% growth rate reflects explosive consumer electronics adoption and domestic manufacturing industry expansion that mandates the use of quality thermal management systems in commercial and automotive facilities. Growth concentrates in major industrial centers, including Shenzhen, Shanghai, and Beijing, where electronics manufacturers showcase integrated thermal systems that appeal to companies seeking advanced heat dissipation capabilities and manufacturing optimization applications.
Chinese manufacturers are developing domestically-produced thermal solutions that combine local production advantages with functional operational features, including enhanced thermal conductivity and reliability capabilities. Distribution channels through electronics supply chains and automotive partnerships expand market access, while manufacturing culture supports adoption across diverse commercial and industrial segments.
Strategic Market Indicators:
In Mumbai, Delhi, and Bangalore, electronics manufacturers and automotive companies are implementing thermal interface materials as standard components for heat management and performance applications, driven by increasing industrial investment and electrification programs that emphasize the importance of thermal management quality. The market holds a 10.7% growth rate, supported by automotive electrification and manufacturing expansion programs that promote quality thermal systems for commercial and industrial applications. Indian operators are adopting thermal solutions that provide consistent performance and heat management features, particularly appealing in urban regions where electronics manufacturing and thermal reliability represent critical operational expectations.
Market expansion benefits from growing industrial capacity and automotive proliferation that enable widespread adoption of quality thermal management systems for manufacturing and automotive applications. Technology adoption follows patterns established in electronics manufacturing, where functionality and performance drive procurement decisions and operational deployment.
Market Intelligence Brief:
United States establishes market leadership through comprehensive automotive electrification programs and advanced electronics manufacturing development, integrating thermal interface materials across automotive and electronics applications. The country's 8.6% growth rate reflects established industrial consumption patterns and mature thermal technology adoption that supports widespread use of premium thermal systems in automotive and electronics facilities. Growth concentrates in major industrial areas, including California, Texas, and Michigan, where automotive electrification showcases mature thermal deployment that appeals to manufacturers seeking proven heat management capabilities and performance optimization applications.
American electronics establishments leverage established distribution networks and comprehensive product availability, including high-conductivity materials and specialized thermal solutions that create performance differentiation and operational advantages. The market benefits from mature automotive infrastructure and manufacturer willingness to invest in quality thermal materials that enhance component performance and thermal optimization.
Market Intelligence Brief:
Advanced automotive engineering market in Germany demonstrates sophisticated thermal interface material deployment with documented performance effectiveness in automotive applications and electronics facilities through integration with existing manufacturing systems and automotive infrastructure. The country leverages automotive excellence and industrial standards to maintain a 9.1% growth rate. Industrial centers, including Munich, Stuttgart, and Hamburg, showcase premium installations where thermal materials integrate with comprehensive manufacturing platforms and automotive systems to optimize heat management operations and performance effectiveness.
German operators prioritize manufacturing precision and automotive performance in thermal procurement, creating demand for certified products with advanced features, including high-conductivity formulations and automotive-grade specifications. The market benefits from established engineering consciousness and willingness to invest in premium thermal materials that provide superior performance benefits and adherence to automotive standards.
Market Intelligence Brief:
Thermal interface material market expansion in Japan benefits from diverse semiconductor demand, including precision electronics in Tokyo and Osaka, manufacturing establishment growth, and rising industrial automation that increasingly incorporate thermal interface material solutions for heat management applications. The country maintains a 7.4% growth rate, driven by technological advancement and increasing recognition of thermal material benefits, including improved component protection and enhanced manufacturing performance.
Market dynamics focus on precision thermal solutions that balance performance with quality considerations important to Japanese manufacturers. Growing semiconductor proliferation creates continued demand for advanced thermal management systems in new manufacturing infrastructure and electronics modernization projects.
Strategic Market Considerations:
The European thermal interface material market is projected to grow from USD 0.9 billion in 2025 to USD 2.1 billion by 2035, registering a CAGR of 8.8% over the forecast period. Germany is expected to maintain its leadership position with a 31.2% market share in 2025, supported by its strong automotive industry and electronics manufacturing density.
United Kingdom follows with a 19.8% share in 2025, driven by automotive electrification and telecommunications infrastructure expansion. France holds a 18.7% share through industrial automation and aerospace applications. Italy commands a 16.3% share, while Spain accounts for 14.0% in 2025. The rest of Europe region is anticipated to gain momentum, expanding its collective share from 7.5% to 8.9% by 2035, attributed to increasing industrial automation in Nordic countries and emerging electronics manufacturing implementing quality thermal management programs.
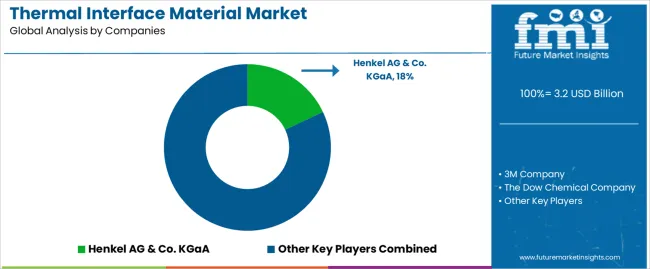
| Stakeholder | What they actually control | Typical strengths | Typical blind spots |
|---|---|---|---|
| Global manufacturers | Production scale, material science, distribution networks | Technical expertise, consistent quality, global reach | Innovation speed; local customization |
| Specialty formulators | Custom compounds; high-performance materials; advanced formulations | Technical leadership; customer partnerships; differentiation | Mass market access; price competition |
| Regional producers | Local manufacturing, distribution channels, competitive costs | Market proximity; cultural understanding; cost advantage | Technology gaps; international expansion |
| Material innovators | Advanced formulations, nanomaterial integration, next-gen solutions | R&D capabilities; patent portfolio; performance leadership | Market scalability; distribution challenges |
| Application specialists | Industry expertise, application knowledge, technical support | Customer relationships; technical service; market understanding | Technology innovation; global scale |
| Item | Value |
|---|---|
| Quantitative Units | USD 3.2 billion |
| Material Type | Silicone-Based Materials, Epoxy-Based Materials, Polyimide Materials, Metal-Based Materials |
| Product Type | Thermal Greases/Adhesives, Thermal Pads, Gap Fillers, Phase Change Materials |
| Thermal Conductivity | Low (below 2 W/mK), Medium (2-5 W/mK), High (above 5 W/mK) |
| Application | Electronics & Semiconductors, Automotive Systems, Telecommunications, Industrial Machinery, Aerospace |
| Regions Covered | Asia Pacific, North America, Western Europe, Latin America, Eastern Europe, Middle East & Africa |
| Countries Covered | China, India, United States, Germany, Japan, United Kingdom, South Korea, France, Italy, Brazil, and 25+ additional countries |
| Key Companies Profiled | Henkel AG, 3M Company, The Dow Chemical Company, Honeywell International Inc., Parker Hannifin Corporation, Shin-Etsu Chemical, Indium Corporation |
| Additional Attributes | Revenue analysis by material type and product categories, regional adoption trends across Asia Pacific, North America, and Western Europe, competitive landscape with thermal material manufacturers and electronics suppliers, customer preferences for heat management and performance optimization, integration with manufacturing systems and automotive platforms, innovations in thermal conductivity technology and material enhancement, and development of advanced thermal solutions with enhanced performance and heat management capabilities. |
The global thermal interface material market is estimated to be valued at USD 3.2 billion in 2025.
The market size for the thermal interface material market is projected to reach USD 8.9 billion by 2035.
The thermal interface material market is expected to grow at a 10.8% CAGR between 2025 and 2035.
The key product types in thermal interface material market are silicone-based materials , epoxy-based materials, polyimide materials and metal-based materials.
In terms of product type, thermal pads segment to command 35.0% share in the thermal interface material market in 2025.


Full Research Suite comprises of:
Market outlook & trends analysis
Interviews & case studies
Strategic recommendations
Vendor profiles & capabilities analysis
5-year forecasts
8 regions and 60+ country-level data splits
Market segment data splits
12 months of continuous data updates
DELIVERED AS:
PDF EXCEL ONLINE
Thermal Interface Pads and Materials Market Growth - Trends, Analysis & Forecast by Type, product, Application and Region through 2035
Thermal Management Market Forecast and Outlook 2025 to 2035
Thermal Impulse Sealers Market Size and Share Forecast Outlook 2025 to 2035
Thermal Inkjet Printer Market Size and Share Forecast Outlook 2025 to 2035
Thermal-Wet Gas Abatement System Market Size and Share Forecast Outlook 2025 to 2035
Thermal Spray Service Market Size and Share Forecast Outlook 2025 to 2035
Thermal Barrier Coatings Market Size and Share Forecast Outlook 2025 to 2035
Thermal Energy Harvesting Market Size and Share Forecast Outlook 2025 to 2035
Thermally Stable Antiscalant Market Size and Share Forecast Outlook 2025 to 2035
Thermal Spa and Wellness Market Size and Share Forecast Outlook 2025 to 2035
Thermal Mixing Valves Market Size and Share Forecast Outlook 2025 to 2035
Thermal Inkjet Inks Market Size and Share Forecast Outlook 2025 to 2035
Thermal Liner Market Analysis Size and Share Forecast Outlook 2025 to 2035
Thermal Insulation Coating Market Size and Share Forecast Outlook 2025 to 2035
Thermal Spray Equipment Market Size and Share Forecast Outlook 2025 to 2035
Thermal Spring Market Size and Share Forecast Outlook 2025 to 2035
Thermal Printing Market Analysis - Size, Share & Forecast 2025 to 2035
Thermal Transfer Roll Market Size and Share Forecast Outlook 2025 to 2035
Thermal Transfer Ribbon Market Growth - Demand & Forecast 2025 to 2035
Thermal Tapes Market Size and Share Forecast Outlook 2025 to 2035

Thank you!
You will receive an email from our Business Development Manager. Please be sure to check your SPAM/JUNK folder too.
Chat With
MaRIA