Food Additives Market
Market Insights on Food Additives covering sales outlook, demand forecast & up-to-date key trends
Food Additives Market By Product Type ( Food Colour, Emulsifiers, preservative, Acidity Regulators, food flavor ), Source (Natural, Synthetic), Application (Bakery & Confectionery, Dairy & Frozen Desserts, Beverages) & Region - Forecast 2022-2032
Food Additives Market Insights (2022-2032)
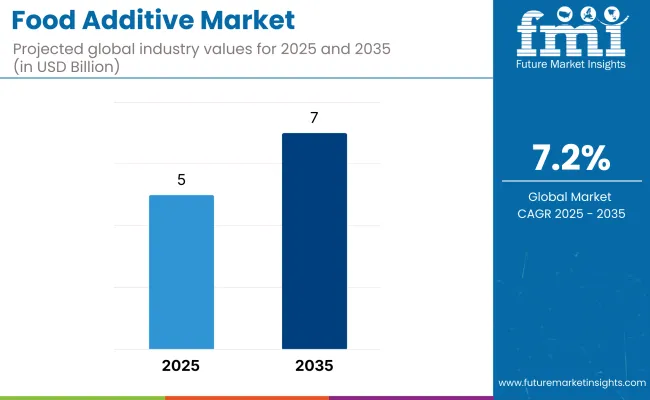
[350 Pages] From 2022 to 2032, the global Food Additives Market is expected to grow at a CAGR of 6.6%, from USD1800 Mn in the year 2021 to USD 3410 Mn in 2032.
Attribute |
Details |
Market Size Value in 2021 |
USD 1800 Mn |
Market Forecast Value in 2032 |
USD 3410 Mn |
Global Growth Rate (2022 to 2032) |
6.6% CAGR |
Collective Value Share: Top 3 Countries (2021A) |
32.4% |
The current global demand for food additives in the market stands at 4,350 thousand metric tons in the year 2021. The food additive consumer market is expected to be driven by rising processed food consumption.
The use of food additives and their application is predicted to rise as people consume more meal replacement foods ready-to-cook, and ready-to-eat food products & beverages. As per the (FSA)Food Standards Agency research data, roughly 81.0 percent of the participants of the survey in the United Kingdom admitted to purchasing processed food products between April in the year2020 and March in the year2021.Food additives are frequently used to improve the look, flavor, and appeal of the items.
Let us know your requirement to get
100% FREE customization
How The Market Progressed Till June 2022?
Market Statistics |
Details |
H1,2021 (A) |
6.5% |
H1,2022 Projected (P) |
6.6% |
H1,2022 Outlook (O) |
7.3% |
BPS Change : H1,2022 (O) - H1,2022 (P) |
(+) 66 ↑ |
BPS Change : H1,2022 (O) - H1,2021 (A) |
(+) 72.6 ↑ |
Food additives are a key trend in the food industry. They are used to improve the taste, texture and appearance of food. Some additives are also used to preserve food or to make it healthier.
The use of food additives has increased in recent years. This is because consumers are increasingly looking for foods that are healthier and more convenient. Food additives can help to improve the nutritional value of food and make it more appetizing.
Some common food additives include preservatives, coloring agents, and flavoring agents. Preservatives are used to prevent food from spoiling, while coloring agents are used to give food a more appealing color. Flavoring agents are used to enhance the flavor of food.
Food additives can be classified into two categories: natural and artificial. Natural additives are derived from plant or animal sources, while artificial additives are made in a laboratory.
The global market for Food Additives is witnessed H1 2021 growth at magnitude of 6.6%. However, this growth is not evenly spread across all regions, with the developing markets recording higher growth rates of 7.3% (H1 2022 Expected). Thus, leaving the gap of +72.6 BPS points between expected and projected growth during H1 2022.
Increasing health awareness among consumers will boost the food additive demand
To entice customers, food &beverage companies are constantly designing products enriched with health-promoting components that are fueling the market for prebiotics, probiotics, and dietary fibers. For example, Yakult Honsha Co., Ltd., a leading Japanese probiotic goods manufacturer, introduced a newline of ice - cream with infused probiotic bacteria in the year2021.
Because of the trend in customer inclination toward organic and natural diets, food &beverage companies are creating a new range of goods using plant-based components. The after-taste of such products is frequently undesirable or bitter, resulting in an unattractive sensation to the mouth. Food additives have many segments that are used as sweeteners, flavors, preservatives, and hydrocolloids to improve flavor, appeal, and texture while also extending the product's shelf life.
With rising health awareness, consumers are opting for natural ingredients like natural sweeteners, natural food colorings, and natural flavoring. Consumers’ shifting preference from synthetic to natural products could be a great opportunity for the companies to benefit from the market segment.
Increase consumption of beverages & processed food due to changing tastes and preferences as well as a dynamic and hectic lifestyle will boost the food additive market.
With people becoming more familiar with various products worldwide, the pace of globalization has boosted the experimenting with different dishes. Furthermore, the increased requirement for a wide range of foods &beverages to meet rising consumer requirements has shifted the variables and factors for packed food &beverages substantially.
Food additives are classified as emulsifiers, anti-caking agents, sweeteners, preservatives, food colors, and food flavors, among other things. Buyers these days choose items that are not only nutritious but are also flavorful, such as soft drinks, milkshakes, and fruit juices, which frequently find the application of food coloring, natural food flavoring, preservatives, and sweeteners.
Processed foods like ready-to-eat food products or canned foods that are convenient to consume and save time if often preferred by consumers due to hectic lifestyles. Such food products find a variety of applications for food additives. Salt is a major ingredient used almost in all food products and household cooking contains anti-caking agents which is a food additive. Hence, the food additive market is expected to have a booming growth owing to the magnitude of different applications and the demand in the market.
Find your sweet spots for generating winning opportunities in this market.
Talk to AnalystCategory wise segment
Natural flavoring and food coloring could be the major dominant segments in the food additive market.
The market for natural food flavors and colors ingredient is estimated to be worth USD 5.0 Bn in the year2020 and is expected to grow at a CAGR of 5.4 percent reaching a total worth of USD 6.8 Bn by the year2025. The industry is likely to be driven by rising customer inclination for clean label items. The European region is expected to lead the market for food additives due to its huge population requesting foods that are infused with natural ingredients, but the South American market is expected to develop at a robust pace due to its youth generation's increased demand for clean label and naturally sourced plant-based food.
With the increase in consumption of processed foods and convenience foods like baked products, ready-to-eat, etc., the application of natural flavors and colors has increased significantly. With the millennial population inclined towards sweets and snacks, the market for natural flavors and natural colors is going to have a promising growth during the forecast period.
The increasing variety of end-usage applications, due to the versatile properties of diverse natural components, is expected to fuel expansion in the natural food colors and flavors market. These are generally used in meat products, confectionery and bakery, frozen desserts and dairy, and convenience foods in the commercial food business. Colors and flavors are widely applied in beverage and bakery products.
Sweeteners hold a Prominent Share in the Food Additives Market
The food additive consumer market is highly influenced by the worldwide sweetener business. Fructose and Sucrose are two major types of bulk sweeteners. Bulk sweetener is very popular, accounting for 56.66%. More than 13% market share is enjoyed by Sucrose, hence being the dominant player in the market. Furthermore, rising health awareness about artificial sweeteners like saccharin and aspartame are increasing customer interest in natural sweeteners .mogro side V that is extracted from monk fruit, and Steviol glycosides are the most popular natural sweeteners. Stevia is expected to be in high demand in the domain of natural sweeteners.
Country-wise segment
US market is one of the dominant regions in terms of global market share for the food additive market
The industry is dominated by the North American segment, with the United States accounting for approximately78%of the North American market. The North American food additives business is mostly influenced by the growth of the processed foods segment, and peoples' increasingly hectic lifestyles are pushing them toward convenient products. Nevertheless, as public knowledge of the negative application of synthetic additives grows, the food and beverage sector is being pressured to establish a natural additives segment.
The market for specialized food ingredients is based on the broader functional and technological benefits which these components provide, such as excellent quality, shelf-life, cheap price, nutrients, and flavor of packaged foods. Functional, natural, and accessible drinks that provide nutritious advantages without compromising with the flavor are presently propelling the booming beverage sector. Minerals and vitamins are being infused into food products by manufacturers in order to improve their health advantages. During the projection timeframe, the market in the region is likely to be driven by the rising demand for niche food products derived from dietary constituents, primarily in the US.
The United Kingdom To Dominate the European regional market for Food Additive
The European market for food additives is fiercely competitive. There is a significant number of domestic and multinational firms battling for a share of the market, and top players use the innovation process as a key strategic tool. Furthermore, mergers, expansions, acquisitions, and joint ventures with some other businesses are popular techniques for enhancing a market presence and expanding its business. Tate & Lyle, for example, teamed with Sweet Green Fields in2017 to produce and promote anew type of stevia worldwide.
The United Kingdom is a strong market for food additives due to its massive population and prospective consumer base. Furthermore, the region is seeing rapid growth in the field of new & innovative product releases and developments. Big corporations are planning to expand their businesses in order to expand their market share and are spending to boost the manufacturing capacity of the UK.
India's market for food additives is having a promising future due to recent trends and changing lifestyles of consumers
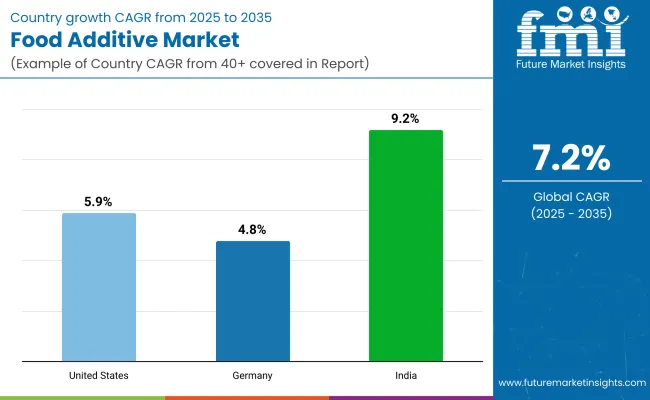
The Food Additives Market in India is predicted to develop at a CAGR (Compound annual growth rate)of 6.5%from the year2022 to 2032. India's growing food processing industry is propelling the nation's food additives market. A rising emphasis on improved lifestyles, an expanding workforce, and increased knowledge of quality foods are driving the country's need for food additives. Consumers around the country are becoming increasingly concerned about food safety and quality. About 25% of all food produced is considered to be wasted after harvest due to microbial activity. Foodborne disease outbreaks, adulteration occurrences, and toxicity are all on the rise, making food safety a major worry. Such variables would have a significant effect on the Indian food additives market.
In India, the beverage business has exploded in recent years. This is linked to the growing convenience trend and consumption from the young generation. Consumption of food additives in the region is being driven by a surge in consumption of non-alcoholic drinks that have tropical flavors infused in the msuch as various juices, carbonated drinks, and tonic water.

A unified Market Research Subscription Platform, built for today's disparate research needs.
Scope of Report
Attribute |
Details |
Market Size Value in 2021 |
USD 1800 Mn |
Market Forecast Value in 2032 |
USD 3410 Mn |
Global Growth Rate (2022 to 2032) |
6.6% CAGR |
Forecast Period |
2022-2032 |
Historical Data Available for |
2017-2021 |
Market Analysis |
MT for Volume and USD Mn for Value |
Key Regions Covered |
Europe, Asia Pacific, North America, Latin America, Europe, and the Middle East |
Key Countries Covered |
Key Countries Covered United States, Canada, EU, China, ASEAN, Japan, GCC countries others. |
Key Market Segments |
Product Type, Source, Application & Region |
Key Companies Profiled |
Alpha Ingredients Srl, Cargill Incorporated, Ajinomoto Co. Inc, Du Pont de Nemours and Company, Kerry Group, Novozymes A/S, Tate & Lyle PLC, Ingredion Incorporated, and others |
Pricing |
Available upon Request |
Segmentation for Food Additive Market
By Product Type:
- Preservatives
- Hydrocolloids
- Acidity Regulators
- Emulsifiers
- Flavoring Agents
- Food color
- Sweeteners
- Enzymes
By Source:
- Synthetic
- Natural
By Application:
- Frozen Desserts & Dairy products
- Confectionery & Bakery
- Convenience Food & Snacks (Processed & Frozen)
- Meat & Poultry Products
- Beverages
- Others (soups, baby food, and sauces)
Key Regions/Countries Covered:
- East Asia
- South Asia
- Latin and South America
- North America
- Oceania
- Europe
- Middle East & Africa
Frequently Asked Questions
Currently Food Additive consumer market is worth more than USD 6.5 Bn.
Food Additive consumption is expected to grow at a CAGR of around 6.6% during the period 2022-2032.
A healthy lifestyle, an increasing number of supermarkets, hypermarkets, a hectic lifestyle, increase demand for processed foods, demand for convenient foods like ready-to-eat products, demand for tasty and flavorful experiences in beverages can be considered key trends boosting the Food Additive market.
Market players are opting for technological advancement, new product developments, and production capacity expansion.
The top 3 producers of Food Additive hold around 32.3% of the market share.
The US, Germany, UK, and China are the major countries driving demand for Food additives.
The major players involved in the Food Additive market are Alpha Ingredients Srl, Cargill Incorporated, Ajinomoto Co. Inc, Du Pont de Nemours and Company, Kerry Group, Novozymes A/S, Tate & Lyle PLC, Ingredion Incorporated, and others
US Food Additive consumer market is projected to grow at a CAGR of around 4.5% over the next ten years.
The report presents a detailed cost analysis of fusion beverage based on nature i.e. organic and conventional.
Table of Content
1. Executive Summary
1.1. Global Market Outlook
1.2. Demand-side Trends
1.3. Supply-side Trends
1.4. Technology Roadmap Analysis
1.5. Analysis and Recommendations
2. Market Overview
2.1. Market Coverage / Taxonomy
2.2. Market Definition / Scope / Limitations
3. Market Background
3.1. Market Dynamics
3.1.1. Drivers
3.1.2. Restraints
3.1.3. Opportunity
3.1.4. Trends
3.2. Scenario Forecast
3.2.1. Demand in Optimistic Scenario
3.2.2. Demand in Likely Scenario
3.2.3. Demand in Conservative Scenario
3.3. Product launches & Recent Developments
3.4. Product Life Cycle Analysis
3.5. Value Chain Analysis
3.5.1. Supply Side Participants and their Roles
3.5.1.1. Producers
3.5.1.2. Mid-Level Participants (Traders/ Agents/ Brokers)
3.5.1.3. Wholesalers and Distributors
3.5.2. % of Operating Margin Analysis
3.5.3. List of Raw Material Suppliers
3.5.4. List of Existing and Potential Buyer’s
3.6. Product Claims & Nutritional Information Scan by Buyers
3.7. Forecast Factors - Relevance & Impact
3.8. PESTLE and Porter’s Analysis
3.9. Regulatory Landscape
3.9.1. Packaging & Labelling Regulations
3.9.2. Certifications and Certifying Agency Overview
3.9.3. Import/Export Policies
3.10. Regional Parent Market Outlook
3.11. Consumers Survey Analysis
3.12. Macro-Economic Factors
4. Global Market Analysis 2017-2021 and Forecast, 2022-2032
4.1. Historical Market Size Value (US$ Mn) & Volume (MT) Analysis, 2017-2021
4.2. Current and Future Market Size Value (US$ Mn) & Volume (MT) Projections, 2022-2032
4.2.1. Y-o-Y Growth Trend Analysis
4.2.2. Absolute $ Opportunity Analysis
5. Global Market Analysis 2017-2021 and Forecast 2022-2032, By Product Type
5.1. Introduction / Key Findings
5.2. Historical Market Size Value (US$ Mn) & Volume (MT) Analysis By Product Type, 2017-2021
5.3. Current and Future Market Size Value (US$ Mn) & Volume (MT) Analysis and Forecast By Product Type, 2022-2032
5.3.1. Acidity Regulators
5.3.2. Colourants
5.3.3. Emulsifiers
5.3.4. Enzymes
5.3.5. Hydrocolloids
5.3.6. Flavouring Agents
5.3.7. Preservatives
5.3.8. Sweeteners
5.4. Y-o-Y Growth Trend Analysis By Product Type, 2017-2021
5.5. Absolute $ Opportunity Analysis By Product Type, 2022-2032
6. Global Market Analysis 2017-2021 and Forecast 2022-2032, By Source
6.1. Introduction / Key Findings
6.2. Historical Market Size Value (US$ Mn) & Volume (MT) Analysis By Source, 2017-2021
6.3. Current and Future Market Size Value (US$ Mn) & Volume (MT) Analysis and Forecast By Source, 2022-2032
6.3.1. Natural
6.3.2. Synthetic
6.4. Y-o-Y Growth Trend Analysis By Source, 2017-2021
6.5. Absolute $ Opportunity Analysis By Source, 2022-2032
7. Global Market Analysis 2017-2021 and Forecast 2022-2032, By Application
7.1. Introduction / Key Findings
7.2. Historical Market Size Value (US$ Mn) & Volume (MT) Analysis By Application, 2017-2021
7.3. Current and Future Market Size Value (US$ Mn) & Volume (MT) Analysis and Forecast By Application, 2022-2032
7.3.1. Bakery & Confectionery
7.3.2. Dairy & Frozen Desserts
7.3.3. Snacks & Convenience Food (Processed & Frozen)
7.3.4. Beverages
7.3.5. Meat & Poultry Products
7.3.6. Others (Sauces, Soups, and Baby Food)
7.4. Y-o-Y Growth Trend Analysis By Application, 2017-2021
7.5. Absolute $ Opportunity Analysis By Application, 2022-2032
8. Global Market Analysis 2017-2021 and Forecast 2022-2032, By Region
8.1. Introduction
8.2. Historical Market Size Value (US$ Mn) & Volume (MT) Analysis By Region, 2017-2021
8.3. Current Market Size Value (US$ Mn) & Volume (MT) Analysis and Forecast By Region, 2022-2032
8.3.1. North America
8.3.2. Latin America
8.3.3. Europe
8.3.4. East Asia
8.3.5. South Asia
8.3.6. Oceania
8.3.7. MEA
8.4. Market Attractiveness Analysis By Region
9. North America Market Analysis 2017-2021 and Forecast 2022-2032, By Country
9.1. Historical Market Size Value (US$ Mn) & Volume (MT) Trend Analysis By Market Taxonomy, 2017-2021
9.2. Market Size Value (US$ Mn) & Volume (MT) Forecast By Market Taxonomy, 2022-2032
9.2.1. By Country
9.2.1.1. U.S.
9.2.1.2. Canada
9.2.2. By Product Type
9.2.3. By Source
9.2.4. By Application
9.3. Market Attractiveness Analysis
9.3.1. By Country
9.3.2. By Product Type
9.3.3. By Source
9.3.4. By Application
9.4. Key Takeaways
10. Latin America Market Analysis 2017-2021 and Forecast 2022-2032, By Country
10.1. Historical Market Size Value (US$ Mn) & Volume (MT) Trend Analysis By Market Taxonomy, 2017-2021
10.2. Market Size Value (US$ Mn) & Volume (MT) Forecast By Market Taxonomy, 2022-2032
10.2.1. By Country
10.2.1.1. Brazil
10.2.1.2. Mexico
10.2.1.3. Argentina
10.2.1.4. Chile
10.2.1.5. Peru
10.2.1.6. Rest of Latin America
10.2.2. By Product Type
10.2.3. By Source
10.2.4. By Application
10.3. Market Attractiveness Analysis
10.3.1. By Country
10.3.2. By Product Type
10.3.3. By Source
10.3.4. By Application
10.4. Key Takeaways
11. Europe Market Analysis 2017-2021 and Forecast 2022-2032, By Country
11.1. Historical Market Size Value (US$ Mn) & Volume (MT) Trend Analysis By Market Taxonomy, 2017-2021
11.2. Market Size Value (US$ Mn) & Volume (MT) Forecast By Market Taxonomy, 2022-2032
11.2.1. By Country
11.2.1.1. Germany
11.2.1.2. Italy
11.2.1.3. France
11.2.1.4. U.K.
11.2.1.5. Spain
11.2.1.6. Russia
11.2.1.7. BENELUX
11.2.1.8. Poland
11.2.1.9. Nordic Countries
11.2.1.10. Rest of Europe
11.2.2. By Product Type
11.2.3. By Source
11.2.4. By Application
11.3. Market Attractiveness Analysis
11.3.1. By Country
11.3.2. By Product Type
11.3.3. By Source
11.3.4. By Application
11.4. Key Takeaways
12. East Asia Market Analysis 2017-2021 and Forecast 2022-2032, By Country
12.1. Historical Market Size Value (US$ Mn) & Volume (MT) Trend Analysis By Market Taxonomy, 2017-2021
12.2. Market Size Value (US$ Mn) & Volume (MT) Forecast By Market Taxonomy, 2022-2032
12.2.1. By Country
12.2.1.1. China
12.2.1.2. Japan
12.2.1.3. South Korea
12.2.2. By Product Type
12.2.3. By Source
12.2.4. By Application
12.3. Market Attractiveness Analysis
12.3.1. By Country
12.3.2. By Product Type
12.3.3. By Source
12.3.4. By Application
12.4. Key Takeaways
13. South Asia Market Analysis 2017-2021 and Forecast 2022-2032, By Country
13.1. Historical Market Size Value (US$ Mn) & Volume (MT) Trend Analysis By Market Taxonomy, 2017-2021
13.2. Market Size Value (US$ Mn) & Volume (MT) Forecast By Market Taxonomy, 2022-2032
13.2.1. By Country
13.2.1.1. India
13.2.1.2. Thailand
13.2.1.3. Malaysia
13.2.1.4. Indonesia
13.2.1.5. Rest of South Asia
13.2.2. By Product Type
13.2.3. By Source
13.2.4. By Application
13.3. Market Attractiveness Analysis
13.3.1. By Country
13.3.2. By Product Type
13.3.3. By Source
13.3.4. By Application
13.4. Key Takeaways
14. Oceania Market Analysis 2017-2021 and Forecast 2022-2032, By Country
14.1. Historical Market Size Value (US$ Mn) & Volume (MT) Trend Analysis By Market Taxonomy, 2017-2021
14.2. Market Size Value (US$ Mn) & Volume (MT) Forecast By Market Taxonomy, 2022-2032
14.2.1. By Country
14.2.1.1. Australia
14.2.1.2. New Zealand
14.2.2. By Product Type
14.2.3. By Source
14.2.4. By Application
14.3. Market Attractiveness Analysis
14.3.1. By Country
14.3.2. By Product Type
14.3.3. By Source
14.3.4. By Application
14.4. Key Takeaways
15. MEA Market Analysis 2017-2021 and Forecast 2022-2032, By Country
15.1. Historical Market Size Value (US$ Mn) & Volume (MT) Trend Analysis By Market Taxonomy, 2017-2021
15.2. Market Size Value (US$ Mn) & Volume (MT) Forecast By Market Taxonomy, 2022-2032
15.2.1. By Country
15.2.1.1. GCC Countries
15.2.1.2. South Africa
15.2.1.3. Central Africa
15.2.1.4. North Africa
15.2.2. By Product Type
15.2.3. By Source
15.2.4. By Application
15.3. Market Attractiveness Analysis
15.3.1. By Country
15.3.2. By Product Type
15.3.3. By Source
15.3.4. By Application
15.4. Key Takeaways
16. Key Countries Market Analysis
16.1. U.S.
16.1.1. Pricing Analysis
16.1.2. Market Share Analysis, 2021
16.1.2.1. By Product Type
16.1.2.2. By Source
16.1.2.3. By Application
16.2. Canada
16.2.1. Pricing Analysis
16.2.2. Market Share Analysis, 2021
16.2.2.1. By Product Type
16.2.2.2. By Source
16.2.2.3. By Application
16.3. Brazil
16.3.1. Pricing Analysis
16.3.2. Market Share Analysis, 2021
16.3.2.1. By Product Type
16.3.2.2. By Source
16.3.2.3. By Application
16.4. Mexico
16.4.1. Pricing Analysis
16.4.2. Market Share Analysis, 2021
16.4.2.1. By Product Type
16.4.2.2. By Source
16.4.2.3. By Application
16.5. Argentina
16.5.1. Pricing Analysis
16.5.2. Market Share Analysis, 2021
16.5.2.1. By Product Type
16.5.2.2. By Source
16.5.2.3. By Application
16.6. Chile
16.6.1. Pricing Analysis
16.6.2. Market Share Analysis, 2021
16.6.2.1. By Product Type
16.6.2.2. By Source
16.6.2.3. By Application
16.7. Peru
16.7.1. Pricing Analysis
16.7.2. Market Share Analysis, 2021
16.7.2.1. By Product Type
16.7.2.2. By Source
16.7.2.3. By Application
16.8. Germany
16.8.1. Pricing Analysis
16.8.2. Market Share Analysis, 2021
16.8.2.1. By Product Type
16.8.2.2. By Source
16.8.2.3. By Application
16.9. Italy
16.9.1. Pricing Analysis
16.9.2. Market Share Analysis, 2021
16.9.2.1. By Product Type
16.9.2.2. By Source
16.9.2.3. By Application
16.10. France
16.10.1. Pricing Analysis
16.10.2. Market Share Analysis, 2021
16.10.2.1. By Product Type
16.10.2.2. By Source
16.10.2.3. By Application
16.11. Spain
16.11.1. Pricing Analysis
16.11.2. Market Share Analysis, 2021
16.11.2.1. By Product Type
16.11.2.2. By Source
16.11.2.3. By Application
16.12. U.K.
16.12.1. Pricing Analysis
16.12.2. Market Share Analysis, 2021
16.12.2.1. By Product Type
16.12.2.2. By Source
16.12.2.3. By Application
16.13. Russia
16.13.1. Pricing Analysis
16.13.2. Market Share Analysis, 2021
16.13.2.1. By Product Type
16.13.2.2. By Source
16.13.2.3. By Application
16.14. Poland
16.14.1. Pricing Analysis
16.14.2. Market Share Analysis, 2021
16.14.2.1. By Product Type
16.14.2.2. By Source
16.14.2.3. By Application
16.15. BENELUX
16.15.1. Pricing Analysis
16.15.2. Market Share Analysis, 2021
16.15.2.1. By Product Type
16.15.2.2. By Source
16.15.2.3. By Application
16.16. Nordic Countries
16.16.1. Pricing Analysis
16.16.2. Market Share Analysis, 2021
16.16.2.1. By Product Type
16.16.2.2. By Source
16.16.2.3. By Application
16.17. China
16.17.1. Pricing Analysis
16.17.2. Market Share Analysis, 2021
16.17.2.1. By Product Type
16.17.2.2. By Source
16.17.2.3. By Application
16.18. Japan
16.18.1. Pricing Analysis
16.18.2. Market Share Analysis, 2021
16.18.2.1. By Product Type
16.18.2.2. By Source
16.18.2.3. By Application
16.19. South Korea
16.19.1. Pricing Analysis
16.19.2. Market Share Analysis, 2021
16.19.2.1. By Product Type
16.19.2.2. By Source
16.19.2.3. By Application
16.20. India
16.20.1. Pricing Analysis
16.20.2. Market Share Analysis, 2021
16.20.2.1. By Product Type
16.20.2.2. By Source
16.20.2.3. By Application
16.21. Thailand
16.21.1. Pricing Analysis
16.21.2. Market Share Analysis, 2021
16.21.2.1. By Product Type
16.21.2.2. By Source
16.21.2.3. By Application
16.22. Indonesia
16.22.1. Pricing Analysis
16.22.2. Market Share Analysis, 2021
16.22.2.1. By Product Type
16.22.2.2. By Source
16.22.2.3. By Application
16.23. Malaysia
16.23.1. Pricing Analysis
16.23.2. Market Share Analysis, 2021
16.23.2.1. By Product Type
16.23.2.2. By Source
16.23.2.3. By Application
16.24. Singapore
16.24.1. Pricing Analysis
16.24.2. Market Share Analysis, 2021
16.24.2.1. By Product Type
16.24.2.2. By Source
16.24.2.3. By Application
16.25. Australia
16.25.1. Pricing Analysis
16.25.2. Market Share Analysis, 2021
16.25.2.1. By Product Type
16.25.2.2. By Source
16.25.2.3. By Application
16.26. New Zealand
16.26.1. Pricing Analysis
16.26.2. Market Share Analysis, 2021
16.26.2.1. By Product Type
16.26.2.2. By Source
16.26.2.3. By Application
16.27. GCC Countries
16.27.1. Pricing Analysis
16.27.2. Market Share Analysis, 2021
16.27.2.1. By Product Type
16.27.2.2. By Source
16.27.2.3. By Application
16.28. South Africa
16.28.1. Pricing Analysis
16.28.2. Market Share Analysis, 2021
16.28.2.1. By Product Type
16.28.2.2. By Source
16.28.2.3. By Application
16.29. North Africa
16.29.1. Pricing Analysis
16.29.2. Market Share Analysis, 2021
16.29.2.1. By Product Type
16.29.2.2. By Source
16.29.2.3. By Application
16.30. Central Africa
16.30.1. Pricing Analysis
16.30.2. Market Share Analysis, 2021
16.30.2.1. By Product Type
16.30.2.2. By Source
16.30.2.3. By Application
17. Market Structure Analysis
17.1. Competition Dashboard
17.2. Competition Benchmarking
17.3. Market Share Analysis of Top Players
17.3.1. By Regional
17.3.2. By Product Type
17.3.3. By Source
17.3.4. By Application
18. Competition Analysis
18.1. Competition Deep Dive
18.1.1. Ajinomoto Co., Inc.
18.1.1.1. Overview
18.1.1.2. Product Portfolio
18.1.1.3. Profitability by Market Segments (Product/Age /Sales Channel/Region)
18.1.1.4. Sales Footprint
18.1.1.5. Strategy Overview
18.1.1.5.1. Marketing Strategy
18.1.1.5.2. Product Strategy
18.1.1.5.3. Channel Strategy
18.1.2. Cargill Incorporated
18.1.2.1. Overview
18.1.2.2. Product Portfolio
18.1.2.3. Profitability by Market Segments (Product/Age /Sales Channel/Region)
18.1.2.4. Sales Footprint
18.1.2.5. Strategy Overview
18.1.2.5.1. Marketing Strategy
18.1.2.5.2. Product Strategy
18.1.2.5.3. Channel Strategy
18.1.3. Archer Daniels Midland
18.1.3.1. Overview
18.1.3.2. Product Portfolio
18.1.3.3. Profitability by Market Segments (Product/Age /Sales Channel/Region)
18.1.3.4. Sales Footprint
18.1.3.5. Strategy Overview
18.1.3.5.1. Marketing Strategy
18.1.3.5.2. Product Strategy
18.1.3.5.3. Channel Strategy
18.1.4. Alpha Ingredients Srl
18.1.4.1. Overview
18.1.4.2. Product Portfolio
18.1.4.3. Profitability by Market Segments (Product/Age /Sales Channel/Region)
18.1.4.4. Sales Footprint
18.1.4.5. Strategy Overview
18.1.4.5.1. Marketing Strategy
18.1.4.5.2. Product Strategy
18.1.4.5.3. Channel Strategy
18.1.5. Kerry Group
18.1.5.1. Overview
18.1.5.2. Product Portfolio
18.1.5.3. Profitability by Market Segments (Product/Age /Sales Channel/Region)
18.1.5.4. Sales Footprint
18.1.5.5. Strategy Overview
18.1.5.5.1. Marketing Strategy
18.1.5.5.2. Product Strategy
18.1.5.5.3. Channel Strategy
18.1.6. du Pont de Nemours Srl
18.1.6.1. Overview
18.1.6.2. Product Portfolio
18.1.6.3. Profitability by Market Segments (Product/Age /Sales Channel/Region)
18.1.6.4. Sales Footprint
18.1.6.5. Strategy Overview
18.1.6.5.1. Marketing Strategy
18.1.6.5.2. Product Strategy
18.1.6.5.3. Channel Strategy
18.1.7. Ingredion Incorporated
18.1.7.1. Overview
18.1.7.2. Product Portfolio
18.1.7.3. Profitability by Market Segments (Product/Age /Sales Channel/Region)
18.1.7.4. Sales Footprint
18.1.7.5. Strategy Overview
18.1.7.5.1. Marketing Strategy
18.1.7.5.2. Product Strategy
18.1.7.5.3. Channel Strategy
18.1.8. Hansen Holding A/S
18.1.8.1. Overview
18.1.8.2. Product Portfolio
18.1.8.3. Profitability by Market Segments (Product/Age /Sales Channel/Region)
18.1.8.4. Sales Footprint
18.1.8.5. Strategy Overview
18.1.8.5.1. Marketing Strategy
18.1.8.5.2. Product Strategy
18.1.8.5.3. Channel Strategy
18.1.9. BASF SE
18.1.9.1. Overview
18.1.9.2. Product Portfolio
18.1.9.3. Profitability by Market Segments (Product/Age /Sales Channel/Region)
18.1.9.4. Sales Footprint
18.1.9.5. Strategy Overview
18.1.9.5.1. Marketing Strategy
18.1.9.5.2. Product Strategy
18.1.9.5.3. Channel Strategy
18.1.10. Tate & Lyle PLC
18.1.10.1. Overview
18.1.10.2. Product Portfolio
18.1.10.3. Profitability by Market Segments (Product/Age /Sales Channel/Region)
18.1.10.4. Sales Footprint
18.1.10.5. Strategy Overview
18.1.10.5.1. Marketing Strategy
18.1.10.5.2. Product Strategy
18.1.10.5.3. Channel Strategy
18.1.11. Novozymes A/S
18.1.11.1. Overview
18.1.11.2. Product Portfolio
18.1.11.3. Profitability by Market Segments (Product/Age /Sales Channel/Region)
18.1.11.4. Sales Footprint
18.1.11.5. Strategy Overview
18.1.11.5.1. Marketing Strategy
18.1.11.5.2. Product Strategy
18.1.11.5.3. Channel Strategy
18.1.12. Others on Additional Request
18.1.12.1. Overview
18.1.12.2. Product Portfolio
18.1.12.3. Profitability by Market Segments (Product/Age /Sales Channel/Region)
18.1.12.4. Sales Footprint
18.1.12.5. Strategy Overview
18.1.12.5.1. Marketing Strategy
18.1.12.5.2. Product Strategy
18.1.12.5.3. Channel Strategy
19. Assumptions & Acronyms Used
20. Research Methodology
Let us know your requirement to get
100% FREE customization
List of Tables
Table 1: Global Market Value (US$ Mn) Forecast by Region, 2017-2032
Table 2: Global Market Volume (MT) Forecast by Region, 2017-2032
Table 3: Global Market Value (US$ Mn) Forecast by Product Type, 2017-2032
Table 4: Global Market Volume (MT) Forecast by Product Type, 2017-2032
Table 5: Global Market Value (US$ Mn) Forecast by Source, 2017-2032
Table 6: Global Market Volume (MT) Forecast by Source, 2017-2032
Table 7: Global Market Value (US$ Mn) Forecast by Application, 2017-2032
Table 8: Global Market Volume (MT) Forecast by Application, 2017-2032
Table 9: North America Market Value (US$ Mn) Forecast by Country, 2017-2032
Table 10: North America Market Volume (MT) Forecast by Country, 2017-2032
Table 11: North America Market Value (US$ Mn) Forecast by Product Type, 2017-2032
Table 12: North America Market Volume (MT) Forecast by Product Type, 2017-2032
Table 13: North America Market Value (US$ Mn) Forecast by Source, 2017-2032
Table 14: North America Market Volume (MT) Forecast by Source, 2017-2032
Table 15: North America Market Value (US$ Mn) Forecast by Application, 2017-2032
Table 16: North America Market Volume (MT) Forecast by Application, 2017-2032
Table 17: Latin America Market Value (US$ Mn) Forecast by Country, 2017-2032
Table 18: Latin America Market Volume (MT) Forecast by Country, 2017-2032
Table 19: Latin America Market Value (US$ Mn) Forecast by Product Type, 2017-2032
Table 20: Latin America Market Volume (MT) Forecast by Product Type, 2017-2032
Table 21: Latin America Market Value (US$ Mn) Forecast by Source, 2017-2032
Table 22: Latin America Market Volume (MT) Forecast by Source, 2017-2032
Table 23: Latin America Market Value (US$ Mn) Forecast by Application, 2017-2032
Table 24: Latin America Market Volume (MT) Forecast by Application, 2017-2032
Table 25: Europe Market Value (US$ Mn) Forecast by Country, 2017-2032
Table 26: Europe Market Volume (MT) Forecast by Country, 2017-2032
Table 27: Europe Market Value (US$ Mn) Forecast by Product Type, 2017-2032
Table 28: Europe Market Volume (MT) Forecast by Product Type, 2017-2032
Table 29: Europe Market Value (US$ Mn) Forecast by Source, 2017-2032
Table 30: Europe Market Volume (MT) Forecast by Source, 2017-2032
Table 31: Europe Market Value (US$ Mn) Forecast by Application, 2017-2032
Table 32: Europe Market Volume (MT) Forecast by Application, 2017-2032
Table 33: East Asia Market Value (US$ Mn) Forecast by Country, 2017-2032
Table 34: East Asia Market Volume (MT) Forecast by Country, 2017-2032
Table 35: East Asia Market Value (US$ Mn) Forecast by Product Type, 2017-2032
Table 36: East Asia Market Volume (MT) Forecast by Product Type, 2017-2032
Table 37: East Asia Market Value (US$ Mn) Forecast by Source, 2017-2032
Table 38: East Asia Market Volume (MT) Forecast by Source, 2017-2032
Table 39: East Asia Market Value (US$ Mn) Forecast by Application, 2017-2032
Table 40: East Asia Market Volume (MT) Forecast by Application, 2017-2032
Table 41: South Asia Market Value (US$ Mn) Forecast by Country, 2017-2032
Table 42: South Asia Market Volume (MT) Forecast by Country, 2017-2032
Table 43: South Asia Market Value (US$ Mn) Forecast by Product Type, 2017-2032
Table 44: South Asia Market Volume (MT) Forecast by Product Type, 2017-2032
Table 45: South Asia Market Value (US$ Mn) Forecast by Source, 2017-2032
Table 46: South Asia Market Volume (MT) Forecast by Source, 2017-2032
Table 47: South Asia Market Value (US$ Mn) Forecast by Application, 2017-2032
Table 48: South Asia Market Volume (MT) Forecast by Application, 2017-2032
Table 49: Oceania Market Value (US$ Mn) Forecast by Country, 2017-2032
Table 50: Oceania Market Volume (MT) Forecast by Country, 2017-2032
Table 51: Oceania Market Value (US$ Mn) Forecast by Product Type, 2017-2032
Table 52: Oceania Market Volume (MT) Forecast by Product Type, 2017-2032
Table 53: Oceania Market Value (US$ Mn) Forecast by Source, 2017-2032
Table 54: Oceania Market Volume (MT) Forecast by Source, 2017-2032
Table 55: Oceania Market Value (US$ Mn) Forecast by Application, 2017-2032
Table 56: Oceania Market Volume (MT) Forecast by Application, 2017-2032
Table 57: MEA Market Value (US$ Mn) Forecast by Country, 2017-2032
Table 58: MEA Market Volume (MT) Forecast by Country, 2017-2032
Table 59: MEA Market Value (US$ Mn) Forecast by Product Type, 2017-2032
Table 60: MEA Market Volume (MT) Forecast by Product Type, 2017-2032
Table 61: MEA Market Value (US$ Mn) Forecast by Source, 2017-2032
Table 62: MEA Market Volume (MT) Forecast by Source, 2017-2032
Table 63: MEA Market Value (US$ Mn) Forecast by Application, 2017-2032
Table 64: MEA Market Volume (MT) Forecast by Application, 2017-2032
Find your sweet spots for generating winning opportunities in this market.
Talk to AnalystList of Charts
Figure 1: Global Market Value (US$ Mn) by Product Type, 2022-2032
Figure 2: Global Market Value (US$ Mn) by Source, 2022-2032
Figure 3: Global Market Value (US$ Mn) by Application, 2022-2032
Figure 4: Global Market Value (US$ Mn) by Region, 2022-2032
Figure 5: Global Market Value (US$ Mn) Analysis by Region, 2017-2032
Figure 6: Global Market Volume (MT) Analysis by Region, 2017-2032
Figure 7: Global Market Value Share (%) and BPS Analysis by Region, 2022-2032
Figure 8: Global Market Y-o-Y Growth (%) Projections by Region, 2022-2032
Figure 9: Global Market Value (US$ Mn) Analysis by Product Type, 2017-2032
Figure 10: Global Market Volume (MT) Analysis by Product Type, 2017-2032
Figure 11: Global Market Value Share (%) and BPS Analysis by Product Type, 2022-2032
Figure 12: Global Market Y-o-Y Growth (%) Projections by Product Type, 2022-2032
Figure 13: Global Market Value (US$ Mn) Analysis by Source, 2017-2032
Figure 14: Global Market Volume (MT) Analysis by Source, 2017-2032
Figure 15: Global Market Value Share (%) and BPS Analysis by Source, 2022-2032
Figure 16: Global Market Y-o-Y Growth (%) Projections by Source, 2022-2032
Figure 17: Global Market Value (US$ Mn) Analysis by Application, 2017-2032
Figure 18: Global Market Volume (MT) Analysis by Application, 2017-2032
Figure 19: Global Market Value Share (%) and BPS Analysis by Application, 2022-2032
Figure 20: Global Market Y-o-Y Growth (%) Projections by Application, 2022-2032
Figure 21: Global Market Attractiveness by Product Type, 2022-2032
Figure 22: Global Market Attractiveness by Source, 2022-2032
Figure 23: Global Market Attractiveness by Application, 2022-2032
Figure 24: Global Market Attractiveness by Region, 2022-2032
Figure 25: North America Market Value (US$ Mn) by Product Type, 2022-2032
Figure 26: North America Market Value (US$ Mn) by Source, 2022-2032
Figure 27: North America Market Value (US$ Mn) by Application, 2022-2032
Figure 28: North America Market Value (US$ Mn) by Country, 2022-2032
Figure 29: North America Market Value (US$ Mn) Analysis by Country, 2017-2032
Figure 30: North America Market Volume (MT) Analysis by Country, 2017-2032
Figure 31: North America Market Value Share (%) and BPS Analysis by Country, 2022-2032
Figure 32: North America Market Y-o-Y Growth (%) Projections by Country, 2022-2032
Figure 33: North America Market Value (US$ Mn) Analysis by Product Type, 2017-2032
Figure 34: North America Market Volume (MT) Analysis by Product Type, 2017-2032
Figure 35: North America Market Value Share (%) and BPS Analysis by Product Type, 2022-2032
Figure 36: North America Market Y-o-Y Growth (%) Projections by Product Type, 2022-2032
Figure 37: North America Market Value (US$ Mn) Analysis by Source, 2017-2032
Figure 38: North America Market Volume (MT) Analysis by Source, 2017-2032
Figure 39: North America Market Value Share (%) and BPS Analysis by Source, 2022-2032
Figure 40: North America Market Y-o-Y Growth (%) Projections by Source, 2022-2032
Figure 41: North America Market Value (US$ Mn) Analysis by Application, 2017-2032
Figure 42: North America Market Volume (MT) Analysis by Application, 2017-2032
Figure 43: North America Market Value Share (%) and BPS Analysis by Application, 2022-2032
Figure 44: North America Market Y-o-Y Growth (%) Projections by Application, 2022-2032
Figure 45: North America Market Attractiveness by Product Type, 2022-2032
Figure 46: North America Market Attractiveness by Source, 2022-2032
Figure 47: North America Market Attractiveness by Application, 2022-2032
Figure 48: North America Market Attractiveness by Country, 2022-2032
Figure 49: Latin America Market Value (US$ Mn) by Product Type, 2022-2032
Figure 50: Latin America Market Value (US$ Mn) by Source, 2022-2032
Figure 51: Latin America Market Value (US$ Mn) by Application, 2022-2032
Figure 52: Latin America Market Value (US$ Mn) by Country, 2022-2032
Figure 53: Latin America Market Value (US$ Mn) Analysis by Country, 2017-2032
Figure 54: Latin America Market Volume (MT) Analysis by Country, 2017-2032
Figure 55: Latin America Market Value Share (%) and BPS Analysis by Country, 2022-2032
Figure 56: Latin America Market Y-o-Y Growth (%) Projections by Country, 2022-2032
Figure 57: Latin America Market Value (US$ Mn) Analysis by Product Type, 2017-2032
Figure 58: Latin America Market Volume (MT) Analysis by Product Type, 2017-2032
Figure 59: Latin America Market Value Share (%) and BPS Analysis by Product Type, 2022-2032
Figure 60: Latin America Market Y-o-Y Growth (%) Projections by Product Type, 2022-2032
Figure 61: Latin America Market Value (US$ Mn) Analysis by Source, 2017-2032
Figure 62: Latin America Market Volume (MT) Analysis by Source, 2017-2032
Figure 63: Latin America Market Value Share (%) and BPS Analysis by Source, 2022-2032
Figure 64: Latin America Market Y-o-Y Growth (%) Projections by Source, 2022-2032
Figure 65: Latin America Market Value (US$ Mn) Analysis by Application, 2017-2032
Figure 66: Latin America Market Volume (MT) Analysis by Application, 2017-2032
Figure 67: Latin America Market Value Share (%) and BPS Analysis by Application, 2022-2032
Figure 68: Latin America Market Y-o-Y Growth (%) Projections by Application, 2022-2032
Figure 69: Latin America Market Attractiveness by Product Type, 2022-2032
Figure 70: Latin America Market Attractiveness by Source, 2022-2032
Figure 71: Latin America Market Attractiveness by Application, 2022-2032
Figure 72: Latin America Market Attractiveness by Country, 2022-2032
Figure 73: Europe Market Value (US$ Mn) by Product Type, 2022-2032
Figure 74: Europe Market Value (US$ Mn) by Source, 2022-2032
Figure 75: Europe Market Value (US$ Mn) by Application, 2022-2032
Figure 76: Europe Market Value (US$ Mn) by Country, 2022-2032
Figure 77: Europe Market Value (US$ Mn) Analysis by Country, 2017-2032
Figure 78: Europe Market Volume (MT) Analysis by Country, 2017-2032
Figure 79: Europe Market Value Share (%) and BPS Analysis by Country, 2022-2032
Figure 80: Europe Market Y-o-Y Growth (%) Projections by Country, 2022-2032
Figure 81: Europe Market Value (US$ Mn) Analysis by Product Type, 2017-2032
Figure 82: Europe Market Volume (MT) Analysis by Product Type, 2017-2032
Figure 83: Europe Market Value Share (%) and BPS Analysis by Product Type, 2022-2032
Figure 84: Europe Market Y-o-Y Growth (%) Projections by Product Type, 2022-2032
Figure 85: Europe Market Value (US$ Mn) Analysis by Source, 2017-2032
Figure 86: Europe Market Volume (MT) Analysis by Source, 2017-2032
Figure 87: Europe Market Value Share (%) and BPS Analysis by Source, 2022-2032
Figure 88: Europe Market Y-o-Y Growth (%) Projections by Source, 2022-2032
Figure 89: Europe Market Value (US$ Mn) Analysis by Application, 2017-2032
Figure 90: Europe Market Volume (MT) Analysis by Application, 2017-2032
Figure 91: Europe Market Value Share (%) and BPS Analysis by Application, 2022-2032
Figure 92: Europe Market Y-o-Y Growth (%) Projections by Application, 2022-2032
Figure 93: Europe Market Attractiveness by Product Type, 2022-2032
Figure 94: Europe Market Attractiveness by Source, 2022-2032
Figure 95: Europe Market Attractiveness by Application, 2022-2032
Figure 96: Europe Market Attractiveness by Country, 2022-2032
Figure 97: East Asia Market Value (US$ Mn) by Product Type, 2022-2032
Figure 98: East Asia Market Value (US$ Mn) by Source, 2022-2032
Figure 99: East Asia Market Value (US$ Mn) by Application, 2022-2032
Figure 100: East Asia Market Value (US$ Mn) by Country, 2022-2032
Figure 101: East Asia Market Value (US$ Mn) Analysis by Country, 2017-2032
Figure 102: East Asia Market Volume (MT) Analysis by Country, 2017-2032
Figure 103: East Asia Market Value Share (%) and BPS Analysis by Country, 2022-2032
Figure 104: East Asia Market Y-o-Y Growth (%) Projections by Country, 2022-2032
Figure 105: East Asia Market Value (US$ Mn) Analysis by Product Type, 2017-2032
Figure 106: East Asia Market Volume (MT) Analysis by Product Type, 2017-2032
Figure 107: East Asia Market Value Share (%) and BPS Analysis by Product Type, 2022-2032
Figure 108: East Asia Market Y-o-Y Growth (%) Projections by Product Type, 2022-2032
Figure 109: East Asia Market Value (US$ Mn) Analysis by Source, 2017-2032
Figure 110: East Asia Market Volume (MT) Analysis by Source, 2017-2032
Figure 111: East Asia Market Value Share (%) and BPS Analysis by Source, 2022-2032
Figure 112: East Asia Market Y-o-Y Growth (%) Projections by Source, 2022-2032
Figure 113: East Asia Market Value (US$ Mn) Analysis by Application, 2017-2032
Figure 114: East Asia Market Volume (MT) Analysis by Application, 2017-2032
Figure 115: East Asia Market Value Share (%) and BPS Analysis by Application, 2022-2032
Figure 116: East Asia Market Y-o-Y Growth (%) Projections by Application, 2022-2032
Figure 117: East Asia Market Attractiveness by Product Type, 2022-2032
Figure 118: East Asia Market Attractiveness by Source, 2022-2032
Figure 119: East Asia Market Attractiveness by Application, 2022-2032
Figure 120: East Asia Market Attractiveness by Country, 2022-2032
Figure 121: South Asia Market Value (US$ Mn) by Product Type, 2022-2032
Figure 122: South Asia Market Value (US$ Mn) by Source, 2022-2032
Figure 123: South Asia Market Value (US$ Mn) by Application, 2022-2032
Figure 124: South Asia Market Value (US$ Mn) by Country, 2022-2032
Figure 125: South Asia Market Value (US$ Mn) Analysis by Country, 2017-2032
Figure 126: South Asia Market Volume (MT) Analysis by Country, 2017-2032
Figure 127: South Asia Market Value Share (%) and BPS Analysis by Country, 2022-2032
Figure 128: South Asia Market Y-o-Y Growth (%) Projections by Country, 2022-2032
Figure 129: South Asia Market Value (US$ Mn) Analysis by Product Type, 2017-2032
Figure 130: South Asia Market Volume (MT) Analysis by Product Type, 2017-2032
Figure 131: South Asia Market Value Share (%) and BPS Analysis by Product Type, 2022-2032
Figure 132: South Asia Market Y-o-Y Growth (%) Projections by Product Type, 2022-2032
Figure 133: South Asia Market Value (US$ Mn) Analysis by Source, 2017-2032
Figure 134: South Asia Market Volume (MT) Analysis by Source, 2017-2032
Figure 135: South Asia Market Value Share (%) and BPS Analysis by Source, 2022-2032
Figure 136: South Asia Market Y-o-Y Growth (%) Projections by Source, 2022-2032
Figure 137: South Asia Market Value (US$ Mn) Analysis by Application, 2017-2032
Figure 138: South Asia Market Volume (MT) Analysis by Application, 2017-2032
Figure 139: South Asia Market Value Share (%) and BPS Analysis by Application, 2022-2032
Figure 140: South Asia Market Y-o-Y Growth (%) Projections by Application, 2022-2032
Figure 141: South Asia Market Attractiveness by Product Type, 2022-2032
Figure 142: South Asia Market Attractiveness by Source, 2022-2032
Figure 143: South Asia Market Attractiveness by Application, 2022-2032
Figure 144: South Asia Market Attractiveness by Country, 2022-2032
Figure 145: Oceania Market Value (US$ Mn) by Product Type, 2022-2032
Figure 146: Oceania Market Value (US$ Mn) by Source, 2022-2032
Figure 147: Oceania Market Value (US$ Mn) by Application, 2022-2032
Figure 148: Oceania Market Value (US$ Mn) by Country, 2022-2032
Figure 149: Oceania Market Value (US$ Mn) Analysis by Country, 2017-2032
Figure 150: Oceania Market Volume (MT) Analysis by Country, 2017-2032
Figure 151: Oceania Market Value Share (%) and BPS Analysis by Country, 2022-2032
Figure 152: Oceania Market Y-o-Y Growth (%) Projections by Country, 2022-2032
Figure 153: Oceania Market Value (US$ Mn) Analysis by Product Type, 2017-2032
Figure 154: Oceania Market Volume (MT) Analysis by Product Type, 2017-2032
Figure 155: Oceania Market Value Share (%) and BPS Analysis by Product Type, 2022-2032
Figure 156: Oceania Market Y-o-Y Growth (%) Projections by Product Type, 2022-2032
Figure 157: Oceania Market Value (US$ Mn) Analysis by Source, 2017-2032
Figure 158: Oceania Market Volume (MT) Analysis by Source, 2017-2032
Figure 159: Oceania Market Value Share (%) and BPS Analysis by Source, 2022-2032
Figure 160: Oceania Market Y-o-Y Growth (%) Projections by Source, 2022-2032
Figure 161: Oceania Market Value (US$ Mn) Analysis by Application, 2017-2032
Figure 162: Oceania Market Volume (MT) Analysis by Application, 2017-2032
Figure 163: Oceania Market Value Share (%) and BPS Analysis by Application, 2022-2032
Figure 164: Oceania Market Y-o-Y Growth (%) Projections by Application, 2022-2032
Figure 165: Oceania Market Attractiveness by Product Type, 2022-2032
Figure 166: Oceania Market Attractiveness by Source, 2022-2032
Figure 167: Oceania Market Attractiveness by Application, 2022-2032
Figure 168: Oceania Market Attractiveness by Country, 2022-2032
Figure 169: MEA Market Value (US$ Mn) by Product Type, 2022-2032
Figure 170: MEA Market Value (US$ Mn) by Source, 2022-2032
Figure 171: MEA Market Value (US$ Mn) by Application, 2022-2032
Figure 172: MEA Market Value (US$ Mn) by Country, 2022-2032
Figure 173: MEA Market Value (US$ Mn) Analysis by Country, 2017-2032
Figure 174: MEA Market Volume (MT) Analysis by Country, 2017-2032
Figure 175: MEA Market Value Share (%) and BPS Analysis by Country, 2022-2032
Figure 176: MEA Market Y-o-Y Growth (%) Projections by Country, 2022-2032
Figure 177: MEA Market Value (US$ Mn) Analysis by Product Type, 2017-2032
Figure 178: MEA Market Volume (MT) Analysis by Product Type, 2017-2032
Figure 179: MEA Market Value Share (%) and BPS Analysis by Product Type, 2022-2032
Figure 180: MEA Market Y-o-Y Growth (%) Projections by Product Type, 2022-2032
Figure 181: MEA Market Value (US$ Mn) Analysis by Source, 2017-2032
Figure 182: MEA Market Volume (MT) Analysis by Source, 2017-2032
Figure 183: MEA Market Value Share (%) and BPS Analysis by Source, 2022-2032
Figure 184: MEA Market Y-o-Y Growth (%) Projections by Source, 2022-2032
Figure 185: MEA Market Value (US$ Mn) Analysis by Application, 2017-2032
Figure 186: MEA Market Volume (MT) Analysis by Application, 2017-2032
Figure 187: MEA Market Value Share (%) and BPS Analysis by Application, 2022-2032
Figure 188: MEA Market Y-o-Y Growth (%) Projections by Application, 2022-2032
Figure 189: MEA Market Attractiveness by Product Type, 2022-2032
Figure 190: MEA Market Attractiveness by Source, 2022-2032
Figure 191: MEA Market Attractiveness by Application, 2022-2032
Figure 192: MEA Market Attractiveness by Country, 2022-2032
Need specific information?
Request CustomizationExplore Food and Beverage Insights
View Reports