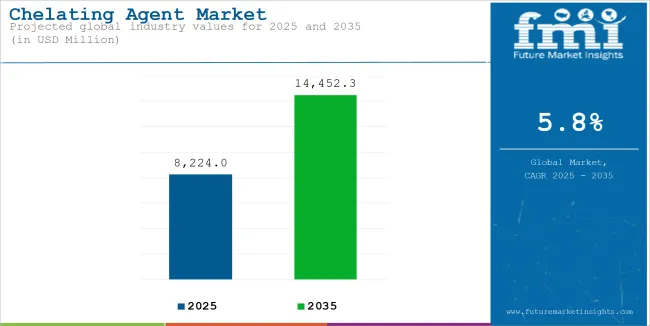
The global chelating agents market is estimated at USD 8.5 billion in 2025, with projections reaching USD 15.1 billion by 2035, reflecting a compound annual growth rate (CAGR) of 5.8% across the forecast period.
Trends in product innovation have continued through early 2025. In April, BASF introduced Trilon G, a partially bio-based GLDA (L Glutamate Diacetate) chelating agent tailored for institutional and industrial cleaning applications. Trilon G is biodegradable and contains approximately 56% renewable carbon. Amita Gupta, Vice President of Home Care & I&I Cleaning Americas at BASF, said that “the launch of Trilon G represents a significant step forward in delivering on our commitment to both innovation and sustainability”.
Meanwhile, Nouryon received ISCC PLUS certification for its Netherlands-based production site in January 2025. This achievement enables the manufacture of chelates with 100% renewable carbon content. Brad Pearson, Vice President of Cleaning Goods at Nouryon, noted that the certification supports the production of “green chelating agents from up to 100% RCI biobased raw materials”.
New applications have emerged in the pharmaceutical and radiopharmaceutical sectors. A novel chelating agent was developed for PSMA-based prostate cancer treatments (Prostate-Specific Membrane Antigen). This agent reportedly mitigates toxicity in targeted radiopharmaceutical therapies, underpinning the expanding role of chelates in life science use cases.
Regulatory frameworks and eco-driven procurement practices are shaping demand patterns. Restrictions on traditional phosphonate-based builders in detergents have encouraged formulators to adopt more biodegradable agents, such as GLDA and MGDA (Methylglycinediacetic Acid). Similarly, increasingly strict industrial effluent norms in Europe and parts of Asia are motivating water treatment plants to switch to chelates with enhanced biodegradability and metal-removal efficiency.

| Metric | Value |
|---|---|
| Industry Size (2025E) | USD 8.5 billion |
| Industry Value (2035F) | USD 15.1 billion |
| CAGR (2025 to 2035) | 5.8% |
In North America, demand has been supported by environmental certification programs and state-level mandates related to wastewater discharge standards. Hybrid systems that combine chelating agents with biological treatment are gaining traction in municipal water treatment facilities.
In the construction and agriculture sectors, chelating agents are being deployed to enhance micronutrient uptake in soils and to stabilize trace metals in building materials. Pilot projects in California and the Netherlands are featuring chelate-treated fertilizers, with published field reports showing yield improvements and reduced metal leaching.
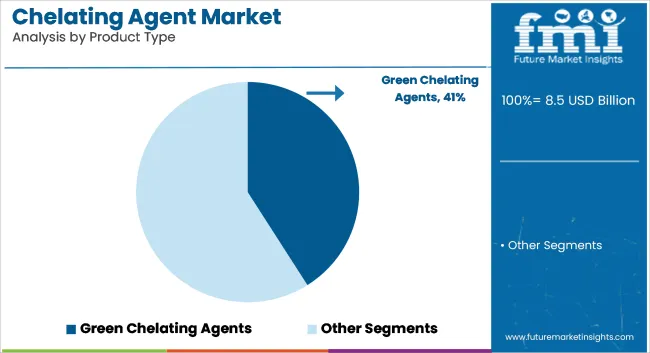
Green chelating agents are estimated to account for approximately 41% of the global chelating agents market share in 2025 and are projected to grow at a CAGR of 7.1% through 2035. Their rapid adoption is driven by increasing environmental regulations, the phase-out of phosphates, and rising demand for sustainable formulations in cleaning, water treatment, and industrial processing.
Green chelates such as GLDA (glutamic acid diacetic acid) and MGDA (methylglycine diacetic acid) are favored for their high biodegradability and compatibility with both alkaline and acidic systems. In industries such as household care, pulp & paper, and textile processing, formulators continue to replace conventional aminopolycarboxylates like EDTA with green alternatives to meet eco-label and regulatory requirements.
Manufacturers are investing in bio-based synthesis technologies and scaling up production capacities to meet global demand from formulators prioritizing environmental safety, without compromising chelation performance.

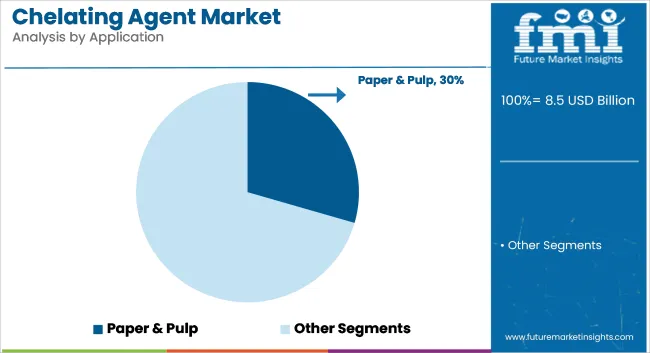
The pulp & paper industry is projected to hold approximately 29.5% of the global chelating agents market share in 2025 and is expected to grow at a CAGR of 4.4% through 2035. Chelating agents are extensively used in this segment to bind metal ions such as iron, manganese, and calcium, which otherwise interfere with peroxide-based bleaching and result in undesirable yellowing or reversion of brightness.
As paper mills move toward elemental chlorine-free (ECF) and total chlorine-free (TCF) bleaching systems, demand for high-performance and environmentally compliant chelators remains strong. In Europe and North America, green chelates are gaining preference, while developing regions continue to adopt cost-effective blends to balance performance and compliance.
The transition to recycled paper and deinking processes also supports additional demand for chelating agents, reinforcing the pulp & paper sector's position as a critical end-use industry in the market.

Stringent Environmental Regulations on Conventional Chelating Agents
The tightening regulation on non-biodegradable chelating agents including EDTA and NTA is one of the significant hurdles faced by the industry. In 2023, associated with the European Chemicals Agency (ECHA), EDTA was classified as a “persistent pollutant,” and industries well-health organizations were urged to phase it out.
Some chelating agents have also been nominated as priority chemicals by the USA EPA for monitoring because they can accumulate in water bodies. Such restrictions are forcing manufacturers to focus on R&D for biodegradable substitutes, which leads to increase in production costs and market inaccessibility.
Fluctuations in Raw Material Prices
Chelating agents are made from ethylene amines, acrylic acid and other petrochemical-derived feedstocks, which subject them to price volatility of crude oil. Production costs were further affected by the high volatility of global oil prices, which rose by 30% in 2022 due to supply chain disruptions and geopolitical conflicts.
And especially the sustainable bio-based raw materials for bio-based chelating agents are not widely available yet for bio-based chelating agents. Additionally, the increasing prices of natural chelating agents such as citric acid and amino acids present an additional barrier to widespread adoption in price-sensitive markets in regions such as Asia and Latin America.
Growth in Biodegradable Chelating Agents
For instance, MGDA and GLDA are biodegradable alternatives with similar metal-binding efficiency to EDTA offered by companies such as BASF and Nouryon. This is the 17th edition of the study and the analysis period is from 2013 to 2023 and in order to do that, Environmental regulations promoting sustainable chemicals will drive the Biodegradable Chelating Agents market, which is anticipated to expand at a significant CAGR of 6.5% over the next decade.
Such alternatives are now being developed by companies such as Unilever and Procter & Gamble(P&G) into formulations for cleaning and personal care products, indicating a significant change within the industry.
Rising Demand from the Agriculture Sector
The global market of chelated micronutrient fertilizer is projected to reach over USD 1.5 billion by 2030, driven by increasing soil degradation as well as growing deficiencies of micronutrients in crops. So to overcome the deficiency of micronutrient affecting plants from above we add chelating agents like EDTA, DTPA (Diethylene triamine pentaacetic acid), EDDHA (Ethylenediamine dihydroxyphenyl acetic acid).
As per the Food and Agriculture Organization (FAO), 30%-50% of the arable land worldwide is less effective in producing micronutrients such as zinc and iron, and, therefore, is also in need of chelates fertilizers to enhance crop production. The market of the global chelating agents will be significantly driven by the use of chelating agents in the agriculture sector due to rising food demand worldwide.
The growth of chelating agent-market is primarily attributed to the increasing availability of raw materials, application in a wide variety of industries, including wastewater treatment, agriculture, personal care, and others, and a moderate market growth rate.
The gloves are coming off as traditional chelating agents face increasing regulatory pressure, so the engineering industry seeks biodegradable and sustainable alternatives in light of new growth opportunities; The Asia-Pacific region is expected to remain the largest and fastest-growing market, while Europe and North America will lead in sustainable innovations and regulatory compliance.
The USA chelating agents market is experiencing positive growth owing to increasing usage in water treatment, pharmaceuticals and agricultural industries. Strict government environment-related regulations promoting the usage of the biodegradable chelating agents is anticipated to further propel the market. In addition, the rising usage of ecological cleaning in industries and detergents is promoting the growth of eco-friendly chelating agents.
Market Growth Factors
Market Forecast
| Country | CAGR (2025 to 2035) |
|---|---|
| United States | 5.8% |
The Scope for Chelating Agents is significantly increasing in the United Kingdom which is made up of a vibrant market for chelating agents due to their widespread availability as replacements for traditional chemicals that are increasingly being associated with numerous environmental concerns. While growth is being led by growth in end-use applications in personal care and cosmetics, as well as advancements in water treatment. Interest in green chelating agents R&D is growing in the market.
Market Growth Factors
Market Forecast
| Country | CAGR (2025 to 2035) |
|---|---|
| United Kingdom | 5.6% |
Regulatory regulations favouring sustainable and non-toxic options drive the European Union chelating agent market. The growth of the market is driven by factors such as rising demand for biodegradable chelating agents in household cleaning, agriculture and pharmaceuticals. In addition, the switch forward green chemistry initiatives are reshaping innovation in the industry.
Market Growth Factors
Market Forecast
| Country | CAGR (2025 to 2035) |
|---|---|
| European Union | 6.0% |
The growth of Japan's chelating agent sector is aided by an increase in industrial applications and advanced material processing. Market growth is boosted by the country’s emphasis on environmental sustainability and precision chemical formulations. Furthermore, technological advancements in biocompatible chelating agents will undoubtedly have an impact on the future of the industry.
Market Growth Factors
Market Forecast
| Country | CAGR (2025 to 2035) |
|---|---|
| Japan | 5.9% |
The South Korean chelating agent market is driven by the growing demand for chelating agents in water treatment, cosmetics, and agriculture. The swift industrialization across the country and strong inclination toward sustainable chemical-based solutions in various sectors are anticipated to contribute to the growth of the market. Demand is also being boosted by government policies in support of green chemistry initiatives.
Market Growth Factors
Market Forecast
| Country | CAGR (2025 to 2035) |
|---|---|
| South Korea | 6.2% |
Competitive Landscape Overview
The global market for Chelating Agents is driven by a growing demand for applications in water treatment, industrial cleaning, personal care and agricultural applications. To meet regulatory requirements and sustainability goals, key players are competing with each other in terms of high performance, biodegradable, and environmentally benign chelating agents.
There is an increase in market growth due to technology, environmental regulation, and high-efficiency chelating agent demand. Manufacturers are taking advantage of these developments with efficient production practices, bio-based formulations, and tailored solutions to supply various Industrial requirements.

Several mid-sized and emerging companies contribute to the Chelating Agent Market, offering specialized and cost-efficient solutions. Notable players include:
Companies
The market is estimated to reach a value of USD 8.5 billion by the end of 2025.
The market is projected to exhibit a CAGR of 5.8% over the assessment period.
The market is expected to clock revenue of USD 15.1 billion by end of 2035.
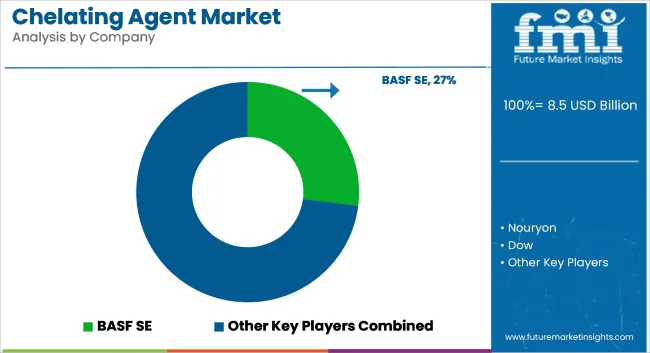
Key companies in the Chelating Agent market include BASF SE, Dow Inc., Kemira, Mitsubishi Chemical Corporation, Nippon Shokubai.
On the basis on application, water treatment to command significant share over the forecast period.
Figure 01: Global Market Historical Volume (tons), 2018 to 2022
Figure 02: Global Market Current and Forecast Volume (tons), 2023 to 2033
Figure 03: Global Market Historical Value (US$ Million), 2018 to 2022
Figure 04: Global Market Current and Forecast Value (US$ Million), 2023 to 2033
Figure 05: Global Market Incremental $ Opportunity (US$ Million), 2023 to 2033
Figure 06: Global Market Share and BPS Analysis By Product Type, 2023 to 2033
Figure 07: Global Market Y-o-Y Growth Projections By Product Type, 2023 to 2033
Figure 08: Global Market Attractiveness Analysis By Product Type, 2023 to 2033
Figure 09: Global Market Absolute $ Opportunity by Bio-Degradable Segment, 2018 to 2033
Figure 10: Global Market Absolute $ Opportunity by Non-Bio-Degradable Segment, 2018 to 2033
Figure 11: Global Market Share and BPS Analysis By Application, 2023 to 2033
Figure 12: Global Market Y-o-Y Growth Projections By Application, 2023 to 2033
Figure 13: Global Market Attractiveness Analysis By Application, 2023 to 2033
Figure 14: Global Market Absolute $ Opportunity by Water Treatment Segment, 2018 to 2033
Figure 15: Global Market Absolute $ Opportunity by Agriculture Segment, 2018 to 2033
Figure 16: Global Market Absolute $ Opportunity by Paper & Pulp Segment, 2018 to 2033
Figure 17: Global Market Absolute $ Opportunity by Pharmaceuticals Segment, 2018 to 2033
Figure 18: Global Market Absolute $ Opportunity by Food & Beverage Segment, 2018 to 2033
Figure 19: Global Market Absolute $ Opportunity by Chemical Processing Segment, 2018 to 2033
Figure 20: Global Market Absolute $ Opportunity by Household & Industrial Cleaning Segment, 2018 to 2033
Figure 21: Global Market Absolute $ Opportunity by Oil & Gas Segment, 2018 to 2033
Figure 22: Global Market Absolute $ Opportunity by Others Segment, 2018 to 2033
Figure 23: Global Market Share and BPS Analysis By Region, 2023 to 2033
Figure 24: Global Market Y-o-Y Growth Projections By Region, 2023 to 2033
Figure 25: Global Market Attractiveness Analysis By Region, 2023 to 2033
Figure 26: Global Market Absolute $ Opportunity by North America Segment, 2018 to 2033
Figure 27: Global Market Absolute $ Opportunity by Latin America Segment, 2018 to 2033
Figure 28: Global Market Absolute $ Opportunity by Western Europe Segment, 2018 to 2033
Figure 29: Global Market Absolute $ Opportunity by Eastern Europe Segment, 2018 to 2033
Figure 30: Global Market Absolute $ Opportunity by Russia & Belarus Segment, 2018 to 2033
Figure 31: Global Market Absolute $ Opportunity by Balkan and Baltic Segment, 2018 to 2033
Figure 32: Global Market Absolute $ Opportunity by Central Asia Segment, 2018 to 2033
Figure 33: Global Market Absolute $ Opportunity by South Asia Pacific Segment, 2018 to 2033
Figure 34: Global Market Absolute $ Opportunity by East Asia Segment, 2018 to 2033
Figure 35: Global Market Absolute $ Opportunity by Middle East and Africa Segment, 2018 to 2033
Figure 36: Global Market Absolute $ Opportunity by Association of Southeast Asian Nations Segment, 2018 to 2033
Figure 37: North America Market Share and BPS Analysis By Country, 2023 to 2033
Figure 38: North America Market Y-o-Y Growth Projections By Country, 2023 to 2033
Figure 39: North America Market Attractiveness Analysis By Country, 2023 to 2033
Figure 40: North America Market Share and BPS Analysis By Product Type, 2023 to 2033
Figure 41: North America Market Y-o-Y Growth Projections By Product Type, 2023 to 2033
Figure 42: North America Market Attractiveness Analysis By Product Type, 2023 to 2033
Figure 43: North America Market Share and BPS Analysis By Application, 2023 to 2033
Figure 44: North America Market Y-o-Y Growth Projections By Application, 2023 to 2033
Figure 45: North America Market Attractiveness Analysis By Application, 2023 to 2033
Figure 46: Latin America Market Share and BPS Analysis By Country, 2023 to 2033
Figure 47: Latin America Market Y-o-Y Growth Projections By Country, 2023 to 2033
Figure 48: Latin America Market Attractiveness Analysis By Country, 2023 to 2033
Figure 49: Latin America Market Share and BPS Analysis By Product Type, 2023 to 2033
Figure 50: Latin America Market Y-o-Y Growth Projections By Product Type, 2023 to 2033
Figure 51: Latin America Market Attractiveness Analysis By Product Type, 2023 to 2033
Figure 52: Latin America Market Share and BPS Analysis By Application, 2023 to 2033
Figure 53: Latin America Market Y-o-Y Growth Projections By Application, 2023 to 2033
Figure 54: Latin America Market Attractiveness Analysis By Application, 2023 to 2033
Figure 55: Western Europe Market Share and BPS Analysis By Country, 2023 to 2033
Figure 56: Western Europe Market Y-o-Y Growth Projections By Country, 2023 to 2033
Figure 57: Western Europe Market Attractiveness Analysis By Country, 2023 to 2033
Figure 58: Western Europe Market Share and BPS Analysis By Product Type, 2023 to 2033
Figure 59: Western Europe Market Y-o-Y Growth Projections By Product Type, 2023 to 2033
Figure 60: Western Europe Market Attractiveness Analysis By Product Type, 2023 to 2033
Figure 61: Western Europe Market Share and BPS Analysis By Application, 2023 to 2033
Figure 62: Western Europe Market Y-o-Y Growth Projections By Application, 2023 to 2033
Figure 63: Western Europe Market Attractiveness Analysis By Application, 2023 to 2033
Figure 64: Eastern Europe Market Share and BPS Analysis By Country, 2023 to 2033
Figure 65: Eastern Europe Market Y-o-Y Growth Projections By Country, 2023 to 2033
Figure 66: Eastern Europe Market Attractiveness Analysis By Country, 2023 to 2033
Figure 67: Eastern Europe Market Share and BPS Analysis By Product Type, 2023 to 2033
Figure 68: Eastern Europe Market Y-o-Y Growth Projections By Product Type, 2023 to 2033
Figure 69: Eastern Europe Market Attractiveness Analysis By Product Type, 2023 to 2033
Figure 70: Eastern Europe Market Share and BPS Analysis By Application, 2023 to 2033
Figure 71: Eastern Europe Market Y-o-Y Growth Projections By Application, 2023 to 2033
Figure 72: Eastern Europe Market Attractiveness Analysis By Application, 2023 to 2033
Figure 73: Central Asia Market Share and BPS Analysis By Product Type, 2023 to 2033
Figure 74: Central Asia Market Y-o-Y Growth Projections By Product Type, 2023 to 2033
Figure 75: Central Asia Market Attractiveness Analysis By Product Type, 2023 to 2033
Figure 76: Central Asia Market Share and BPS Analysis By Application, 2023 to 2033
Figure 77: Central Asia Market Y-o-Y Growth Projections By Application, 2023 to 2033
Figure 78: Central Asia Market Attractiveness Analysis By Application, 2023 to 2033
Figure 79: Russia & Belarus Market Share and BPS Analysis By Product Type, 2023 to 2033
Figure 80: Russia & Belarus Market Y-o-Y Growth Projections By Product Type, 2023 to 2033
Figure 81: Russia & Belarus Market Attractiveness Analysis By Product Type, 2023 to 2033
Figure 82: Russia & Belarus Market Share and BPS Analysis By Application, 2023 to 2033
Figure 83: Russia & Belarus Market Y-o-Y Growth Projections By Application, 2023 to 2033
Figure 84: Russia & Belarus Market Attractiveness Analysis By Application, 2023 to 2033
Figure 85: Balkan & Baltics Market Share and BPS Analysis By Product Type, 2023 to 2033
Figure 86: Balkan & Baltics Market Y-o-Y Growth Projections By Product Type, 2023 to 2033
Figure 87: Balkan & Baltics Market Attractiveness Analysis By Product Type, 2023 to 2033
Figure 88: Balkan & Baltics Market Share and BPS Analysis By Application, 2023 to 2033
Figure 89: Balkan & Baltics Market Y-o-Y Growth Projections By Application, 2023 to 2033
Figure 90: Balkan & Baltics Market Attractiveness Analysis By Application, 2023 to 2033
Figure 91: South Asia Pacific Market Share and BPS Analysis By Country, 2023 to 2033
Figure 92: South Asia Pacific Market Y-o-Y Growth Projections By Country, 2023 to 2033
Figure 93: South Asia Pacific Market Attractiveness Analysis By Country, 2023 to 2033
Figure 94: South Asia Pacific Market Share and BPS Analysis By Product Type, 2023 to 2033
Figure 95: South Asia Pacific Market Y-o-Y Growth Projections By Product Type, 2023 to 2033
Figure 96: South Asia Pacific Market Attractiveness Analysis By Product Type, 2023 to 2033
Figure 97: South Asia Pacific Market Share and BPS Analysis By Application, 2023 to 2033
Figure 98: South Asia Pacific Market Y-o-Y Growth Projections By Application, 2023 to 2033
Figure 99: South Asia Pacific Market Attractiveness Analysis By Application, 2023 to 2033
Figure 100: Association of Southeast Asian Nations Market Share and BPS Analysis By Country, 2023 to 2033
Figure 101: Association of Southeast Asian Nations Market Y-o-Y Growth Projections By Country, 2023 to 2033
Figure 102: Association of Southeast Asian Nations Market Attractiveness Analysis By Country, 2023 to 2033
Figure 103: Association of Southeast Asian Nations Market Share and BPS Analysis By Product Type, 2023 to 2033
Figure 104: Association of Southeast Asian Nations Market Y-o-Y Growth Projections By Product Type, 2023 to 2033
Figure 105: Association of Southeast Asian Nations Market Attractiveness Analysis By Product Type, 2023 to 2033
Figure 106: Association of Southeast Asian Nations Market Share and BPS Analysis By Application, 2023 to 2033
Figure 107: Association of Southeast Asian Nations Market Y-o-Y Growth Projections By Application, 2023 to 2033
Figure 108: Association of Southeast Asian Nations Market Attractiveness Analysis By Application, 2023 to 2033
Figure 109: East Asia Market Share and BPS Analysis By Country, 2023 to 2033
Figure 110: East Asia Market Y-o-Y Growth Projections By Country, 2023 to 2033
Figure 111: East Asia Market Attractiveness Analysis By Country, 2023 to 2033
Figure 112: East Asia Market Share and BPS Analysis By Product Type, 2023 to 2033
Figure 113: East Asia Market Y-o-Y Growth Projections By Product Type, 2023 to 2033
Figure 114: East Asia Market Attractiveness Analysis By Product Type, 2023 to 2033
Figure 115: East Asia Market Share and BPS Analysis By Application, 2023 to 2033
Figure 116: East Asia Market Y-o-Y Growth Projections By Application, 2023 to 2033
Figure 117: East Asia Market Attractiveness Analysis By Application, 2023 to 2033
Figure 118: Middle East and Africa Market Share and BPS Analysis By Country, 2023 to 2033
Figure 119: Middle East and Africa Market Y-o-Y Growth Projections By Country, 2023 to 2033
Figure 120: Middle East and Africa Market Attractiveness Analysis By Country, 2023 to 2033
Figure 121: Middle East and Africa Market Share and BPS Analysis By Product Type, 2023 to 2033
Figure 122: Middle East and Africa Market Y-o-Y Growth Projections By Product Type, 2023 to 2033
Figure 123: Middle East and Africa Market Attractiveness Analysis By Product Type, 2023 to 2033
Figure 124: Middle East and Africa Market Share and BPS Analysis By Application, 2023 to 2033
Figure 125: Middle East and Africa Market Y-o-Y Growth Projections By Application, 2023 to 2033
Figure 126: Middle East and Africa Market Attractiveness Analysis By Application, 2023 to 2033


Full Research Suite comprises of:
Market outlook & trends analysis
Interviews & case studies
Strategic recommendations
Vendor profiles & capabilities analysis
5-year forecasts
8 regions and 60+ country-level data splits
Market segment data splits
12 months of continuous data updates
DELIVERED AS:
PDF EXCEL ONLINE
Chelating / Sequestering Agents Market Size and Share Forecast Outlook 2025 to 2035
Industrial Plant Derived Chelating Agent Market Size and Share Forecast Outlook 2025 to 2035
Chelating Facial Masks Market Analysis - Size and Share Forecast Outlook 2025 to 2035
AI-Driven Agent-Based Modeling – Predictive Insights & Analysis
Reagent Bottle Market Growth & Industry Forecast 2025 to 2035
Reagent Filling Systems Market Analysis – Growth & Forecast 2024-2034
Fixing Agent Market Size and Share Forecast Outlook 2025 to 2035
Wetting Agent Market Size and Share Forecast Outlook 2025 to 2035
Matting Agents Market Size and Share Forecast Outlook 2025 to 2035
Healing Agents Market (Skin Repair & Soothing Actives) Market Size and Share Forecast Outlook 2025 to 2035
Foaming Agents Market Size and Share Forecast Outlook 2025 to 2035
Firming Agents Botox-Like Market Size and Share Forecast Outlook 2025 to 2035
Sealing Agent for Gold Market Size and Share Forecast Outlook 2025 to 2035
Heating Agents Market Size and Share Forecast Outlook 2025 to 2035
Cooling Agents Market Size and Share Forecast Outlook 2025 to 2035
Firming Agents Market Growth – Product Innovations & Applications from 2025 to 2035
Release Agent Market – Trends & Forecast 2025 to 2035
Gelling Agent Market Insights – Texture & Food Innovation 2025 to 2035
Raising Agents Market Trends – Growth & Industry Forecast 2024 to 2034
Weighing Agents Market Size and Share Forecast Outlook 2025 to 2035

Thank you!
You will receive an email from our Business Development Manager. Please be sure to check your SPAM/JUNK folder too.
Chat With
MaRIA