Leavening Agents Market Size and Share Forecast Outlook 2025 to 2035

The global leavening agents market is projected to grow from USD 6 billion in 2025 to USD 9.9 billion by 2035, registering a CAGR of 5.1%.
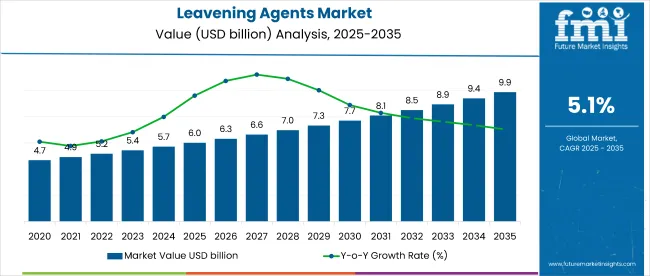
Quick Stats - Leavening Agents Market

  • Market Value (2025): USD 6 billion
  • Forecast Value (2035): USD 9.9 billion
  • Forecast CAGR: 5.1%
  • Form Leader in 2025: Biological (42.6% market share)
  • Top Application Segment: Food & Beverage (71% share)
  • Key Growth Region: East Asia (Japan is the fastest-growing market with a 6.5% CAGR)

Leavening Agents Market

Metric Value
Industry Size (2025E) USD 6 billion
Industry Value (2035F) USD 9.9 billion
CAGR (2025 to 2035) 5.1%

Growth in the market is being driven by shifting dietary preferences, an increase in demand for baked goods, and rising health awareness among consumers. The rise in home baking, adoption of clean-label ingredients, and expansion of gluten-free and low-carb diets have increased the use of natural and specialty rising compounds. Product innovations such as ready-to-use mixes, slow-release agents, and fermented sourdough-based solutions are driving adoption across both retail and industrial sectors.

These compounds account for an estimated 23% share of the bakery ingredients category, indicating their foundational role in baking formulations. Within the functional food ingredients space, they hold around 11% share, especially in products targeting health, digestibility, and clean-label positioning. Their contribution to the specialty food additives segment is about 9%, largely through processed foods and dairy-based snacks. In the broader food ingredients industry, they make up just 2%, while their presence across packaged foods remains under 0.5%, due to competition from a wider range of ingredient types.

Regulatory influence stems from food labeling mandates, allergen disclosure requirements, and food safety protocols. In the USA, FDA labeling guidelines and GRAS status monitoring impact the formulation of compounds containing phosphates or aluminum derivatives. In Europe, EFSA frameworks govern the purity and safety of chemical and biological agents. Global reformulation efforts are being shaped by demand for non-GMO yeast, allergen-free blends, and naturally fermented solutions.

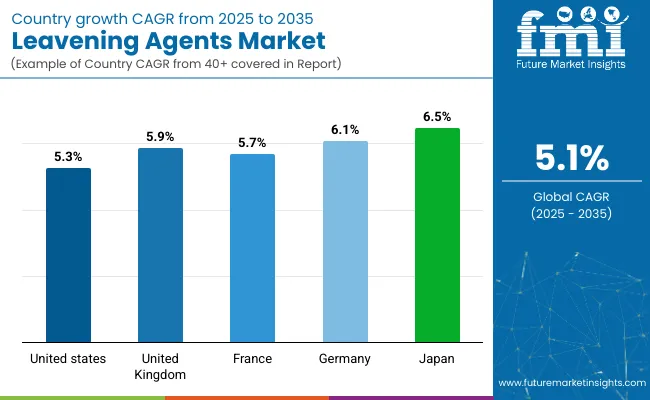
Japan is projected to be the fastest-growing market, expected to expandat a CAGR of 6.5% from 2025 to 2035. Biological will dominate the form segment with a 42.6% share, while food & beverage will lead with 71%. The USA and Germany markets are also expected to grow steadily, with CAGRs of 5.3% and 6.1%, respectively.

Leavening Agents Market Analysis by Top Investment Segments

The market is segmented by form, application, and region. By form, the market is divided into chemical, biological, and vaporous. In terms of application, the market bifurcated into food & beverage (bakery & confectionery, snack bars, processed foods, baked grain products, dairy products, cheese, spreads & margarines, and carbonated drinks) and personal & health care. Regionally, the market is classified into North America, Latin America, Europe, East Asia, South Asia, Oceania, and the Middle East & Africa.
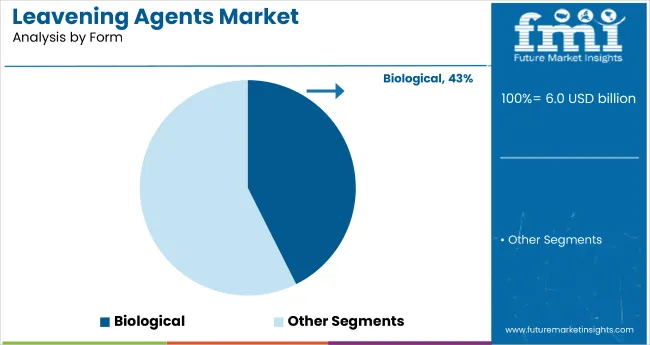
Biological to Lead the Form Segment with 42.6% Market Share in 2025

Leavening Agents Market Analysis By Form

Biological is expected to dominate the form segment, accounting for 42.6% of the global market share by 2025.
  • These agents are valued for their natural fermentation capabilities, aligning with the growing demand for clean-label and sustainable food products.
  • The increasing popularity of gluten-free and low-carb diets is further propelling demand for biologically derived leavening solutions in both retail and industrial baking sectors.

Food & Beverage to Dominate the Application Segment with 71% Market Share in 2025

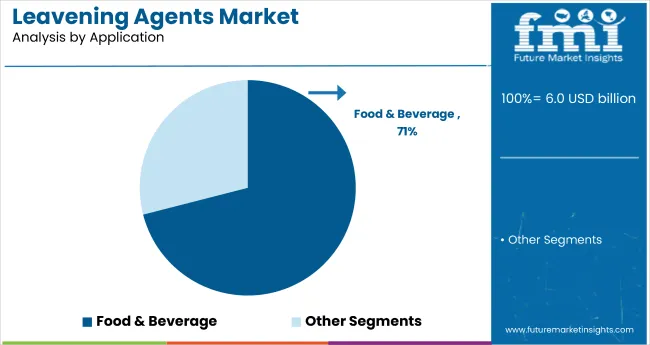
Leavening Agents Market Analysis By Application

Food & beverage is expected to lead the application segment, accounting for 71% of the market share by 2025.

  • Rising global consumption of bread, cakes, cookies, and pastries fuels this segment, especially in urban areas and developing markets.
  • Innovations in texture, flavor enhancement, and shelf-life extension through advanced leavening systems continue to drive demand in commercial and artisanal baking.

Top Leavening Agents Market Dynamics

The global leavening agents market is experiencing consistent growth, fueled by rising consumer demand for baked goods, clean-label ingredients, and healthier food options. Leavening agents play a pivotal role in enhancing texture, volume, and shelf life in various food and beverage applications, aligning with evolving dietary preferences and innovation in food processing.

Recent Trends in the Leavening Agents Market

  • Clean-label and natural leavening solutions are in high demand, with manufacturers increasingly shifting toward biological and chemical-free formulations such as sourdough starters and non-GMO yeast.
  • Ready-to-use and pre-mixed leavening blends are gaining popularity among home bakers and food service professionals for their convenience, accuracy, and time-saving benefits.

Challenges in the Leavening Agents Market
  • Price sensitivity in emerging markets limits the adoption of premium or specialty leavening agents, especially in cost-sensitive commercial baking operations.
  • Regulatory compliance and varying ingredient labeling standards across regions make it difficult for manufacturers to maintain uniform formulations and expand globally.

Top Countries Manufacturing, Regulating, and Driving Demand for Leavening Agents

Country Wise Analysis Of Leavening Agents Market

Countries CAGR (2025 to 2035)
Japan 6.5%
Germany 6.1%
UK 5.9%
France 5.7%
USA 5.3%

Japan's momentum has been shaped by fermented food integration, precision food engineering, and longstanding traditions in artisanal baking. Germany and France sustain demand through artisan bakery expansions and compliance with European Food Safety Authority (EFSA) standards under the EU’s clean label and food safety initiatives. In contrast, developed economies such as the USA (5.3% CAGR), UK (5.9%), and Japan (6.5%) are expected to expand at a steady 1.04 to 1.27 times the global growth rate.

Japan leads in innovation around biological fermentation systems and natural yeast strains, which are integrated into premium baked goods and health-oriented food categories. Germany and France leverage their deep-rooted bakery culture and enforce EU-wide food additive directives that prioritize transparency and sustainability. The USA focuses on clean-label reformulation, growing consumer preference for gluten-free and keto-friendly products, and technological advancement in shelf-life extension. The UK emphasizes traditional and health-conscious bakery trends, especially in the wake of evolving consumer lifestyle preferences.

The report covers an in-depth analysis of 40+ countries; five top-performing OECD countries are highlighted below. 

In-depth Analysis of Leavening Agents Demand in Japan

The Japan leavening agents market is projected to grow at a CAGR of 6.5% from 2025 to 2035. Growth is driven by a strong national preference for fermented foods, natural baking solutions, and low-sodium dietary trends.

  • High demand in specialty and artisan bakery sectors.
  • Rising use of biological leavening agents in functional food formats.

Growth Outlook for Leavening Agents in Germany

The Germany leavening agents revenue is projected to grow at a CAGR of 6.1% during the forecast period, slightly above the global average and driven by strong bakery traditions and EU ingredient disclosure mandates.

  • Consistent growth in organic, gluten-free, and sourdough applications.
  • Strong regulatory oversight from EFSA supporting clean-label leavening solutions.

Leavening Agents Trends in the UK

The demand for leavening agents in the UK is projected to grow at a CAGR of 5.9% between 2025 and 2035, which is 1.16 times the global growth rate. Growth is supported by a cultural revival of traditional baking and demand for healthier ingredients in baked goods.

  • Increased use of biological agents in homemade and premium bakery items.
  • Focus on allergen-free, low-carb, and sustainable baking formulations.

Leavening Agents Market Performance in France

The French leavening agents market is forecasted to grow at a CAGR of 5.7% from 2025 to 2035, aligning with European clean-label policies and demand for innovative, texture-enhancing solutions in premium baked goods.

  • Growing use of microencapsulated and slow-release leavening agents.
  • Preference for bakery applications with extended shelf-life and health appeal.

Demand Trajectory for Leavening Agents in the USA

The USA leavening agents revenue is projected to grow at a CAGR of 5.3% from 2025 to 2035, translating to 1.04 times the global rate. Growth is driven by increased home baking trends, clean-label movement, and reformulation in processed foods.
  • Rising demand for ready-to-use baking powders and non-aluminum agents.
  • Expansion of gluten-free, keto, and allergen-friendly product lines.

Leading Leavening Agents Suppliers and Manufacturers

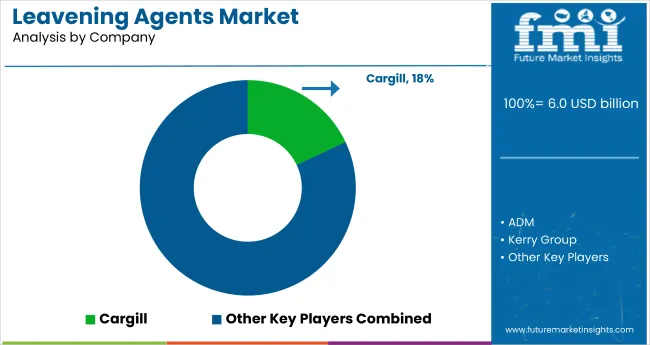
Leavening Agents Market Analysis By Company

The market is moderately consolidated, with prominent players such as Cargill, ADM, Kerry Group, Corbion, and Lesaffre holding substantial global market shares. These companies offer innovative and diverse solutions across both chemical and biological leavening categories, serving bakery, processed food, dairy, and beverage industries. Cargill emphasizes functional ingredient systems with customizable leavening profiles, while ADM focuses on clean-label solutions compatible with gluten-free and low-carb formulations.

Kerry Group leads in enzyme-based leavening and clean-label innovation, particularly with its Biobake range. Corbion is known for its preservation-enhancing solutions and sustainable sourcing practices, and Lesaffre continues to dominate the biological segment with expertise in natural yeast and fermentation science. Other key players such as Kudos Blends Limited, AB Mauri, Puratos, and Lallemand Inc. are making significant contributions through specialized formulations, regional expertise, and R&D in microencapsulation and shelf-life optimization for various food systems.

Recent Leavening Agents Industry News

In June 2025, MicroBioGen partnered exclusively with Lesaffre to advance yeast innovation across baking, food, and biochemicals by combining proprietary biotechnology with global fermentation expertise and production capabilities.

Leavening Agents Market Report Scope

Report Attributes Details
Market Size (2025) USD 6 billion
Projected Market Size (2035) USD 9.9 billion
CAGR (2025 to 2035) 5.1%
Base Year for Estimation 2024
Historical Period 2020 to 2024
Projections Period 2025 to 2035
Report Parameter USD billion for value / volume in metric tons
Form Analyzed Chemical, Biological, and Vaporous
Application Analyzed Bakery & Confectionery (Snack Bars, Processed Foods, Baked Grain Products, Dairy Products, Cheese, Spreads & Margarines, and Carbonated Drinks) and Personal & Health Care
Regions Covered North America, Latin America, Western Europe, Eastern Europe, East Asia, South Asia, Oceania, Middle East & Africa
Countries Covered United States, United Kingdom, Germany, France, Japan, China, India, Brazil, South Korea, Australia
Key Players Influencing the Market Cargill, ADM, Kerry Group, Corbion, Lesaffre, Kudos Blends Limited, AB Mauri, Puratos, and Lallemand Inc.
Additional Attributes Dollar sales by equipment type, share by power, regional demand growth, policy influence, automation trends, competitive benchmarking

Segmentation

By Form:

As per form, the market has been categorized into chemical, biological, and vaporous

By Application:

This segment is further categorized into Food & Beverage (bakery & confectionery, snack bars, processed foods, baked grain products, dairy products, cheese, spreads & margarines, carbonated drinks), and Personal & Health care

By Region:

Industry analysis has been carried out in key countries of North America, Latin America, Europe, East Asia, South Asia, Oceania, and the Middle East & Africa.

Table of Content

  1. Executive Summary
    • Global Market Outlook
    • Demand-side Trends
    • Supply-side Trends
    • Technology Roadmap Analysis
    • Analysis and Recommendations
  2. Market Overview
    • Market Coverage / Taxonomy
    • Market Definition / Scope / Limitations
  3. Market Background
    • Market Dynamics
      • Drivers
      • Restraints
      • Opportunity
      • Trends
    • Scenario Forecast
      • Demand in Optimistic Scenario
      • Demand in Likely Scenario
      • Demand in Conservative Scenario
    • Opportunity Map Analysis
    • Product Life Cycle Analysis
    • Supply Chain Analysis
      • Supply Side Participants and their Roles
        • Producers
        • Mid-Level Participants (Traders/ Agents/ Brokers)
        • Wholesalers and Distributors
      • Value Added and Value Created at Node in the Supply Chain
      • List of Raw Material Suppliers
      • List of Existing and Potential Buyer’s
    • Investment Feasibility Matrix
    • Value Chain Analysis
      • Profit Margin Analysis
      • Wholesalers and Distributors
      • Retailers
    • PESTLE and Porter’s Analysis
    • Regulatory Landscape
      • By Key Regions
      • By Key Countries
    • Regional Parent Market Outlook
    • Production and Consumption Statistics
    • Import and Export Statistics
  4. Global Market Analysis 2020 to 2024 and Forecast, 2025 to 2035
    • Historical Market Size Value (USD Billion) & Volume (Metric Tons) Analysis, 2020 to 2024
    • Current and Future Market Size Value (USD Billion) & Volume (Metric Tons) Projections, 2025 to 2035
      • Y-o-Y Growth Trend Analysis
      • Absolute $ Opportunity Analysis
  5. Global Market Pricing Analysis 2020 to 2024 and Forecast 2025 to 2035
  6. Global Market Analysis 2020 to 2024 and Forecast 2025 to 2035, By Form
    • Introduction / Key Findings
    • Historical Market Size Value (USD Billion) & Volume (Metric Tons) Analysis By Form, 2020 to 2024
    • Current and Future Market Size Value (USD Billion) & Volume (Metric Tons) Analysis and Forecast By Form, 2025 to 2035
      • Chemical
      • Biological
      • Vaporous
    • Y-o-Y Growth Trend Analysis By Form, 2020 to 2024
    • Absolute $ Opportunity Analysis By Form, 2025 to 2035
  7. Global Market Analysis 2020 to 2024 and Forecast 2025 to 2035, By Application
    • Introduction / Key Findings
    • Historical Market Size Value (USD Billion) & Volume (Metric Tons) Analysis By Application, 2020 to 2024
    • Current and Future Market Size Value (USD Billion) & Volume (Metric Tons) Analysis and Forecast By Application, 2025 to 2035
      • Food & Beverage
        • Bakery & Confectionery
        • Snack Bars
        • Processed Foods
        • Baked Grain Products
        • Dairy Products
        • Cheese
        • Spreads & Margarines
        • Carbonated Drinks
      • Personal & Health Care
    • Y-o-Y Growth Trend Analysis By Application, 2020 to 2024
    • Absolute $ Opportunity Analysis By Application, 2025 to 2035
  8. Global Market Analysis 2020 to 2024 and Forecast 2025 to 2035, By Region
    • Introduction
    • Historical Market Size Value (USD Billion) & Volume (Metric Tons) Analysis By Region, 2020 to 2024
    • Current Market Size Value (USD Billion) & Volume (Metric Tons) Analysis and Forecast By Region, 2025 to 2035
      • North America
      • Latin America
      • Western Europe
      • Eastern Europe
      • East Asia
      • South Asia & Pacific
      • Middle East and Africa
    • Market Attractiveness Analysis By Region
  9. North America Market Analysis 2020 to 2024 and Forecast 2025 to 2035, By Country
    • Historical Market Size Value (USD Billion) & Volume (Metric Tons) Trend Analysis By Market Taxonomy, 2020 to 2024
    • Market Size Value (USD Billion) & Volume (Metric Tons) Forecast By Market Taxonomy, 2025 to 2035
      • By Country
        • USA
        • Canada
        • Mexico
      • By Form
      • By Application
    • Market Attractiveness Analysis
      • By Country
      • By Form
      • By Application
    • Key Takeaways
  10. Latin America Market Analysis 2020 to 2024 and Forecast 2025 to 2035, By Country
    • Historical Market Size Value (USD Billion) & Volume (Metric Tons) Trend Analysis By Market Taxonomy, 2020 to 2024
    • Market Size Value (USD Billion) & Volume (Metric Tons) Forecast By Market Taxonomy, 2025 to 2035
      • By Country
        • Brazil
        • Argentina
        • Rest of LATAM
      • By Form
      • By Application
    • Market Attractiveness Analysis
      • By Country
      • By Form
      • By Application
    • Key Takeaways
  11. Western Europe Market Analysis 2020 to 2024 and Forecast 2025 to 2035, By Country
    • Historical Market Size Value (USD Billion) & Volume (Metric Tons) Trend Analysis By Market Taxonomy, 2020 to 2024
    • Market Size Value (USD Billion) & Volume (Metric Tons) Forecast By Market Taxonomy, 2025 to 2035
      • By Country
        • Germany
        • Italy
        • France
        • UK
        • Spain
        • BENELUX
        • Nordic
        • Rest of W.Europe
      • By Form
      • By Application
    • Market Attractiveness Analysis
      • By Country
      • By Form
      • By Application
    • Key Takeaways
  12. Eastern Europe Market Analysis 2020 to 2024 and Forecast 2025 to 2035, By Country
    • Historical Market Size Value (USD Billion) & Volume (Metric Tons) Trend Analysis By Market Taxonomy, 2020 to 2024
    • Market Size Value (USD Billion) & Volume (Metric Tons) Forecast By Market Taxonomy, 2025 to 2035
      • By Country
        • Russia
        • Hungary
        • Poland
        • Balkan & Baltics
        • Rest of E. Europe
      • By Form
      • By Application
    • Market Attractiveness Analysis
      • By Country
      • By Form
      • By Application
    • Key Takeaways
  13. East Asia Market Analysis 2020 to 2024 and Forecast 2025 to 2035, By Country
    • Historical Market Size Value (USD Billion) & Volume (Metric Tons) Trend Analysis By Market Taxonomy, 2020 to 2024
    • Market Size Value (USD Billion) & Volume (Metric Tons) Forecast By Market Taxonomy, 2025 to 2035
      • By Country
        • China
        • Japan
        • South Korea
      • By Form
      • By Application
    • Market Attractiveness Analysis
      • By Country
      • By Form
      • By Application
    • Key Takeaways
  14. South Asia & Pacific Market Analysis 2020 to 2024 and Forecast 2025 to 2035, By Country
    • Historical Market Size Value (USD Billion) & Volume (Metric Tons) Trend Analysis By Market Taxonomy, 2020 to 2024
    • Market Size Value (USD Billion) & Volume (Metric Tons) Forecast By Market Taxonomy, 2025 to 2035
      • By Country
        • India
        • Australia & New Zealand
        • ASEAN
        • Rest of SAP
      • By Form
      • By Application
    • Market Attractiveness Analysis
      • By Country
      • By Form
      • By Application
    • Key Takeaways
  15. Middle East and Africa Market Analysis 2020 to 2024 and Forecast 2025 to 2035, By Country
    • Historical Market Size Value (USD Billion) & Volume (Metric Tons) Trend Analysis By Market Taxonomy, 2020 to 2024
    • Market Size Value (USD Billion) & Volume (Metric Tons) Forecast By Market Taxonomy, 2025 to 2035
      • By Country
        • GCC Countries
        • Northern Africa
        • South Africa
        • Turkiye
        • Rest of MEA
      • By Form
      • By Application
    • Market Attractiveness Analysis
      • By Country
      • By Form
      • By Application
    • Key Takeaways
  16. Key Countries Market Analysis
    • USA
      • Pricing Analysis
      • Market Share Analysis, 2024
        • By Form
        • By Application
    • Canada
      • Pricing Analysis
      • Market Share Analysis, 2024
        • By Form
        • By Application
    • Brazil
      • Pricing Analysis
      • Market Share Analysis, 2024
        • By Form
        • By Application
    • Mexico
      • Pricing Analysis
      • Market Share Analysis, 2024
        • By Form
        • By Application
    • Argentina
      • Pricing Analysis
      • Market Share Analysis, 2024
        • By Form
        • By Application
  17. Market Structure Analysis
    • Competition Dashboard
    • Competition Benchmarking
    • Market Share Analysis of Top Players
      • By Regional
      • By Form
      • By Application
  18. Competition Analysis
    • Competition Deep Dive
      • Cargill
        • Overview
        • Product Portfolio
        • Profitability by Market Segments (Product/Age /Sales Channel/Region)
        • Sales Footprint
        • Strategy Overview
          • Marketing Strategy
          • Product Strategy
          • Channel Strategy
      • ADM
        • Overview
        • Product Portfolio
        • Profitability by Market Segments (Product/Age /Sales Channel/Region)
        • Sales Footprint
        • Strategy Overview
          • Marketing Strategy
          • Product Strategy
          • Channel Strategy
      • Kerry Group
        • Overview
        • Product Portfolio
        • Profitability by Market Segments (Product/Age /Sales Channel/Region)
        • Sales Footprint
        • Strategy Overview
          • Marketing Strategy
          • Product Strategy
          • Channel Strategy
      • Corbion
        • Overview
        • Product Portfolio
        • Profitability by Market Segments (Product/Age /Sales Channel/Region)
        • Sales Footprint
        • Strategy Overview
          • Marketing Strategy
          • Product Strategy
          • Channel Strategy
      • Kudos Blends Limited
        • Overview
        • Product Portfolio
        • Profitability by Market Segments (Product/Age /Sales Channel/Region)
        • Sales Footprint
        • Strategy Overview
          • Marketing Strategy
          • Product Strategy
          • Channel Strategy
      • Puratos
        • Overview
        • Product Portfolio
        • Profitability by Market Segments (Product/Age /Sales Channel/Region)
        • Sales Footprint
        • Strategy Overview
          • Marketing Strategy
          • Product Strategy
          • Channel Strategy
      • AB Mauri
        • Overview
        • Product Portfolio
        • Profitability by Market Segments (Product/Age /Sales Channel/Region)
        • Sales Footprint
        • Strategy Overview
          • Marketing Strategy
          • Product Strategy
          • Channel Strategy
      • Lesaffre
        • Overview
        • Product Portfolio
        • Profitability by Market Segments (Product/Age /Sales Channel/Region)
        • Sales Footprint
        • Strategy Overview
          • Marketing Strategy
          • Product Strategy
          • Channel Strategy
      • Lallemand Inc.
        • Overview
        • Product Portfolio
        • Profitability by Market Segments (Product/Age /Sales Channel/Region)
        • Sales Footprint
        • Strategy Overview
          • Marketing Strategy
          • Product Strategy
          • Channel Strategy
  19. Assumptions & Acronyms Used
  20. Research Methodology

List of Tables

  • Table 1: Global Market Value (USD Billion) Forecast by Region, 2020 to 2035
  • Table 2: Global Market Volume (Metric Tons) Forecast by Region, 2020 to 2035
  • Table 3: Global Market Value (USD Billion) Forecast by Form, 2020 to 2035
  • Table 4: Global Market Volume (Metric Tons) Forecast by Form, 2020 to 2035
  • Table 5: Global Market Value (USD Billion) Forecast by Application, 2020 to 2035
  • Table 6: Global Market Volume (Metric Tons) Forecast by Application, 2020 to 2035
  • Table 7: North America Market Value (USD Billion) Forecast by Country, 2020 to 2035
  • Table 8: North America Market Volume (Metric Tons) Forecast by Country, 2020 to 2035
  • Table 9: North America Market Value (USD Billion) Forecast by Form, 2020 to 2035
  • Table 10: North America Market Volume (Metric Tons) Forecast by Form, 2020 to 2035
  • Table 11: North America Market Value (USD Billion) Forecast by Application, 2020 to 2035
  • Table 12: North America Market Volume (Metric Tons) Forecast by Application, 2020 to 2035
  • Table 13: Latin America Market Value (USD Billion) Forecast by Country, 2020 to 2035
  • Table 14: Latin America Market Volume (Metric Tons) Forecast by Country, 2020 to 2035
  • Table 15: Latin America Market Value (USD Billion) Forecast by Form, 2020 to 2035
  • Table 16: Latin America Market Volume (Metric Tons) Forecast by Form, 2020 to 2035
  • Table 17: Latin America Market Value (USD Billion) Forecast by Application, 2020 to 2035
  • Table 18: Latin America Market Volume (Metric Tons) Forecast by Application, 2020 to 2035
  • Table 19: Western Europe Market Value (USD Billion) Forecast by Country, 2020 to 2035
  • Table 20: Western Europe Market Volume (Metric Tons) Forecast by Country, 2020 to 2035
  • Table 21: Western Europe Market Value (USD Billion) Forecast by Form, 2020 to 2035
  • Table 22: Western Europe Market Volume (Metric Tons) Forecast by Form, 2020 to 2035
  • Table 23: Western Europe Market Value (USD Billion) Forecast by Application, 2020 to 2035
  • Table 24: Western Europe Market Volume (Metric Tons) Forecast by Application, 2020 to 2035
  • Table 25: Eastern Europe Market Value (USD Billion) Forecast by Country, 2020 to 2035
  • Table 26: Eastern Europe Market Volume (Metric Tons) Forecast by Country, 2020 to 2035
  • Table 27: Eastern Europe Market Value (USD Billion) Forecast by Form, 2020 to 2035
  • Table 28: Eastern Europe Market Volume (Metric Tons) Forecast by Form, 2020 to 2035
  • Table 29: Eastern Europe Market Value (USD Billion) Forecast by Application, 2020 to 2035
  • Table 30: Eastern Europe Market Volume (Metric Tons) Forecast by Application, 2020 to 2035
  • Table 31: East Asia Market Value (USD Billion) Forecast by Country, 2020 to 2035
  • Table 32: East Asia Market Volume (Metric Tons) Forecast by Country, 2020 to 2035
  • Table 33: East Asia Market Value (USD Billion) Forecast by Form, 2020 to 2035
  • Table 34: East Asia Market Volume (Metric Tons) Forecast by Form, 2020 to 2035
  • Table 35: East Asia Market Value (USD Billion) Forecast by Application, 2020 to 2035
  • Table 36: East Asia Market Volume (Metric Tons) Forecast by Application, 2020 to 2035
  • Table 37: South Asia & Pacific Market Value (USD Billion) Forecast by Country, 2020 to 2035
  • Table 38: South Asia & Pacific Market Volume (Metric Tons) Forecast by Country, 2020 to 2035
  • Table 39: South Asia & Pacific Market Value (USD Billion) Forecast by Form, 2020 to 2035
  • Table 40: South Asia & Pacific Market Volume (Metric Tons) Forecast by Form, 2020 to 2035
  • Table 41: South Asia & Pacific Market Value (USD Billion) Forecast by Application, 2020 to 2035
  • Table 42: South Asia & Pacific Market Volume (Metric Tons) Forecast by Application, 2020 to 2035
  • Table 43: Middle East and Africa Market Value (USD Billion) Forecast by Country, 2020 to 2035
  • Table 44: Middle East and Africa Market Volume (Metric Tons) Forecast by Country, 2020 to 2035
  • Table 45: Middle East and Africa Market Value (USD Billion) Forecast by Form, 2020 to 2035
  • Table 46: Middle East and Africa Market Volume (Metric Tons) Forecast by Form, 2020 to 2035
  • Table 47: Middle East and Africa Market Value (USD Billion) Forecast by Application, 2020 to 2035
  • Table 48: Middle East and Africa Market Volume (Metric Tons) Forecast by Application, 2020 to 2035

List of Figures

  • Figure 1: Global Market Volume (Metric Tons) Forecast 2020 to 2035
  • Figure 2: Global Market Pricing Analysis
  • Figure 3: Global Market Value (USD Billion) Forecast 2020 to 2035
  • Figure 4: Global Market Value Share and BPS Analysis by Form, 2025 and 2035
  • Figure 5: Global Market Y-o-Y Growth Comparison by Form, 2025 to 2035
  • Figure 6: Global Market Attractiveness Analysis by Form
  • Figure 7: Global Market Value Share and BPS Analysis by Application, 2025 and 2035
  • Figure 8: Global Market Y-o-Y Growth Comparison by Application, 2025 to 2035
  • Figure 9: Global Market Attractiveness Analysis by Application
  • Figure 10: Global Market Value (USD Billion) Share and BPS Analysis by Region, 2025 and 2035
  • Figure 11: Global Market Y-o-Y Growth Comparison by Region, 2025 to 2035
  • Figure 12: Global Market Attractiveness Analysis by Region
  • Figure 13: North America Market Incremental $ Opportunity, 2025 to 2035
  • Figure 14: Latin America Market Incremental $ Opportunity, 2025 to 2035
  • Figure 15: Western Europe Market Incremental $ Opportunity, 2025 to 2035
  • Figure 16: Eastern Europe Market Incremental $ Opportunity, 2025 to 2035
  • Figure 17: East Asia Market Incremental $ Opportunity, 2025 to 2035
  • Figure 18: South Asia & Pacific Market Incremental $ Opportunity, 2025 to 2035
  • Figure 19: Middle East and Africa Market Incremental $ Opportunity, 2025 to 2035
  • Figure 20: North America Market Value Share and BPS Analysis by Country, 2025 and 2035
  • Figure 21: North America Market Value Share and BPS Analysis by Form, 2025 and 2035
  • Figure 22: North America Market Y-o-Y Growth Comparison by Form, 2025 to 2035
  • Figure 23: North America Market Attractiveness Analysis by Form
  • Figure 24: North America Market Value Share and BPS Analysis by Application, 2025 and 2035
  • Figure 25: North America Market Y-o-Y Growth Comparison by Application, 2025 to 2035
  • Figure 26: North America Market Attractiveness Analysis by Application
  • Figure 27: Latin America Market Value Share and BPS Analysis by Country, 2025 and 2035
  • Figure 28: Latin America Market Value Share and BPS Analysis by Form, 2025 and 2035
  • Figure 29: Latin America Market Y-o-Y Growth Comparison by Form, 2025 to 2035
  • Figure 30: Latin America Market Attractiveness Analysis by Form
  • Figure 31: Latin America Market Value Share and BPS Analysis by Application, 2025 and 2035
  • Figure 32: Latin America Market Y-o-Y Growth Comparison by Application, 2025 to 2035
  • Figure 33: Latin America Market Attractiveness Analysis by Application
  • Figure 34: Western Europe Market Value Share and BPS Analysis by Country, 2025 and 2035
  • Figure 35: Western Europe Market Value Share and BPS Analysis by Form, 2025 and 2035
  • Figure 36: Western Europe Market Y-o-Y Growth Comparison by Form, 2025 to 2035
  • Figure 37: Western Europe Market Attractiveness Analysis by Form
  • Figure 38: Western Europe Market Value Share and BPS Analysis by Application, 2025 and 2035
  • Figure 39: Western Europe Market Y-o-Y Growth Comparison by Application, 2025 to 2035
  • Figure 40: Western Europe Market Attractiveness Analysis by Application
  • Figure 41: Eastern Europe Market Value Share and BPS Analysis by Country, 2025 and 2035
  • Figure 42: Eastern Europe Market Value Share and BPS Analysis by Form, 2025 and 2035
  • Figure 43: Eastern Europe Market Y-o-Y Growth Comparison by Form, 2025 to 2035
  • Figure 44: Eastern Europe Market Attractiveness Analysis by Form
  • Figure 45: Eastern Europe Market Value Share and BPS Analysis by Application, 2025 and 2035
  • Figure 46: Eastern Europe Market Y-o-Y Growth Comparison by Application, 2025 to 2035
  • Figure 47: Eastern Europe Market Attractiveness Analysis by Application
  • Figure 48: East Asia Market Value Share and BPS Analysis by Country, 2025 and 2035
  • Figure 49: East Asia Market Value Share and BPS Analysis by Form, 2025 and 2035
  • Figure 50: East Asia Market Y-o-Y Growth Comparison by Form, 2025 to 2035
  • Figure 51: East Asia Market Attractiveness Analysis by Form
  • Figure 52: East Asia Market Value Share and BPS Analysis by Application, 2025 and 2035
  • Figure 53: East Asia Market Y-o-Y Growth Comparison by Application, 2025 to 2035
  • Figure 54: East Asia Market Attractiveness Analysis by Application
  • Figure 55: South Asia & Pacific Market Value Share and BPS Analysis by Country, 2025 and 2035
  • Figure 56: South Asia & Pacific Market Value Share and BPS Analysis by Form, 2025 and 2035
  • Figure 57: South Asia & Pacific Market Y-o-Y Growth Comparison by Form, 2025 to 2035
  • Figure 58: South Asia & Pacific Market Attractiveness Analysis by Form
  • Figure 59: South Asia & Pacific Market Value Share and BPS Analysis by Application, 2025 and 2035
  • Figure 60: South Asia & Pacific Market Y-o-Y Growth Comparison by Application, 2025 to 2035
  • Figure 61: South Asia & Pacific Market Attractiveness Analysis by Application
  • Figure 62: Middle East and Africa Market Value Share and BPS Analysis by Country, 2025 and 2035
  • Figure 63: Middle East and Africa Market Value Share and BPS Analysis by Form, 2025 and 2035
  • Figure 64: Middle East and Africa Market Y-o-Y Growth Comparison by Form, 2025 to 2035
  • Figure 65: Middle East and Africa Market Attractiveness Analysis by Form
  • Figure 66: Middle East and Africa Market Value Share and BPS Analysis by Application, 2025 and 2035
  • Figure 67: Middle East and Africa Market Y-o-Y Growth Comparison by Application, 2025 to 2035
  • Figure 68: Middle East and Africa Market Attractiveness Analysis by Application
  • Figure 69: Global Market - Tier Structure Analysis
  • Figure 70: Global Market - Company Share Analysis

Frequently Asked Questions

What is the projected size of the leavening agents market in 2025?

The market is valued at USD 6 billion in 2025.

What is the outlook on leavening agents demand by 2035?

The market is forecasted to reach USD 9.9 billion by 2035, reflecting a CAGR of 5.1%.

Which segment leads the leavening agents market by form in 2025?

Biological will lead the form segment, accounting for 42.6% of the global market share in 2025.

What is the top application sector for the leavening agents market in 2025?

Food & beverage will dominate the application segment with a 71% share in 2025.

Which country is projected to have the fastest-growing leavening agents market?

Japan is projected to grow at the fastest rate, with a CAGR of 6.5% from 2025 to 2035.

Explore Similar Insights

Future Market Insights

Leavening Agents Market