Anti-Foaming Agents Market Size and Share Forecast Outlook 2025 to 2035

The global anti-foaming agents market is projected to grow from USD 1.7 billion in 2025 to USD 2.7 billion by 2035, registering a CAGR of 4.6%.
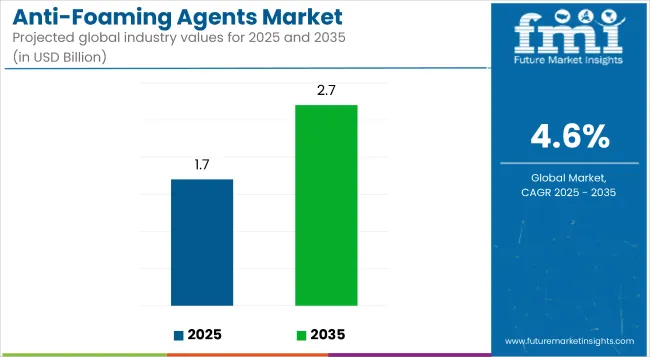
Quick Stats for Anti-Foaming Agents Market

  • Market Value (2025): USD 1.7 billion
  • Forecast Value (2035): USD 2.7 billion
  • Forecast CAGR: 4.6%
  • Type Leader in 2025: Silicone-Based (42.6% market share)
  • Top Form Segment: Liquid (75.5% share)
  • Key Growth Region: East Asia (Japan is the fastest-growing market with a 6% CAGR)

Anti Foaming Agents Market

Metric Value
Industry Size (2025E) USD 1.7 billion
Industry Value (2035F) USD 2.7 billion
CAGR (2025 to 2035) 4.6%

The market expansion is being driven by the rising demand for foam control solutions across industrial processes such as food and beverage processing, pharmaceuticals, oil and gas, paints and coatings, and wastewater treatment, which require effective foam prevention and breakdown for process efficiency and product quality.

The market holds an estimated 100% share within the defoaming and anti-foaming chemicals market, around 14% of the global surfactant chemicals market, and 1.2% of the broader specialty chemicals market. Its role is significant in foam management applications in multiple industries, although it forms a small part of the global industrial chemicals segment.

Government regulations impacting the market focus on food safety standards (such as FDA regulations on food-grade anti-foaming agents), environmental safety standards under EPA norms for chemical disposal, and occupational health and safety standards that mandate safe processing environments. These regulatory pressures drive demand for biodegradable, food-grade, and eco-friendly anti-foaming agents with effective foam suppression and compliance assurance in industrial setups.

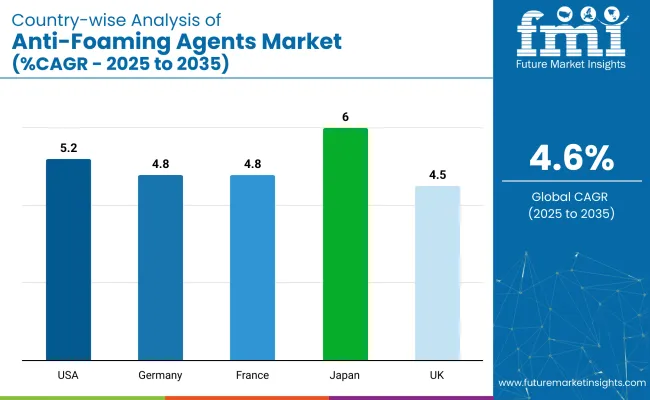
Japan is projected to be the fastest-growing market, expected to expand at a CAGR of 6% from 2025 to 2035. Silicone-based will lead the type segment with a 42.6% share, while liquid will dominate the form segment with a 75.5% share. The USA and Germany markets are also expected to grow steadily at CAGRs of 5.2% and 4.5%, respectively.

Anti-Foaming Agents Market Analysis by Top Investment Segments

The market is segmented by type, application, form, and region. By type, the market is divided into silicone-based, oil-based, and water-based. By application, the market is characterized into powder food and beverages (brewing and dairy application), pharmaceuticals (drug formulation and bio-pharmaceutical manufacturing), paints & coating (solvent-based paint and powder coating), oil & gas (production process and refining process), and others (dishwashing, textiles, and metal working).

By form, the market is bifurcated into liquid and powder. Regionally, the market isclassified into North America, Latin America, Western Europe, Eastern Europe, East Asia, South Asia & Pacific, and Middle East & Africa.

Silicone-Based to Lead the Type Segment with 42.6% Market Share

Silicone-based is expected to dominate the type segment, capturing 42.6% of the global market share by 2025. These agents are widely used in food processing, pharmaceuticals, oil and gas, and paints due to their high efficiency, spreadability, and compatibility with diverse formulations, making them an essential input across process industries.
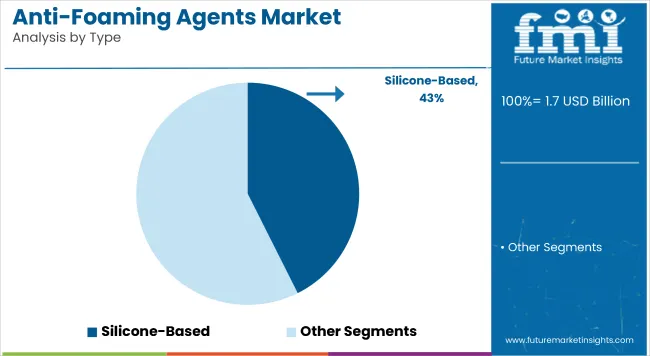
  • Their superior foam suppression efficiency, low toxicity, and compatibility with various formulations make them highly preferred.
  • Silicone derivatives are widely used in food and beverage, pharmaceuticals, and industrial processing for their quick spreadability and persistence.

Anti Foaming Agents Market By Type

Powder Food and Beverages to Lead the Application Segment with 30% Market Share

Powder food and beverages are projected to capture 30% of the application segment market share by 2025. This includes brewing and dairy processing, where foam control is essential to ensure processing efficiency, product quality, and compliance with food safety standards.
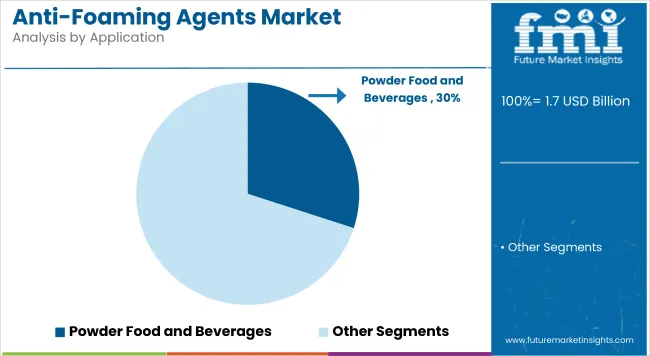
  • Includes brewing and dairy applications within the food processing sector.
  • Growing processed food consumption globally drives demand for effective foam control.

Anti Foaming Agents Market By Application

Liquid to Dominate the Form Segment with 75.5% Market Share

Liquid is projected to lead the form segment, capturing 75.5% of the global market share by 2025. Liquid forms are widely adopted due to their ease of blending, rapid foam suppression, and versatility across food processing, pharmaceuticals, and industrial chemical processes.
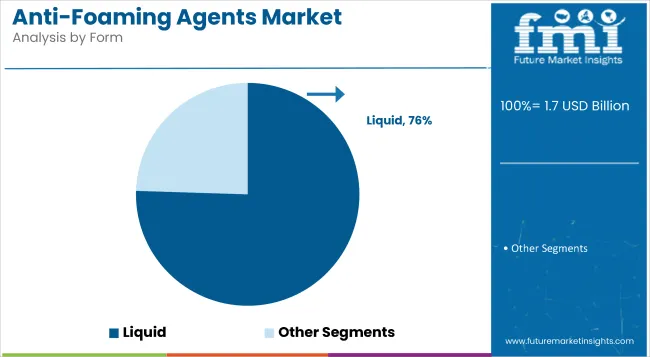
  • Liquid anti-foaming agents are easier to blend with processing matrices and deliver immediate foam suppression.
  • Their high utility in food and beverage processing, wastewater treatment, and pharmaceuticals drives demand for this form.

Anti Foaming Agents Market By Form

Top Anti-Foaming Agents Market Dynamics

The global anti-foaming agents market is experiencing steady growth, driven by increased demand for foam control solutions across food processing, pharmaceuticals, oil and gas, and wastewater treatment industries to maintain operational efficiency and product quality.

Recent Trends in the Anti-Foaming Agents Market

  • Rising adoption of eco-friendly, biodegradable anti-foaming agents to comply with stringent environmental regulations.
  • Advancements in nanotechnology and microemulsion formulations are enhancing spread ability and efficacy across industrial applications.

Challenges in the Anti-Foaming Agents Market
  • Stringent regulatory approvals and compliance standards for food-grade and biodegradable formulations increase production complexity.
  • Fluctuations in raw material availability and prices impact the stability of supply chains for anti-foaming agent manufacturers.

Top Countries Manufacturing, Formulating, Regulating, and Driving Demand for Anti-Foaming Agents

Country Wise Analysis Of Anti Foaming Agents Market

Japan is projected to lead growth among OECD countries, registering a 6% CAGR driven by its expanding pharmaceutical manufacturing, bioprocessing, and industrial fermentation sectors. Demand has been supported by stricter quality controls in chemical and life sciences applications.

The USA follows closely, growing at 5.2%, with anti-foaming agents extensively used in oil refining, food processing, and biologics production. In Germany and France, steady expansion at 4.8% each is underpinned by EU food safety standards and increased industrial automation in wastewater treatment and food-grade applications.

The UK is expected to grow at 4.5%, influenced by regulatory divergence post-Brexit, as domestic industries emphasize compliance and cleaner processing. Japan’s advanced formulation capabilities and biopharma strength place it ahead of other OECD nations, while Germany, France, and the UK remain aligned with evolving EU-driven environmental and food-grade compliance frameworks.

The report covers in-depth analysis of 40+ countries; five top-performing OECD countries are highlighted below.

In-depth Analysis of Anti-Foaming Agents Demand in Japan

The Japan anti-foaming agents revenue is growing at a CAGR of 6% from 2025 to 2035. Growth is driven by high usage in pharmaceuticals, bioprocessing, and food industries. Compared to other OECD nations, Japan focuses on food-grade, low-toxicity formulations compliant with national standards.

  • Demand is fueled by rising biopharmaceutical manufacturing and fermentation processes requiring effective foam control solutions.
  • Leading players are investing in PFAS-free and biodegradable formulations to comply with Japan’s stringent chemical safety norms.

Growth Outlook for Anti-Foaming Agents in Germany

The salesof anti-foaming agents in Germany areexpected to expand at 4.8% CAGR, slightly below global average. Demand is driven by food and beverage processing, paints and coatings, and oil and gas refining industries focusing on biodegradable anti-foaming solutions.

  • Companies are investing in R&D to develop innovative, low-toxicity, and food-grade variants.
  • Partnerships with food processing and oil refining industries are strengthening market presence.

Industrial Anti-Foaming Agents Demand in France

The French anti-foaming agents market is projected to grow at a CAGR of 4.8%, driven by food processing and chemical manufacturing sectors requiring foam control. France emphasizes biodegradable and eco-safe formulations in line with EU regulatory frameworks.

  • The rise in domestic food processing capacity boosts consumption of food-grade anti-foaming agents.
  • French chemical manufacturers focus on meeting both performance efficiency and environmental safety standards.

Demand Trajectory in the USA

The USA anti-foaming agents revenue is projected to grow at 5.2% CAGR. Growth is driven by its large food and beverage, pharmaceutical, oil refining, and wastewater treatment industries demanding efficient foam prevention solutions.

  • Strong presence of global players like Dow Chemical and Ecolab supports market consolidation and innovation.
  • FDA food-grade regulations drive the use of safe, non-toxic formulations in food and pharma industries.

Dust Control Trends in the UK

The UK anti-foaming agents market is projected to grow at a CAGR of 4.5%, driven by steady demand in food processing, pharmaceuticals, and chemicals sectors, with regulatory focus on product safety and environmental compliance.
  • Manufacturers are focusing on developing multi-purpose formulations suited for diverse industrial applications.
  • Brexit-driven regulatory changes encourage domestic suppliers to adapt to evolving standards for process additives.

Leading Anti-Foaming Agents Suppliers and Manufacturers

Anti Foaming Agents Market By Company

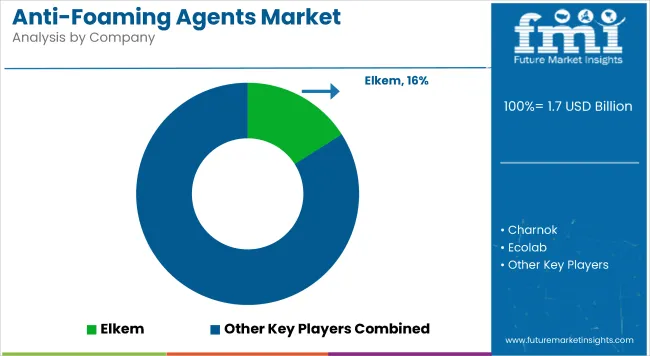
The market is moderately consolidated, with leading players like Elkem, Charnok, Ecolab, Dow Chemicals, and DIC Corporation dominating the industry. These companies provide advanced, efficient anti-foaming solutions catering to industries such as food and beverage processing, pharmaceuticals, paints and coatings, oil and gas, and wastewater treatment. Dow Chemicals focuses on high-performance silicone-based formulations, while Ecolab specializes in food-grade and eco-friendly defoamers.

DIC Corporation offers innovative PFAS-free formulations for automotive and industrial lubricants. Elkem delivers silicone derivatives with wide industrial compatibility, and Charnok is known for its versatile product range serving multiple process industries. Other key players like Münzing Corporation, Crucible Chemical Company, Maxwell Additives Pvt Ltd, OM TexChem Private Limited, and Mohini Organics Pvt Ltd contribute by providing specialized, high-performance anti-foaming agents for a wide range of industrial and food processing applications.

Recent Anti-Foaming Agents Industry News

  • In June 2025, Evonik Coating Additives launched TEGO® Foamex 8051, a siloxane-based defoamer for waterborne decorative coatings. This 100% active concentrate delivers long-lasting defoaming at low dosages, contains near-zero VOCs, and meets global formulation standards without added mineral oils.
  • In September 2024, JebChem introduced JebChem 1066, a fluoro-modified silicone antifoam agent for 2-pack PU and epoxy systems. The product enhances air release, prevents foam formation, and offers compatibility with clear coatings, alkyds, polyesters, acrylics, and melamine systems.

Anti-Foaming Agents Market Report Scope

Report Attributes Details
Market Size (2025) USD 1.7 billion
Projected Market Size (2035) USD 2.7 billion
CAGR (2025 to 2035) 4.6%
Base Year for Estimation 2024
Historical Period 2019 to 2024
Projections Period 2025 to 2035
Report Parameter USD billion for value/volume in units
Type Analyzed Silicone-Based, Oil-Based, and Water-Based
Application Analyzed P owder Food & Beverages (Brewing and Dairy), Ph armaceuticals (Drug Formulation and Bio-Pharma Manufacturing), Paints & Coating (Solvent Based Paint and Powder Coating), Oil & Gas (Production Process and Refining Process), Others (Dishwashing, Textiles, and Metal Working)
Form Analyzed Liquid and Powder
Regions Covered North America, Latin America, Western Europe, Eastern Europe, East Asia, South Asia and Pacific, and Middle East and Africa
Countries Covered United States, United Kingdom, Germany, France, Japan, China, India, Brazil, South Korea, Australia
Key Players Influencing the Market Elkem, Charnok, Ecolab, Dow Chemicals, Vizag Chemicals International, Münzing Corporation, Crucible Chemical Company, Amega Science USA, Momentive, BRB International, ZILIBON DEFOAMER CHEMICAL, Maxwell Addetives Pvt Ltd, Struktol, DIC Corporation, Hangzhou Ruijiang Chemical Co. Ltd, Guangdong Zilibon Chemical Co., OM Tex Chem Private Limited, Mohini Organics Pvt Ltd, Nanhui New Material Co., Ltd., HARMONY ADDITIVES PRIVATE LIMITED
Additional Attributes Dollar sales by type/form/application, market share by segment, regional growth analysis, competitive benchmarking

Key Segments

By Type:

As per type, the target industry has been categorized into Silicone-based, Oil-based, Water Based

By Application:

As per the Application, the target products are sub-segmented into Food and Beverages (Brewing, Dairy Application), Pharmaceuticals (Drug Formulation, Bio-Pharmaceutical manufacturing), Paints and Coating (Solvent Based Paint, Powder Coating), Oil and Gas (Production process, Refining Process), Others (Dishwashing, Textiles, Metal working)

By Form:

This segment is sub-categorized in Liquid, Powdered

By Region:

Industry analysis has been carried out in key countries of the regions such as North America, Latin America, Europe, East Asia, South Asia, Oceania, and the Middle East & Africa.

Table of Content

  1. Executive Summary
    • Global Market Outlook
    • Demand-side Trends
    • Supply-side Trends
    • Technology Roadmap Analysis
    • Analysis and Recommendations
  2. Market Overview
    • Market Coverage / Taxonomy
    • Market Definition / Scope / Limitations
  3. Market Background
    • Market Dynamics
      • Drivers
      • Restraints
      • Opportunity
      • Trends
    • Scenario Forecast
      • Demand in Optimistic Scenario
      • Demand in Likely Scenario
      • Demand in Conservative Scenario
    • Opportunity Map Analysis
    • Product Life Cycle Analysis
    • Supply Chain Analysis
      • Supply Side Participants and their Roles
        • Producers
        • Mid-Level Participants (Traders/ Agents/ Brokers)
        • Wholesalers and Distributors
      • Value Added and Value Created at Node in the Supply Chain
      • List of Raw Material Suppliers
      • List of Existing and Potential Buyer’s
    • Investment Feasibility Matrix
    • Value Chain Analysis
      • Profit Margin Analysis
      • Wholesalers and Distributors
      • Retailers
    • PESTLE and Porter’s Analysis
    • Regulatory Landscape
      • By Key Regions
      • By Key Countries
    • Regional Parent Market Outlook
    • Production and Consumption Statistics
    • Import and Export Statistics
  4. Global Market Analysis 2020 to 2024 and Forecast, 2025 to 2035
    • Historical Market Size Value (USD Billion) & Volume (Units) Analysis, 2020 to 2024
    • Current and Future Market Size Value (USD Billion) & Volume (Units) Projections, 2025 to 2035
      • Y-o-Y Growth Trend Analysis
      • Absolute $ Opportunity Analysis
  5. Global Market Pricing Analysis 2020 to 2024 and Forecast 2025 to 2035
  6. Global Market Analysis 2020 to 2024 and Forecast 2025 to 2035, By Type
    • Introduction / Key Findings
    • Historical Market Size Value (USD Billion) & Volume (Units) Analysis By Type, 2020 to 2024
    • Current and Future Market Size Value (USD Billion) & Volume (Units) Analysis and Forecast By Type, 2025 to 2035
      • Silicone-based
      • Oil-based
      • Water Based
    • Y-o-Y Growth Trend Analysis By Type, 2020 to 2024
    • Absolute $ Opportunity Analysis By Type, 2025 to 2035
  7. Global Market Analysis 2020 to 2024 and Forecast 2025 to 2035, By Application
    • Introduction / Key Findings
    • Historical Market Size Value (USD Billion) & Volume (Units) Analysis By Application, 2020 to 2024
    • Current and Future Market Size Value (USD Billion) & Volume (Units) Analysis and Forecast By Application, 2025 to 2035
      • Powder Food and Beverages
        • Brewing
        • Dairy Application
      • Pharmaceuticals
        • Drug Formulation
        • Bio-Pharmaceutical manufacturing
      • Paints and Coating
        • Solvent Based Paint
        • Powder Coating
      • Oil and Gas
        • Production process
        • Refining Process
      • Others
        • Dishwashing
        • Textiles
        • Metal working
    • Y-o-Y Growth Trend Analysis By Application, 2020 to 2024
    • Absolute $ Opportunity Analysis By Application, 2025 to 2035
  8. Global Market Analysis 2020 to 2024 and Forecast 2025 to 2035, By Form
    • Introduction / Key Findings
    • Historical Market Size Value (USD Billion) & Volume (Units) Analysis By Form, 2020 to 2024
    • Current and Future Market Size Value (USD Billion) & Volume (Units) Analysis and Forecast By Form, 2025 to 2035
      • Liquid
      • Powder
    • Y-o-Y Growth Trend Analysis By Form, 2020 to 2024
    • Absolute $ Opportunity Analysis By Form, 2025 to 2035
  9. Global Market Analysis 2020 to 2024 and Forecast 2025 to 2035, By Region
    • Introduction
    • Historical Market Size Value (USD Billion) & Volume (Units) Analysis By Region, 2020 to 2024
    • Current Market Size Value (USD Billion) & Volume (Units) Analysis and Forecast By Region, 2025 to 2035
      • North America
      • Latin America
      • Western Europe
      • Eastern Europe
      • East Asia
      • South Asia & Pacific
      • Middle East and Africa
    • Market Attractiveness Analysis By Region
  10. North America Market Analysis 2020 to 2024 and Forecast 2025 to 2035, By Country
    • Historical Market Size Value (USD Billion) & Volume (Units) Trend Analysis By Market Taxonomy, 2020 to 2024
    • Market Size Value (USD Billion) & Volume (Units) Forecast By Market Taxonomy, 2025 to 2035
      • By Country
        • USA
        • Canada
        • Mexico
      • By Type
      • By Application
      • By Form
    • Market Attractiveness Analysis
      • By Country
      • By Type
      • By Application
      • By Form
    • Key Takeaways
  11. Latin America Market Analysis 2020 to 2024 and Forecast 2025 to 2035, By Country
    • Historical Market Size Value (USD Billion) & Volume (Units) Trend Analysis By Market Taxonomy, 2020 to 2024
    • Market Size Value (USD Billion) & Volume (Units) Forecast By Market Taxonomy, 2025 to 2035
      • By Country
        • Brazil
        • Argentina
        • Rest of LATAM
      • By Type
      • By Application
      • By Form
    • Market Attractiveness Analysis
      • By Country
      • By Type
      • By Application
      • By Form
    • Key Takeaways
  12. Western Europe Market Analysis 2020 to 2024 and Forecast 2025 to 2035, By Country
    • Historical Market Size Value (USD Billion) & Volume (Units) Trend Analysis By Market Taxonomy, 2020 to 2024
    • Market Size Value (USD Billion) & Volume (Units) Forecast By Market Taxonomy, 2025 to 2035
      • By Country
        • Germany
        • Italy
        • France
        • UK
        • Spain
        • BENELUX
        • Nordic
        • Rest of W.Europe
      • By Type
      • By Application
      • By Form
    • Market Attractiveness Analysis
      • By Country
      • By Type
      • By Application
      • By Form
    • Key Takeaways
  13. Eastern Europe Market Analysis 2020 to 2024 and Forecast 2025 to 2035, By Country
    • Historical Market Size Value (USD Billion) & Volume (Units) Trend Analysis By Market Taxonomy, 2020 to 2024
    • Market Size Value (USD Billion) & Volume (Units) Forecast By Market Taxonomy, 2025 to 2035
      • By Country
        • Russia
        • Hungary
        • Poland
        • Balkan & Baltics
        • Rest of E. Europe
      • By Type
      • By Application
      • By Form
    • Market Attractiveness Analysis
      • By Country
      • By Type
      • By Application
      • By Form
    • Key Takeaways
  14. East Asia Market Analysis 2020 to 2024 and Forecast 2025 to 2035, By Country
    • Historical Market Size Value (USD Billion) & Volume (Units) Trend Analysis By Market Taxonomy, 2020 to 2024
    • Market Size Value (USD Billion) & Volume (Units) Forecast By Market Taxonomy, 2025 to 2035
      • By Country
        • China
        • Japan
        • South Korea
      • By Type
      • By Application
      • By Form
    • Market Attractiveness Analysis
      • By Country
      • By Type
      • By Application
      • By Form
    • Key Takeaways
  15. South Asia & Pacific Market Analysis 2020 to 2024 and Forecast 2025 to 2035, By Country
    • Historical Market Size Value (USD Billion) & Volume (Units) Trend Analysis By Market Taxonomy, 2020 to 2024
    • Market Size Value (USD Billion) & Volume (Units) Forecast By Market Taxonomy, 2025 to 2035
      • By Country
        • India
        • Australia & New Zealand
        • ASEAN
        • Rest of SAP
      • By Type
      • By Application
      • By Form
    • Market Attractiveness Analysis
      • By Country
      • By Type
      • By Application
      • By Form
    • Key Takeaways
  16. Middle East and Africa Market Analysis 2020 to 2024 and Forecast 2025 to 2035, By Country
    • Historical Market Size Value (USD Billion) & Volume (Units) Trend Analysis By Market Taxonomy, 2020 to 2024
    • Market Size Value (USD Billion) & Volume (Units) Forecast By Market Taxonomy, 2025 to 2035
      • By Country
        • GCC Countries
        • Northern Africa
        • South Africa
        • Turkiye
        • Rest of MEA
      • By Type
      • By Application
      • By Form
    • Market Attractiveness Analysis
      • By Country
      • By Type
      • By Application
      • By Form
    • Key Takeaways
  17. Key Countries Market Analysis
    • USA
      • Pricing Analysis
      • Market Share Analysis, 2024
        • By Type
        • By Application
        • By Form
    • Canada
      • Pricing Analysis
      • Market Share Analysis, 2024
        • By Type
        • By Application
        • By Form
    • Brazil
      • Pricing Analysis
      • Market Share Analysis, 2024
        • By Type
        • By Application
        • By Form
    • Mexico
      • Pricing Analysis
      • Market Share Analysis, 2024
        • By Type
        • By Application
        • By Form
    • Argentina
      • Pricing Analysis
      • Market Share Analysis, 2024
        • By Type
        • By Application
        • By Form
  18. Market Structure Analysis
    • Competition Dashboard
    • Competition Benchmarking
    • Market Share Analysis of Top Players
      • By Regional
      • By Type
      • By Application
      • By Form
  19. Competition Analysis
    • Competition Deep Dive
      • Elkem
        • Overview
        • Product Portfolio
        • Profitability by Market Segments (Product/Age /Sales Channel/Region)
        • Sales Footprint
        • Strategy Overview
          • Marketing Strategy
          • Product Strategy
          • Channel Strategy
      • Charnok
        • Overview
        • Product Portfolio
        • Profitability by Market Segments (Product/Age /Sales Channel/Region)
        • Sales Footprint
        • Strategy Overview
          • Marketing Strategy
          • Product Strategy
          • Channel Strategy
      • Ecolab
        • Overview
        • Product Portfolio
        • Profitability by Market Segments (Product/Age /Sales Channel/Region)
        • Sales Footprint
        • Strategy Overview
          • Marketing Strategy
          • Product Strategy
          • Channel Strategy
      • Dow Chemicals
        • Overview
        • Product Portfolio
        • Profitability by Market Segments (Product/Age /Sales Channel/Region)
        • Sales Footprint
        • Strategy Overview
          • Marketing Strategy
          • Product Strategy
          • Channel Strategy
      • Vizag Chemicals International
        • Overview
        • Product Portfolio
        • Profitability by Market Segments (Product/Age /Sales Channel/Region)
        • Sales Footprint
        • Strategy Overview
          • Marketing Strategy
          • Product Strategy
          • Channel Strategy
      • Münzing Corporation
        • Overview
        • Product Portfolio
        • Profitability by Market Segments (Product/Age /Sales Channel/Region)
        • Sales Footprint
        • Strategy Overview
          • Marketing Strategy
          • Product Strategy
          • Channel Strategy
      • Crucible Chemical Company
        • Overview
        • Product Portfolio
        • Profitability by Market Segments (Product/Age /Sales Channel/Region)
        • Sales Footprint
        • Strategy Overview
          • Marketing Strategy
          • Product Strategy
          • Channel Strategy
      • Amega Science USA
        • Overview
        • Product Portfolio
        • Profitability by Market Segments (Product/Age /Sales Channel/Region)
        • Sales Footprint
        • Strategy Overview
          • Marketing Strategy
          • Product Strategy
          • Channel Strategy
      • Momentive
        • Overview
        • Product Portfolio
        • Profitability by Market Segments (Product/Age /Sales Channel/Region)
        • Sales Footprint
        • Strategy Overview
          • Marketing Strategy
          • Product Strategy
          • Channel Strategy
      • BRB International
        • Overview
        • Product Portfolio
        • Profitability by Market Segments (Product/Age /Sales Channel/Region)
        • Sales Footprint
        • Strategy Overview
          • Marketing Strategy
          • Product Strategy
          • Channel Strategy
      • ZILIBON DEFOAMER CHEMICAL
        • Overview
        • Product Portfolio
        • Profitability by Market Segments (Product/Age /Sales Channel/Region)
        • Sales Footprint
        • Strategy Overview
          • Marketing Strategy
          • Product Strategy
          • Channel Strategy
      • Maxwell Addetives Pvt Ltd
        • Overview
        • Product Portfolio
        • Profitability by Market Segments (Product/Age /Sales Channel/Region)
        • Sales Footprint
        • Strategy Overview
          • Marketing Strategy
          • Product Strategy
          • Channel Strategy
      • Struktol
        • Overview
        • Product Portfolio
        • Profitability by Market Segments (Product/Age /Sales Channel/Region)
        • Sales Footprint
        • Strategy Overview
          • Marketing Strategy
          • Product Strategy
          • Channel Strategy
      • DIC Corporation
        • Overview
        • Product Portfolio
        • Profitability by Market Segments (Product/Age /Sales Channel/Region)
        • Sales Footprint
        • Strategy Overview
          • Marketing Strategy
          • Product Strategy
          • Channel Strategy
      • Hangzhou Ruijiang Chemical Co. Ltd
        • Overview
        • Product Portfolio
        • Profitability by Market Segments (Product/Age /Sales Channel/Region)
        • Sales Footprint
        • Strategy Overview
          • Marketing Strategy
          • Product Strategy
          • Channel Strategy
      • Guangdong Zilibon Chemical Co.
        • Overview
        • Product Portfolio
        • Profitability by Market Segments (Product/Age /Sales Channel/Region)
        • Sales Footprint
        • Strategy Overview
          • Marketing Strategy
          • Product Strategy
          • Channel Strategy
      • OM Tex Chem Private Limited
        • Overview
        • Product Portfolio
        • Profitability by Market Segments (Product/Age /Sales Channel/Region)
        • Sales Footprint
        • Strategy Overview
          • Marketing Strategy
          • Product Strategy
          • Channel Strategy
      • Mohini Organics Pvt Ltd
        • Overview
        • Product Portfolio
        • Profitability by Market Segments (Product/Age /Sales Channel/Region)
        • Sales Footprint
        • Strategy Overview
          • Marketing Strategy
          • Product Strategy
          • Channel Strategy
      • Nanhui New Material Co., Ltd.
        • Overview
        • Product Portfolio
        • Profitability by Market Segments (Product/Age /Sales Channel/Region)
        • Sales Footprint
        • Strategy Overview
          • Marketing Strategy
          • Product Strategy
          • Channel Strategy
      • HARMONY ADDITIVES PRIVATE LIMITED
        • Overview
        • Product Portfolio
        • Profitability by Market Segments (Product/Age /Sales Channel/Region)
        • Sales Footprint
        • Strategy Overview
          • Marketing Strategy
          • Product Strategy
          • Channel Strategy
  20. Assumptions & Acronyms Used
  21. Research Methodology

List of Tables

  • Table 1: Global Market Value (USD Billion) Forecast by Region, 2020-2035
  • Table 2: Global Market Volume (Units) Forecast by Region, 2020-2035
  • Table 3: Global Market Value (USD Billion) Forecast by Type, 2020-2035
  • Table 4: Global Market Volume (Units) Forecast by Type, 2020-2035
  • Table 5: Global Market Value (USD Billion) Forecast by Application, 2020-2035
  • Table 6: Global Market Volume (Units) Forecast by Application, 2020-2035
  • Table 7: Global Market Value (USD Billion) Forecast by Form, 2020-2035
  • Table 8: Global Market Volume (Units) Forecast by Form, 2020-2035
  • Table 9: North America Market Value (USD Billion) Forecast by Country, 2020-2035
  • Table 10: North America Market Volume (Units) Forecast by Country, 2020-2035
  • Table 11: North America Market Value (USD Billion) Forecast by Type, 2020-2035
  • Table 12: North America Market Volume (Units) Forecast by Type, 2020-2035
  • Table 13: North America Market Value (USD Billion) Forecast by Application, 2020-2035
  • Table 14: North America Market Volume (Units) Forecast by Application, 2020-2035
  • Table 15: North America Market Value (USD Billion) Forecast by Form, 2020-2035
  • Table 16: North America Market Volume (Units) Forecast by Form, 2020-2035
  • Table 17: Latin America Market Value (USD Billion) Forecast by Country, 2020-2035
  • Table 18: Latin America Market Volume (Units) Forecast by Country, 2020-2035
  • Table 19: Latin America Market Value (USD Billion) Forecast by Type, 2020-2035
  • Table 20: Latin America Market Volume (Units) Forecast by Type, 2020-2035
  • Table 21: Latin America Market Value (USD Billion) Forecast by Application, 2020-2035
  • Table 22: Latin America Market Volume (Units) Forecast by Application, 2020-2035
  • Table 23: Latin America Market Value (USD Billion) Forecast by Form, 2020-2035
  • Table 24: Latin America Market Volume (Units) Forecast by Form, 2020-2035
  • Table 25: Western Europe Market Value (USD Billion) Forecast by Country, 2020-2035
  • Table 26: Western Europe Market Volume (Units) Forecast by Country, 2020-2035
  • Table 27: Western Europe Market Value (USD Billion) Forecast by Type, 2020-2035
  • Table 28: Western Europe Market Volume (Units) Forecast by Type, 2020-2035
  • Table 29: Western Europe Market Value (USD Billion) Forecast by Application, 2020-2035
  • Table 30: Western Europe Market Volume (Units) Forecast by Application, 2020-2035
  • Table 31: Western Europe Market Value (USD Billion) Forecast by Form, 2020-2035
  • Table 32: Western Europe Market Volume (Units) Forecast by Form, 2020-2035
  • Table 33: Eastern Europe Market Value (USD Billion) Forecast by Country, 2020-2035
  • Table 34: Eastern Europe Market Volume (Units) Forecast by Country, 2020-2035
  • Table 35: Eastern Europe Market Value (USD Billion) Forecast by Type, 2020-2035
  • Table 36: Eastern Europe Market Volume (Units) Forecast by Type, 2020-2035
  • Table 37: Eastern Europe Market Value (USD Billion) Forecast by Application, 2020-2035
  • Table 38: Eastern Europe Market Volume (Units) Forecast by Application, 2020-2035
  • Table 39: Eastern Europe Market Value (USD Billion) Forecast by Form, 2020-2035
  • Table 40: Eastern Europe Market Volume (Units) Forecast by Form, 2020-2035
  • Table 41: East Asia Market Value (USD Billion) Forecast by Country, 2020-2035
  • Table 42: East Asia Market Volume (Units) Forecast by Country, 2020-2035
  • Table 43: East Asia Market Value (USD Billion) Forecast by Type, 2020-2035
  • Table 44: East Asia Market Volume (Units) Forecast by Type, 2020-2035
  • Table 45: East Asia Market Value (USD Billion) Forecast by Application, 2020-2035
  • Table 46: East Asia Market Volume (Units) Forecast by Application, 2020-2035
  • Table 47: East Asia Market Value (USD Billion) Forecast by Form, 2020-2035
  • Table 48: East Asia Market Volume (Units) Forecast by Form, 2020-2035
  • Table 49: South Asia & Pacific Market Value (USD Billion) Forecast by Country, 2020-2035
  • Table 50: South Asia & Pacific Market Volume (Units) Forecast by Country, 2020-2035
  • Table 51: South Asia & Pacific Market Value (USD Billion) Forecast by Type, 2020-2035
  • Table 52: South Asia & Pacific Market Volume (Units) Forecast by Type, 2020-2035
  • Table 53: South Asia & Pacific Market Value (USD Billion) Forecast by Application, 2020-2035
  • Table 54: South Asia & Pacific Market Volume (Units) Forecast by Application, 2020-2035
  • Table 55: South Asia & Pacific Market Value (USD Billion) Forecast by Form, 2020-2035
  • Table 56: South Asia & Pacific Market Volume (Units) Forecast by Form, 2020-2035
  • Table 57: Middle East and Africa Market Value (USD Billion) Forecast by Country, 2020-2035
  • Table 58: Middle East and Africa Market Volume (Units) Forecast by Country, 2020-2035
  • Table 59: Middle East and Africa Market Value (USD Billion) Forecast by Type, 2020-2035
  • Table 60: Middle East and Africa Market Volume (Units) Forecast by Type, 2020-2035
  • Table 61: Middle East and Africa Market Value (USD Billion) Forecast by Application, 2020-2035
  • Table 62: Middle East and Africa Market Volume (Units) Forecast by Application, 2020-2035
  • Table 63: Middle East and Africa Market Value (USD Billion) Forecast by Form, 2020-2035
  • Table 64: Middle East and Africa Market Volume (Units) Forecast by Form, 2020-2035

List of Figures

  • Figure 1: Global Market Volume (Units) Forecast 2020-2035
  • Figure 2: Global Market Pricing Analysis
  • Figure 3: Global Market Value (USD Billion) Forecast 2020-2035
  • Figure 4: Global Market Value Share and BPS Analysis by Type, 2025 and 2035
  • Figure 5: Global Market Y-o-Y Growth Comparison by Type, 2025-2035
  • Figure 6: Global Market Attractiveness Analysis by Type
  • Figure 7: Global Market Value Share and BPS Analysis by Application, 2025 and 2035
  • Figure 8: Global Market Y-o-Y Growth Comparison by Application, 2025-2035
  • Figure 9: Global Market Attractiveness Analysis by Application
  • Figure 10: Global Market Value Share and BPS Analysis by Form, 2025 and 2035
  • Figure 11: Global Market Y-o-Y Growth Comparison by Form, 2025-2035
  • Figure 12: Global Market Attractiveness Analysis by Form
  • Figure 13: Global Market Value (USD Billion) Share and BPS Analysis by Region, 2025 and 2035
  • Figure 14: Global Market Y-o-Y Growth Comparison by Region, 2025-2035
  • Figure 15: Global Market Attractiveness Analysis by Region
  • Figure 16: North America Market Incremental $ Opportunity, 2025-2035
  • Figure 17: Latin America Market Incremental $ Opportunity, 2025-2035
  • Figure 18: Western Europe Market Incremental $ Opportunity, 2025-2035
  • Figure 19: Eastern Europe Market Incremental $ Opportunity, 2025-2035
  • Figure 20: East Asia Market Incremental $ Opportunity, 2025-2035
  • Figure 21: South Asia & Pacific Market Incremental $ Opportunity, 2025-2035
  • Figure 22: Middle East and Africa Market Incremental $ Opportunity, 2025-2035
  • Figure 23: North America Market Value Share and BPS Analysis by Country, 2025 and 2035
  • Figure 24: North America Market Value Share and BPS Analysis by Type, 2025 and 2035
  • Figure 25: North America Market Y-o-Y Growth Comparison by Type, 2025-2035
  • Figure 26: North America Market Attractiveness Analysis by Type
  • Figure 27: North America Market Value Share and BPS Analysis by Application, 2025 and 2035
  • Figure 28: North America Market Y-o-Y Growth Comparison by Application, 2025-2035
  • Figure 29: North America Market Attractiveness Analysis by Application
  • Figure 30: North America Market Value Share and BPS Analysis by Form, 2025 and 2035
  • Figure 31: North America Market Y-o-Y Growth Comparison by Form, 2025-2035
  • Figure 32: North America Market Attractiveness Analysis by Form
  • Figure 33: Latin America Market Value Share and BPS Analysis by Country, 2025 and 2035
  • Figure 34: Latin America Market Value Share and BPS Analysis by Type, 2025 and 2035
  • Figure 35: Latin America Market Y-o-Y Growth Comparison by Type, 2025-2035
  • Figure 36: Latin America Market Attractiveness Analysis by Type
  • Figure 37: Latin America Market Value Share and BPS Analysis by Application, 2025 and 2035
  • Figure 38: Latin America Market Y-o-Y Growth Comparison by Application, 2025-2035
  • Figure 39: Latin America Market Attractiveness Analysis by Application
  • Figure 40: Latin America Market Value Share and BPS Analysis by Form, 2025 and 2035
  • Figure 41: Latin America Market Y-o-Y Growth Comparison by Form, 2025-2035
  • Figure 42: Latin America Market Attractiveness Analysis by Form
  • Figure 43: Western Europe Market Value Share and BPS Analysis by Country, 2025 and 2035
  • Figure 44: Western Europe Market Value Share and BPS Analysis by Type, 2025 and 2035
  • Figure 45: Western Europe Market Y-o-Y Growth Comparison by Type, 2025-2035
  • Figure 46: Western Europe Market Attractiveness Analysis by Type
  • Figure 47: Western Europe Market Value Share and BPS Analysis by Application, 2025 and 2035
  • Figure 48: Western Europe Market Y-o-Y Growth Comparison by Application, 2025-2035
  • Figure 49: Western Europe Market Attractiveness Analysis by Application
  • Figure 50: Western Europe Market Value Share and BPS Analysis by Form, 2025 and 2035
  • Figure 51: Western Europe Market Y-o-Y Growth Comparison by Form, 2025-2035
  • Figure 52: Western Europe Market Attractiveness Analysis by Form
  • Figure 53: Eastern Europe Market Value Share and BPS Analysis by Country, 2025 and 2035
  • Figure 54: Eastern Europe Market Value Share and BPS Analysis by Type, 2025 and 2035
  • Figure 55: Eastern Europe Market Y-o-Y Growth Comparison by Type, 2025-2035
  • Figure 56: Eastern Europe Market Attractiveness Analysis by Type
  • Figure 57: Eastern Europe Market Value Share and BPS Analysis by Application, 2025 and 2035
  • Figure 58: Eastern Europe Market Y-o-Y Growth Comparison by Application, 2025-2035
  • Figure 59: Eastern Europe Market Attractiveness Analysis by Application
  • Figure 60: Eastern Europe Market Value Share and BPS Analysis by Form, 2025 and 2035
  • Figure 61: Eastern Europe Market Y-o-Y Growth Comparison by Form, 2025-2035
  • Figure 62: Eastern Europe Market Attractiveness Analysis by Form
  • Figure 63: East Asia Market Value Share and BPS Analysis by Country, 2025 and 2035
  • Figure 64: East Asia Market Value Share and BPS Analysis by Type, 2025 and 2035
  • Figure 65: East Asia Market Y-o-Y Growth Comparison by Type, 2025-2035
  • Figure 66: East Asia Market Attractiveness Analysis by Type
  • Figure 67: East Asia Market Value Share and BPS Analysis by Application, 2025 and 2035
  • Figure 68: East Asia Market Y-o-Y Growth Comparison by Application, 2025-2035
  • Figure 69: East Asia Market Attractiveness Analysis by Application
  • Figure 70: East Asia Market Value Share and BPS Analysis by Form, 2025 and 2035
  • Figure 71: East Asia Market Y-o-Y Growth Comparison by Form, 2025-2035
  • Figure 72: East Asia Market Attractiveness Analysis by Form
  • Figure 73: South Asia & Pacific Market Value Share and BPS Analysis by Country, 2025 and 2035
  • Figure 74: South Asia & Pacific Market Value Share and BPS Analysis by Type, 2025 and 2035
  • Figure 75: South Asia & Pacific Market Y-o-Y Growth Comparison by Type, 2025-2035
  • Figure 76: South Asia & Pacific Market Attractiveness Analysis by Type
  • Figure 77: South Asia & Pacific Market Value Share and BPS Analysis by Application, 2025 and 2035
  • Figure 78: South Asia & Pacific Market Y-o-Y Growth Comparison by Application, 2025-2035
  • Figure 79: South Asia & Pacific Market Attractiveness Analysis by Application
  • Figure 80: South Asia & Pacific Market Value Share and BPS Analysis by Form, 2025 and 2035
  • Figure 81: South Asia & Pacific Market Y-o-Y Growth Comparison by Form, 2025-2035
  • Figure 82: South Asia & Pacific Market Attractiveness Analysis by Form
  • Figure 83: Middle East and Africa Market Value Share and BPS Analysis by Country, 2025 and 2035
  • Figure 84: Middle East and Africa Market Value Share and BPS Analysis by Type, 2025 and 2035
  • Figure 85: Middle East and Africa Market Y-o-Y Growth Comparison by Type, 2025-2035
  • Figure 86: Middle East and Africa Market Attractiveness Analysis by Type
  • Figure 87: Middle East and Africa Market Value Share and BPS Analysis by Application, 2025 and 2035
  • Figure 88: Middle East and Africa Market Y-o-Y Growth Comparison by Application, 2025-2035
  • Figure 89: Middle East and Africa Market Attractiveness Analysis by Application
  • Figure 90: Middle East and Africa Market Value Share and BPS Analysis by Form, 2025 and 2035
  • Figure 91: Middle East and Africa Market Y-o-Y Growth Comparison by Form, 2025-2035
  • Figure 92: Middle East and Africa Market Attractiveness Analysis by Form
  • Figure 93: Global Market - Tier Structure Analysis
  • Figure 94: Global Market - Company Share Analysis

Frequently Asked Questions

What is the projected size of the anti-foaming agents market in 2025?

The market is valued at USD 1.7 billion in 2025.

What is the outlook on anti-foaming agents demand by 2035?

The market is forecasted to reach USD 2.7 billion by 2035, reflecting a CAGR of 4.6%.

Which segment leads the anti-foaming agents market by type in 2025?

Silicone-based will lead the type segment, accounting for 42.6% of the global market share in 2025.

What is the top form segment for the anti-foaming agents market in 2025?

Liquid will dominate the form segment with a 75.5% share in 2025.

Which country is projected to have the fastest-growing anti-foaming agents market?

Japan is projected to grow at the fastest rate, with a CAGR of 6% from 2025 to 2035.

Explore Similar Insights

Future Market Insights

Anti-Foaming Agents Market