Anti-Caking Agents Market Outlook and Forecast 2025 to 2035 

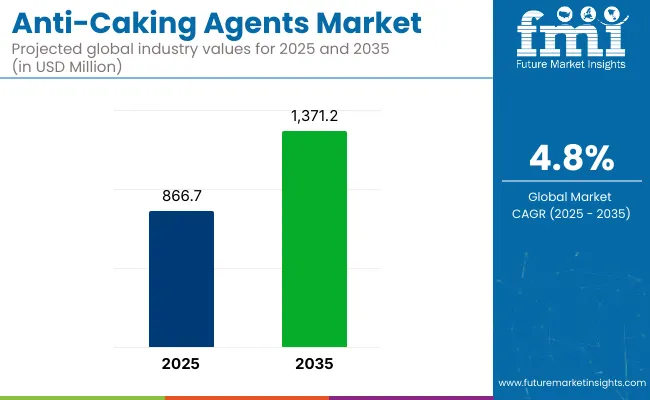
The global anti-caking agents market is valued at USD 866.7 million in 2025 and is poised to reach USD 1,371.2 million by 2035, which shows a CAGR of 4.8%. Growth will be driven by the rising demand for processed and packaged foods, the expansion of the animal feed industry, and the growing use of anti-caking agents in fertilizers to improve flowability and prevent clumping.
Quick Stats for Anti-Caking Agents Market

  • Market Value (2025): USD 866.7 million
  • Forecast Value (2035): USD 1,371.2 million
  • Forecast CAGR: 4.8%
  • Source Leader in 2025: Synthetic Source (52.6% Market Share)
  • Top Application Segment: Fertilizers (35.2% Market Share in 2025)
  • Key Growth Region: East Asia (Japan is the fastest-growing market with 5.2% CAGR)

Anti Caking Agents Market

Metric Value
2025 Market Size USD 866.7 million
2035 Market Size USD 1,371.2 million
CAGR (2025 to 2035) 4.8%

Moreover, increasing health and wellness trends are boosting the preference for natural anti-caking agents, encouraging manufacturers to reformulate products with clean-label ingredients to meet consumer expectations.

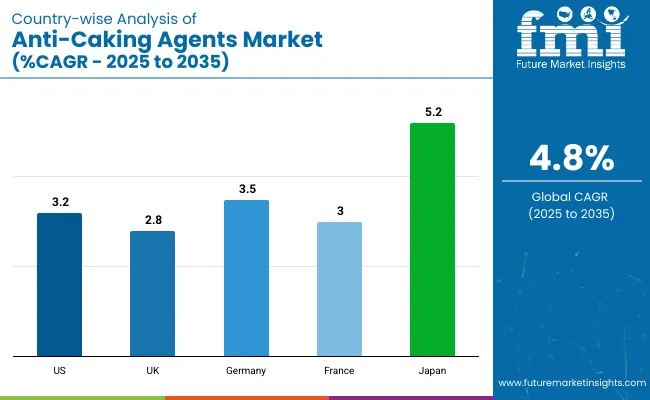
Japan is projected to record the highest CAGR in the market at 5.2%, driven by rising demand for instant noodles and processed foods. Germany will follow with a CAGR of 3.5% due to strong fertilizer and dairy sectors, while the USA will grow at 3.2%, supported by high processed food consumption and fertilizer use.

Fertilizers will lead the application segment with a 35.2% share, and the synthetic source segment will dominate with a 52.6% share, driven by its cost-effectiveness, high functionality, and widespread use across food, feed, and industrial applications.

The market holds a relatively small but essential share within its parent markets. In the food additives segment, it accounts for around 3% due to its specific use in powdered products to maintain a free-flowing texture. Within feed additives, its share is approximately 4%, driven by the increasing demand for compound feed globally.

In fertilizer additives, it represents nearly 5% as it plays a critical role in preventing clumping and ensuring efficient application. Its share in functional food ingredients is about 2% because it indirectly supports product quality, while in industrial additives, it holds around 1% due to niche applications.

Anti-caking Agents Market Analysis by Top Investment Segments

The market segments include source, product type, application, and region. The source segment covers natural and synthetic sources. The product type segment includes sodium compound, calcium compound, magnesium compound, silicon dioxide, microcrystalline cellulose, and other product types (such as phosphate compounds and tricalcium phosphate).

The application segment comprises food & beverages, animal feed, pharmaceuticals, fertilizers, and other applications (including cosmetics, personal care, and industrial chemicals). The regional segment includes North America, Latin America, Western Europe, Eastern Europe, Balkans & Baltic, Russia & Belarus, Central Asia, East Asia, South Asia & Pacific, and the Middle East & Africa.

Synthetic Source to Lead the Source Segment with 52.6% Market Share in 2025

The synthetic source segment is projected to hold a 52.6% market share in 2025.
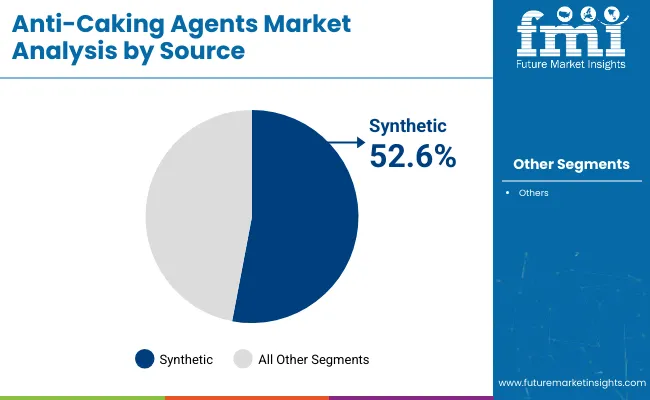
  • This growth is driven by the cost-effectiveness and high efficiency of synthetic anti-caking agents in maintaining product stability.
  • Synthetic agents such as silicon dioxide and sodium compounds are widely used due to their strong moisture absorption and free-flowing properties.

Anti Caking Agents Market By Source

Sodium Compound to Lead the Product Type Segment with Approximately 30% Market Share in 2025

The sodium compound segment is projected to hold a market share of approximately 30% in 2025 within the market.
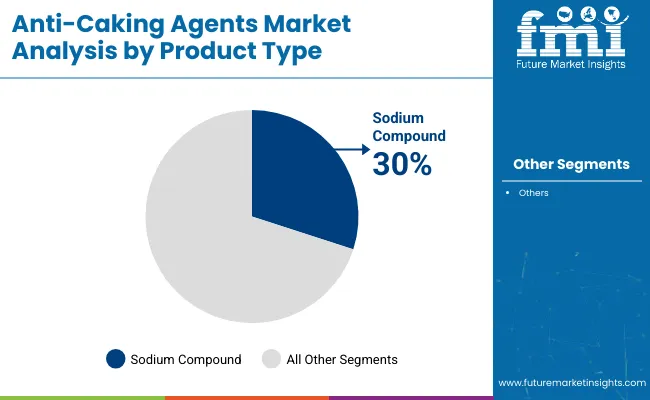
  • Its dominance is driven by widespread use in food and beverage products such as baked goods, noodles, and confectionery, where it acts as a moisture absorber and preservative.
  • Sodium compounds are cost-effective compared to other anti-caking agents, making them highly attractive to manufacturers aiming to optimise production costs without compromising quality.

Anti Caking Agents Market Analysis By Product Type

Fertilizers to Lead the Application Segment with 35.2% Market Share in 2025

The fertilizer segment is expected to remain the most lucrative application segment in the market, holding a 35.2% market share in 2025.
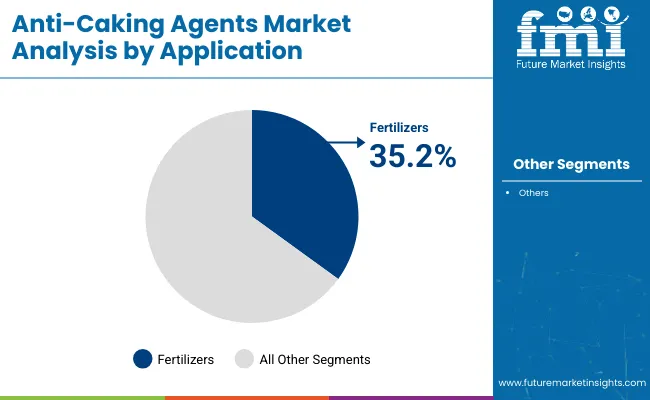
  • This dominance is driven by the essential role of anti-caking agents in preventing clumping and ensuring the free-flowing nature of fertilizers during storage and application.
  • Farmers and large-scale agricultural operations rely on these agents to maintain product quality, enhance application efficiency, and reduce operational downtime caused by clogged machinery.

Anti Caking Agents Market Analysis By Application

Top Anti-caking Agents Market Dynamics

The global market is growing steadily, driven by rising demand for processed and packaged foods, increasing use in fertilizers to enhance product flowability, and advancements in natural and nano-sized anti-caking agent formulations across food, feed, and industrial applications.

Recent Trends in the Anti-caking Agents Market

  • Increasing preference for natural and clean-label anti-caking agents in food products.
  • Growing use of nano-sized anti-caking particles to enhance efficiency with minimal usage.
  • Expansion of production capacities by key players in Asia Pacific and Europe.
  • Rising adoption of anti-caking agents in fertilizers to improve flowability and storage stability.

Challenges in the Anti-caking Agents Market
  • High cost of natural anti-caking agents compared to synthetic alternatives.
  • Stringent regulations in Europe limit the use of certain synthetic additives.
  • Potential adverse effects on food nutritional quality raise health concerns.
  • Intense competition among global and regional players is impacting pricing strategies.

Analyzing Top Countries Producing and Supplying Anti-caking Agents

Anti Caking Agents Market Country Wise Analysis

Among the top five countries, Japan is projected to witness the highest growth in the market with a CAGR of 5.2% during the forecast period, driven by rising demand for instant food mixes and technological advancements. Germany follows with a CAGR of 3.5%, supported by strong fertilizer and food industries.

The USA is expected to grow at 3.2% due to high processed food consumption, while France will see a moderate CAGR of 3.0%, backed by its robust bakery sector. The UK will register the slowest growth among these countries, with a steady CAGR of 2.8%.

The report covers an in-depth analysis of 40+ countries; five top-performing OECD countries are highlighted below. 

USA Anti-Caking Agents Market Analysis

The USA anti-caking agents market is projected to grow at a CAGR of 3.2% during the forecast period.

  • Strong demand for anti-caking agents in dairy, bakery, and beverage sectors.
  • Significant investments in R&D by leading companies like BASF SE.
  • Growing use of fertilizers to maintain free-flowing characteristics.
  • Presence of established food processing and feed manufacturing industries.

Anti-caking Agents Demand Analysis in the UK

Sales of anti-caking agents in the UK are expected to register a steady CAGR of around 2.8% over 2025 to 2035.

  • High consumer preference for natural and organic anti-caking agents.
  • Strong regulations by EFSA ensure product safety standards.
  • Increasing demand in the bakery and confectionery industries.
  • Rising import and distribution of natural anti-caking compounds.

Anti-caking Agents Revenue Analysis in Germany

Sales of anti-caking agents in Germany are projected to grow at a CAGR of 3.5% from 2025-2035.

  • Strong market for fertilizers using anti-caking agents for flowability.
  • Growing demand in dairy powders, spices, and instant mixes.
  • Increasing R&D investments in sustainable product development.
  • Major companies are innovating in natural anti-caking solutions.

France Anti-caking Agents Market Analysis

France’s anti-caking agents revenue is expected to grow at a CAGR of 3.0% during the forecast period.

  • Strong bakery and patisserie industry driving demand.
  • Government regulations supporting food safety standards.
  • Growing use in animal feed and fertilizers.
  • Leading companies expanding distribution networks in France.

Japan Anti-caking Agents Market Analysis

Japan’s anti-caking agent demand is projected to register a CAGR of 5.2% during the forecast period, driven by rapid growth in packaged food consumption, rising demand for instant food mixes, and advancements in food technology enhancing product efficiency and stability.

  • High demand for anti-caking agents in instant noodles and soups.
  • Technological innovation in food processing is driving market growth.
  • Preference for natural anti-caking agents aligns with health trends.
  • Strong presence of local and global manufacturers.

Leading Anti-caking Agent Manufacturers and Suppliers

The market is moderately fragmented, featuring a mix of global leaders and regional players. Top-tier companies such as BASF SE, Solvay SA, Kao Group, Evonik Industries AG, and PPG Industries, Inc. dominate the market through extensive R&D investments, strategic partnerships, and product innovations.

For instance, BASF SE has streamlined its portfolio by divesting non-core businesses, while Solvay SA has invested in expanding its hydrogen peroxide production to meet growing demand. Kao Group has introduced nano-sized anti-caking particles, improving efficiency and aligning with clean-label trends. Evonik Industries AG has focused on sustainable silica production, and PPG Industries, Inc. has developed high-capacity carrying agents for bulk applications.

Recent Anti-caking Agents Industry News:

  • In June 2024, PPG Industries inked a deal with RightShip to bolster its transformation toward sustainability.

Anti-Caking Agents Market Report Scope

Report Attributes Details
Current Total Market Size (2025) USD 866.7 million
Projected Market Size (2035) USD 1,371.2 million
CAGR (2025 to 2035) 4.8%
Base Year for Estimation 2024
Historical Period 2020 to 2024
Projections Period 2025 to 2035
Market Analysis Parameters Revenue in USD million/Volume in kilotons
By Source Natural Source, Synthetic Source
By Product Type Sodium Compound, Calcium Compound, Magnesium Compound, Silicon Dioxide, Microcrystalline Cellulose, Other Product Types (Phosphate Compounds, Tricalcium Phosphate, Potassium Ferrocyanide, Sodium Ferrocyanide, Calcium Silicate, And Talc)
By Application Food & Beverages, Animal Feed, Pharmaceuticals, Fertilizer, Other Applications (Cosmetics, Personal Care Products, And Industrial Chemicals)
Regions Covered North America, Latin America, Western Europe, Eastern Europe, Balkans & Baltic, Russia & Belarus, Central Asia, East Asia, South Asia & Pacific, Middle East & Africa
Countries Covered United States, Canada, United Kingdom, Germany, France, China, Japan, South Korea, Brazil, Australia
Key Players BASF SE, Solvay SA, Kao Group, PPG Industries, Inc., ArrMaz, R. Grace & Co.-Conn., Evonik Industries AG, JELU-WERK J. Ehrler GmbH & Co. KG, Allied Blending LP, EP Minerals, Agropur Ingredients, PQ Corporation, Neelam Aqua & Speciality Chem. (P) Ltd., Dorf Ketal, Omya International AG, and NAQ
Additional Attributes Dollar sales by value, market share analysis by region, and country-wise analysis

Key Segments of the Report

By Product Type:

As per Product Type, the industry has been categorized into Sodium Compound, Calcium Compound, Magnesium Compound, Silicon Dioxide, Microcrystalline cellulose, and Other Product Type.

By Source:

As per Source, the industry has been categorized into Natural Source, and Synthetic Source.

By Application:

This segment is further categorized into Food & Beverages, Pharmaceuticals, Animal Feed, Fertilizer, and Other Applications.

By Region:

Industry analysis has been carried out in key countries of North America, Latin America, Western Europe, Eastern Europe, East Asia, South Asia & Pacific, Central Asia, Russia and Belarus, Balkan & Baltics, and the Middle East & Africa.

Table of Content

  1. Executive Summary
    • Global Market Outlook
    • Demand-side Trends
    • Supply-side Trends
    • Technology Roadmap Analysis
    • Analysis and Recommendations
  2. Market Overview
    • Market Coverage / Taxonomy
    • Market Definition / Scope / Limitations
  3. Market Background
    • Market Dynamics
      • Drivers
      • Restraints
      • Opportunity
      • Trends
    • Scenario Forecast
      • Demand in Optimistic Scenario
      • Demand in Likely Scenario
      • Demand in Conservative Scenario
    • Opportunity Map Analysis
    • Product Life Cycle Analysis
    • Supply Chain Analysis
      • Supply Side Participants and their Roles
        • Producers
        • Mid-Level Participants (Traders/ Agents/ Brokers)
        • Wholesalers and Distributors
      • Value Added and Value Created at Node in the Supply Chain
      • List of Raw Material Suppliers
      • List of Existing and Potential Buyer’s
    • Investment Feasibility Matrix
    • Value Chain Analysis
      • Profit Margin Analysis
      • Wholesalers and Distributors
      • Retailers
    • PESTLE and Porter’s Analysis
    • Regulatory Landscape
      • By Key Regions
      • By Key Countries
    • Regional Parent Market Outlook
    • Production and Consumption Statistics
    • Import and Export Statistics
  4. Global Market Analysis 2020 to 2024 and Forecast, 2025 to 2035
    • Historical Market Size Value (USD Million) & Volume (kilotons) Analysis, 2020 to 2024
    • Current and Future Market Size Value (USD Million) & Volume (kilotons) Projections, 2025 to 2035
      • Y-o-Y Growth Trend Analysis
      • Absolute $ Opportunity Analysis
  5. Global Market Pricing Analysis 2020 to 2024 and Forecast 2025 to 2035
  6. Global Market Analysis 2020 to 2024 and Forecast 2025 to 2035, By Source
    • Introduction / Key Findings
    • Historical Market Size Value (USD Million) & Volume (kilotons) Analysis By Source, 2020 to 2024
    • Current and Future Market Size Value (USD Million) & Volume (kilotons) Analysis and Forecast By Source, 2025 to 2035
      • Natural Source
      • Synthetic Source
    • Y-o-Y Growth Trend Analysis By Source, 2020 to 2024
    • Absolute $ Opportunity Analysis By Source, 2025 to 2035
  7. Global Market Analysis 2020 to 2024 and Forecast 2025 to 2035, By Product Type
    • Introduction / Key Findings
    • Historical Market Size Value (USD Million) & Volume (kilotons) Analysis By Product Type, 2020 to 2024
    • Current and Future Market Size Value (USD Million) & Volume (kilotons) Analysis and Forecast By Product Type, 2025 to 2035
      • Sodium Compound
      • Calcium Compound
      • Magnesium Compound
      • Silicon Dioxide
      • Microcrystalline Cellulose
      • Other Product Types
        • Phosphate Compounds
        • Tricalcium Phosphate
        • Potassium Ferrocyanide
        • Sodium Ferrocyanide
    • Y-o-Y Growth Trend Analysis By Product Type, 2020 to 2024
    • Absolute $ Opportunity Analysis By Product Type, 2025 to 2035
  8. Global Market Analysis 2020 to 2024 and Forecast 2025 to 2035, By Application
    • Introduction / Key Findings
    • Historical Market Size Value (USD Million) & Volume (kilotons) Analysis By Application, 2020 to 2024
    • Current and Future Market Size Value (USD Million) & Volume (kilotons) Analysis and Forecast By Application, 2025 to 2035
      • Food & Beverages
      • Animal Feed
      • Pharmaceuticals
      • Fertilizer
      • Other Applications
        • Cosmetics
        • Personal Care Products
        • Industrial chemicals
    • Y-o-Y Growth Trend Analysis By Application, 2020 to 2024
    • Absolute $ Opportunity Analysis By Application, 2025 to 2035
  9. Global Market Analysis 2020 to 2024 and Forecast 2025 to 2035, By Region
    • Introduction
    • Historical Market Size Value (USD Million) & Volume (kilotons) Analysis By Region, 2020 to 2024
    • Current Market Size Value (USD Million) & Volume (kilotons) Analysis and Forecast By Region, 2025 to 2035
      • USA
      • Latin America
      • Western Europe
      • Eastern Europe
      • East Asia
      • South Asia & Pacific
      • Middle East and Africa
    • Market Attractiveness Analysis By Region
  10. USA Market Analysis 2020 to 2024 and Forecast 2025 to 2035, By Country
    • Historical Market Size Value (USD Million) & Volume (kilotons) Trend Analysis By Market Taxonomy, 2020 to 2024
    • Market Size Value (USD Million) & Volume (kilotons) Forecast By Market Taxonomy, 2025 to 2035
      • By Country
        • Canada
        • Brazil
        • Mexico
        • Argentina
      • By Source
      • By Product Type
      • By Application
    • Market Attractiveness Analysis
      • By Country
      • By Source
      • By Product Type
      • By Application
    • Key Takeaways
  11. Latin America Market Analysis 2020 to 2024 and Forecast 2025 to 2035, By Country
    • Historical Market Size Value (USD Million) & Volume (kilotons) Trend Analysis By Market Taxonomy, 2020 to 2024
    • Market Size Value (USD Million) & Volume (kilotons) Forecast By Market Taxonomy, 2025 to 2035
      • By Country
        • Brazil
        • Argentina
        • Rest of LATAM
      • By Source
      • By Product Type
      • By Application
    • Market Attractiveness Analysis
      • By Country
      • By Source
      • By Product Type
      • By Application
    • Key Takeaways
  12. Western Europe Market Analysis 2020 to 2024 and Forecast 2025 to 2035, By Country
    • Historical Market Size Value (USD Million) & Volume (kilotons) Trend Analysis By Market Taxonomy, 2020 to 2024
    • Market Size Value (USD Million) & Volume (kilotons) Forecast By Market Taxonomy, 2025 to 2035
      • By Country
        • Germany
        • Italy
        • France
        • UK
        • Spain
        • BENELUX
        • Nordic
        • Rest of W.Europe
      • By Source
      • By Product Type
      • By Application
    • Market Attractiveness Analysis
      • By Country
      • By Source
      • By Product Type
      • By Application
    • Key Takeaways
  13. Eastern Europe Market Analysis 2020 to 2024 and Forecast 2025 to 2035, By Country
    • Historical Market Size Value (USD Million) & Volume (kilotons) Trend Analysis By Market Taxonomy, 2020 to 2024
    • Market Size Value (USD Million) & Volume (kilotons) Forecast By Market Taxonomy, 2025 to 2035
      • By Country
        • Russia
        • Hungary
        • Poland
        • Balkan & Baltics
        • Rest of E. Europe
      • By Source
      • By Product Type
      • By Application
    • Market Attractiveness Analysis
      • By Country
      • By Source
      • By Product Type
      • By Application
    • Key Takeaways
  14. East Asia Market Analysis 2020 to 2024 and Forecast 2025 to 2035, By Country
    • Historical Market Size Value (USD Million) & Volume (kilotons) Trend Analysis By Market Taxonomy, 2020 to 2024
    • Market Size Value (USD Million) & Volume (kilotons) Forecast By Market Taxonomy, 2025 to 2035
      • By Country
        • China
        • Japan
        • South Korea
      • By Source
      • By Product Type
      • By Application
    • Market Attractiveness Analysis
      • By Country
      • By Source
      • By Product Type
      • By Application
    • Key Takeaways
  15. South Asia & Pacific Market Analysis 2020 to 2024 and Forecast 2025 to 2035, By Country
    • Historical Market Size Value (USD Million) & Volume (kilotons) Trend Analysis By Market Taxonomy, 2020 to 2024
    • Market Size Value (USD Million) & Volume (kilotons) Forecast By Market Taxonomy, 2025 to 2035
      • By Country
        • India
        • Australia & New Zealand
        • ASEAN
        • Rest of SAP
      • By Source
      • By Product Type
      • By Application
    • Market Attractiveness Analysis
      • By Country
      • By Source
      • By Product Type
      • By Application
    • Key Takeaways
  16. Middle East and Africa Market Analysis 2020 to 2024 and Forecast 2025 to 2035, By Country
    • Historical Market Size Value (USD Million) & Volume (kilotons) Trend Analysis By Market Taxonomy, 2020 to 2024
    • Market Size Value (USD Million) & Volume (kilotons) Forecast By Market Taxonomy, 2025 to 2035
      • By Country
        • GCC Countries
        • Northern Africa
        • South Africa
        • Turkiye
        • Rest of MEA
      • By Source
      • By Product Type
      • By Application
    • Market Attractiveness Analysis
      • By Country
      • By Source
      • By Product Type
      • By Application
    • Key Takeaways
  17. Key Countries Market Analysis
    • USA
      • Pricing Analysis
      • Market Share Analysis, 2024
        • By Source
        • By Product Type
        • By Application
    • Canada
      • Pricing Analysis
      • Market Share Analysis, 2024
        • By Source
        • By Product Type
        • By Application
    • Brazil
      • Pricing Analysis
      • Market Share Analysis, 2024
        • By Source
        • By Product Type
        • By Application
    • Mexico
      • Pricing Analysis
      • Market Share Analysis, 2024
        • By Source
        • By Product Type
        • By Application
    • Argentina
      • Pricing Analysis
      • Market Share Analysis, 2024
        • By Source
        • By Product Type
        • By Application
  18. Market Structure Analysis
    • Competition Dashboard
    • Competition Benchmarking
    • Market Share Analysis of Top Players
      • By Regional
      • By Source
      • By Product Type
      • By Application
  19. Competition Analysis
    • Competition Deep Dive
      • BASF SE
        • Overview
        • Product Portfolio
        • Profitability by Market Segments (Product/Age /Sales Channel/Region)
        • Sales Footprint
        • Strategy Overview
          • Marketing Strategy
          • Product Strategy
          • Channel Strategy
      • Solvay SA
        • Overview
        • Product Portfolio
        • Profitability by Market Segments (Product/Age /Sales Channel/Region)
        • Sales Footprint
        • Strategy Overview
          • Marketing Strategy
          • Product Strategy
          • Channel Strategy
      • Kao Group
        • Overview
        • Product Portfolio
        • Profitability by Market Segments (Product/Age /Sales Channel/Region)
        • Sales Footprint
        • Strategy Overview
          • Marketing Strategy
          • Product Strategy
          • Channel Strategy
      • PPG Industries, Inc.
        • Overview
        • Product Portfolio
        • Profitability by Market Segments (Product/Age /Sales Channel/Region)
        • Sales Footprint
        • Strategy Overview
          • Marketing Strategy
          • Product Strategy
          • Channel Strategy
      • ArrMaz
        • Overview
        • Product Portfolio
        • Profitability by Market Segments (Product/Age /Sales Channel/Region)
        • Sales Footprint
        • Strategy Overview
          • Marketing Strategy
          • Product Strategy
          • Channel Strategy
      • R. Grace & Co.-Conn.
        • Overview
        • Product Portfolio
        • Profitability by Market Segments (Product/Age /Sales Channel/Region)
        • Sales Footprint
        • Strategy Overview
          • Marketing Strategy
          • Product Strategy
          • Channel Strategy
      • Evonik Industries AG
        • Overview
        • Product Portfolio
        • Profitability by Market Segments (Product/Age /Sales Channel/Region)
        • Sales Footprint
        • Strategy Overview
          • Marketing Strategy
          • Product Strategy
          • Channel Strategy
      • JELU-WERK J. Ehrler GmbH & Co. KG
        • Overview
        • Product Portfolio
        • Profitability by Market Segments (Product/Age /Sales Channel/Region)
        • Sales Footprint
        • Strategy Overview
          • Marketing Strategy
          • Product Strategy
          • Channel Strategy
      • Allied Blending LP
        • Overview
        • Product Portfolio
        • Profitability by Market Segments (Product/Age /Sales Channel/Region)
        • Sales Footprint
        • Strategy Overview
          • Marketing Strategy
          • Product Strategy
          • Channel Strategy
      • EP Minerals
        • Overview
        • Product Portfolio
        • Profitability by Market Segments (Product/Age /Sales Channel/Region)
        • Sales Footprint
        • Strategy Overview
          • Marketing Strategy
          • Product Strategy
          • Channel Strategy
      • Agropur Ingredients
        • Overview
        • Product Portfolio
        • Profitability by Market Segments (Product/Age /Sales Channel/Region)
        • Sales Footprint
        • Strategy Overview
          • Marketing Strategy
          • Product Strategy
          • Channel Strategy
      • PQ Corporation
        • Overview
        • Product Portfolio
        • Profitability by Market Segments (Product/Age /Sales Channel/Region)
        • Sales Footprint
        • Strategy Overview
          • Marketing Strategy
          • Product Strategy
          • Channel Strategy
      • Neelam Aqua & Speciality Chem. (P) Ltd.
        • Overview
        • Product Portfolio
        • Profitability by Market Segments (Product/Age /Sales Channel/Region)
        • Sales Footprint
        • Strategy Overview
          • Marketing Strategy
          • Product Strategy
          • Channel Strategy
      • Dorf Ketal
        • Overview
        • Product Portfolio
        • Profitability by Market Segments (Product/Age /Sales Channel/Region)
        • Sales Footprint
        • Strategy Overview
          • Marketing Strategy
          • Product Strategy
          • Channel Strategy
      • Omya International AG
        • Overview
        • Product Portfolio
        • Profitability by Market Segments (Product/Age /Sales Channel/Region)
        • Sales Footprint
        • Strategy Overview
          • Marketing Strategy
          • Product Strategy
          • Channel Strategy
      • NAQ
        • Overview
        • Product Portfolio
        • Profitability by Market Segments (Product/Age /Sales Channel/Region)
        • Sales Footprint
        • Strategy Overview
          • Marketing Strategy
          • Product Strategy
          • Channel Strategy
  20. Assumptions & Acronyms Used
  21. Research Methodology

List of Tables

  • Table 1: Global Market Value (USD Million) Forecast by Region, 2020-2035
  • Table 2: Global Market Volume (kilotons) Forecast by Region, 2020-2035
  • Table 3: Global Market Value (USD Million) Forecast by Source, 2020-2035
  • Table 4: Global Market Volume (kilotons) Forecast by Source, 2020-2035
  • Table 5: Global Market Value (USD Million) Forecast by Product Type, 2020-2035
  • Table 6: Global Market Volume (kilotons) Forecast by Product Type, 2020-2035
  • Table 7: Global Market Value (USD Million) Forecast by Application, 2020-2035
  • Table 8: Global Market Volume (kilotons) Forecast by Application, 2020-2035
  • Table 9: USA Market Value (USD Million) Forecast by Country, 2020-2035
  • Table 10: USA Market Volume (kilotons) Forecast by Country, 2020-2035
  • Table 11: USA Market Value (USD Million) Forecast by Source, 2020-2035
  • Table 12: USA Market Volume (kilotons) Forecast by Source, 2020-2035
  • Table 13: USA Market Value (USD Million) Forecast by Product Type, 2020-2035
  • Table 14: USA Market Volume (kilotons) Forecast by Product Type, 2020-2035
  • Table 15: USA Market Value (USD Million) Forecast by Application, 2020-2035
  • Table 16: USA Market Volume (kilotons) Forecast by Application, 2020-2035
  • Table 17: Latin America Market Value (USD Million) Forecast by Country, 2020-2035
  • Table 18: Latin America Market Volume (kilotons) Forecast by Country, 2020-2035
  • Table 19: Latin America Market Value (USD Million) Forecast by Source, 2020-2035
  • Table 20: Latin America Market Volume (kilotons) Forecast by Source, 2020-2035
  • Table 21: Latin America Market Value (USD Million) Forecast by Product Type, 2020-2035
  • Table 22: Latin America Market Volume (kilotons) Forecast by Product Type, 2020-2035
  • Table 23: Latin America Market Value (USD Million) Forecast by Application, 2020-2035
  • Table 24: Latin America Market Volume (kilotons) Forecast by Application, 2020-2035
  • Table 25: Western Europe Market Value (USD Million) Forecast by Country, 2020-2035
  • Table 26: Western Europe Market Volume (kilotons) Forecast by Country, 2020-2035
  • Table 27: Western Europe Market Value (USD Million) Forecast by Source, 2020-2035
  • Table 28: Western Europe Market Volume (kilotons) Forecast by Source, 2020-2035
  • Table 29: Western Europe Market Value (USD Million) Forecast by Product Type, 2020-2035
  • Table 30: Western Europe Market Volume (kilotons) Forecast by Product Type, 2020-2035
  • Table 31: Western Europe Market Value (USD Million) Forecast by Application, 2020-2035
  • Table 32: Western Europe Market Volume (kilotons) Forecast by Application, 2020-2035
  • Table 33: Eastern Europe Market Value (USD Million) Forecast by Country, 2020-2035
  • Table 34: Eastern Europe Market Volume (kilotons) Forecast by Country, 2020-2035
  • Table 35: Eastern Europe Market Value (USD Million) Forecast by Source, 2020-2035
  • Table 36: Eastern Europe Market Volume (kilotons) Forecast by Source, 2020-2035
  • Table 37: Eastern Europe Market Value (USD Million) Forecast by Product Type, 2020-2035
  • Table 38: Eastern Europe Market Volume (kilotons) Forecast by Product Type, 2020-2035
  • Table 39: Eastern Europe Market Value (USD Million) Forecast by Application, 2020-2035
  • Table 40: Eastern Europe Market Volume (kilotons) Forecast by Application, 2020-2035
  • Table 41: East Asia Market Value (USD Million) Forecast by Country, 2020-2035
  • Table 42: East Asia Market Volume (kilotons) Forecast by Country, 2020-2035
  • Table 43: East Asia Market Value (USD Million) Forecast by Source, 2020-2035
  • Table 44: East Asia Market Volume (kilotons) Forecast by Source, 2020-2035
  • Table 45: East Asia Market Value (USD Million) Forecast by Product Type, 2020-2035
  • Table 46: East Asia Market Volume (kilotons) Forecast by Product Type, 2020-2035
  • Table 47: East Asia Market Value (USD Million) Forecast by Application, 2020-2035
  • Table 48: East Asia Market Volume (kilotons) Forecast by Application, 2020-2035
  • Table 49: South Asia & Pacific Market Value (USD Million) Forecast by Country, 2020-2035
  • Table 50: South Asia & Pacific Market Volume (kilotons) Forecast by Country, 2020-2035
  • Table 51: South Asia & Pacific Market Value (USD Million) Forecast by Source, 2020-2035
  • Table 52: South Asia & Pacific Market Volume (kilotons) Forecast by Source, 2020-2035
  • Table 53: South Asia & Pacific Market Value (USD Million) Forecast by Product Type, 2020-2035
  • Table 54: South Asia & Pacific Market Volume (kilotons) Forecast by Product Type, 2020-2035
  • Table 55: South Asia & Pacific Market Value (USD Million) Forecast by Application, 2020-2035
  • Table 56: South Asia & Pacific Market Volume (kilotons) Forecast by Application, 2020-2035
  • Table 57: Middle East and Africa Market Value (USD Million) Forecast by Country, 2020-2035
  • Table 58: Middle East and Africa Market Volume (kilotons) Forecast by Country, 2020-2035
  • Table 59: Middle East and Africa Market Value (USD Million) Forecast by Source, 2020-2035
  • Table 60: Middle East and Africa Market Volume (kilotons) Forecast by Source, 2020-2035
  • Table 61: Middle East and Africa Market Value (USD Million) Forecast by Product Type, 2020-2035
  • Table 62: Middle East and Africa Market Volume (kilotons) Forecast by Product Type, 2020-2035
  • Table 63: Middle East and Africa Market Value (USD Million) Forecast by Application, 2020-2035
  • Table 64: Middle East and Africa Market Volume (kilotons) Forecast by Application, 2020-2035

List of Figures

  • Figure 1: Global Market Volume (kilotons) Forecast 2020-2035
  • Figure 2: Global Market Pricing Analysis
  • Figure 3: Global Market Value (USD Million) Forecast 2020-2035
  • Figure 4: Global Market Value Share and BPS Analysis by Source, 2025 and 2035
  • Figure 5: Global Market Y-o-Y Growth Comparison by Source, 2025-2035
  • Figure 6: Global Market Attractiveness Analysis by Source
  • Figure 7: Global Market Value Share and BPS Analysis by Product Type, 2025 and 2035
  • Figure 8: Global Market Y-o-Y Growth Comparison by Product Type, 2025-2035
  • Figure 9: Global Market Attractiveness Analysis by Product Type
  • Figure 10: Global Market Value Share and BPS Analysis by Application, 2025 and 2035
  • Figure 11: Global Market Y-o-Y Growth Comparison by Application, 2025-2035
  • Figure 12: Global Market Attractiveness Analysis by Application
  • Figure 13: Global Market Value (USD Million) Share and BPS Analysis by Region, 2025 and 2035
  • Figure 14: Global Market Y-o-Y Growth Comparison by Region, 2025-2035
  • Figure 15: Global Market Attractiveness Analysis by Region
  • Figure 16: USA Market Incremental $ Opportunity, 2025-2035
  • Figure 17: Latin America Market Incremental $ Opportunity, 2025-2035
  • Figure 18: Western Europe Market Incremental $ Opportunity, 2025-2035
  • Figure 19: Eastern Europe Market Incremental $ Opportunity, 2025-2035
  • Figure 20: East Asia Market Incremental $ Opportunity, 2025-2035
  • Figure 21: South Asia & Pacific Market Incremental $ Opportunity, 2025-2035
  • Figure 22: Middle East and Africa Market Incremental $ Opportunity, 2025-2035
  • Figure 23: USA Market Value Share and BPS Analysis by Country, 2025 and 2035
  • Figure 24: USA Market Value Share and BPS Analysis by Source, 2025 and 2035
  • Figure 25: USA Market Y-o-Y Growth Comparison by Source, 2025-2035
  • Figure 26: USA Market Attractiveness Analysis by Source
  • Figure 27: USA Market Value Share and BPS Analysis by Product Type, 2025 and 2035
  • Figure 28: USA Market Y-o-Y Growth Comparison by Product Type, 2025-2035
  • Figure 29: USA Market Attractiveness Analysis by Product Type
  • Figure 30: USA Market Value Share and BPS Analysis by Application, 2025 and 2035
  • Figure 31: USA Market Y-o-Y Growth Comparison by Application, 2025-2035
  • Figure 32: USA Market Attractiveness Analysis by Application
  • Figure 33: Latin America Market Value Share and BPS Analysis by Country, 2025 and 2035
  • Figure 34: Latin America Market Value Share and BPS Analysis by Source, 2025 and 2035
  • Figure 35: Latin America Market Y-o-Y Growth Comparison by Source, 2025-2035
  • Figure 36: Latin America Market Attractiveness Analysis by Source
  • Figure 37: Latin America Market Value Share and BPS Analysis by Product Type, 2025 and 2035
  • Figure 38: Latin America Market Y-o-Y Growth Comparison by Product Type, 2025-2035
  • Figure 39: Latin America Market Attractiveness Analysis by Product Type
  • Figure 40: Latin America Market Value Share and BPS Analysis by Application, 2025 and 2035
  • Figure 41: Latin America Market Y-o-Y Growth Comparison by Application, 2025-2035
  • Figure 42: Latin America Market Attractiveness Analysis by Application
  • Figure 43: Western Europe Market Value Share and BPS Analysis by Country, 2025 and 2035
  • Figure 44: Western Europe Market Value Share and BPS Analysis by Source, 2025 and 2035
  • Figure 45: Western Europe Market Y-o-Y Growth Comparison by Source, 2025-2035
  • Figure 46: Western Europe Market Attractiveness Analysis by Source
  • Figure 47: Western Europe Market Value Share and BPS Analysis by Product Type, 2025 and 2035
  • Figure 48: Western Europe Market Y-o-Y Growth Comparison by Product Type, 2025-2035
  • Figure 49: Western Europe Market Attractiveness Analysis by Product Type
  • Figure 50: Western Europe Market Value Share and BPS Analysis by Application, 2025 and 2035
  • Figure 51: Western Europe Market Y-o-Y Growth Comparison by Application, 2025-2035
  • Figure 52: Western Europe Market Attractiveness Analysis by Application
  • Figure 53: Eastern Europe Market Value Share and BPS Analysis by Country, 2025 and 2035
  • Figure 54: Eastern Europe Market Value Share and BPS Analysis by Source, 2025 and 2035
  • Figure 55: Eastern Europe Market Y-o-Y Growth Comparison by Source, 2025-2035
  • Figure 56: Eastern Europe Market Attractiveness Analysis by Source
  • Figure 57: Eastern Europe Market Value Share and BPS Analysis by Product Type, 2025 and 2035
  • Figure 58: Eastern Europe Market Y-o-Y Growth Comparison by Product Type, 2025-2035
  • Figure 59: Eastern Europe Market Attractiveness Analysis by Product Type
  • Figure 60: Eastern Europe Market Value Share and BPS Analysis by Application, 2025 and 2035
  • Figure 61: Eastern Europe Market Y-o-Y Growth Comparison by Application, 2025-2035
  • Figure 62: Eastern Europe Market Attractiveness Analysis by Application
  • Figure 63: East Asia Market Value Share and BPS Analysis by Country, 2025 and 2035
  • Figure 64: East Asia Market Value Share and BPS Analysis by Source, 2025 and 2035
  • Figure 65: East Asia Market Y-o-Y Growth Comparison by Source, 2025-2035
  • Figure 66: East Asia Market Attractiveness Analysis by Source
  • Figure 67: East Asia Market Value Share and BPS Analysis by Product Type, 2025 and 2035
  • Figure 68: East Asia Market Y-o-Y Growth Comparison by Product Type, 2025-2035
  • Figure 69: East Asia Market Attractiveness Analysis by Product Type
  • Figure 70: East Asia Market Value Share and BPS Analysis by Application, 2025 and 2035
  • Figure 71: East Asia Market Y-o-Y Growth Comparison by Application, 2025-2035
  • Figure 72: East Asia Market Attractiveness Analysis by Application
  • Figure 73: South Asia & Pacific Market Value Share and BPS Analysis by Country, 2025 and 2035
  • Figure 74: South Asia & Pacific Market Value Share and BPS Analysis by Source, 2025 and 2035
  • Figure 75: South Asia & Pacific Market Y-o-Y Growth Comparison by Source, 2025-2035
  • Figure 76: South Asia & Pacific Market Attractiveness Analysis by Source
  • Figure 77: South Asia & Pacific Market Value Share and BPS Analysis by Product Type, 2025 and 2035
  • Figure 78: South Asia & Pacific Market Y-o-Y Growth Comparison by Product Type, 2025-2035
  • Figure 79: South Asia & Pacific Market Attractiveness Analysis by Product Type
  • Figure 80: South Asia & Pacific Market Value Share and BPS Analysis by Application, 2025 and 2035
  • Figure 81: South Asia & Pacific Market Y-o-Y Growth Comparison by Application, 2025-2035
  • Figure 82: South Asia & Pacific Market Attractiveness Analysis by Application
  • Figure 83: Middle East and Africa Market Value Share and BPS Analysis by Country, 2025 and 2035
  • Figure 84: Middle East and Africa Market Value Share and BPS Analysis by Source, 2025 and 2035
  • Figure 85: Middle East and Africa Market Y-o-Y Growth Comparison by Source, 2025-2035
  • Figure 86: Middle East and Africa Market Attractiveness Analysis by Source
  • Figure 87: Middle East and Africa Market Value Share and BPS Analysis by Product Type, 2025 and 2035
  • Figure 88: Middle East and Africa Market Y-o-Y Growth Comparison by Product Type, 2025-2035
  • Figure 89: Middle East and Africa Market Attractiveness Analysis by Product Type
  • Figure 90: Middle East and Africa Market Value Share and BPS Analysis by Application, 2025 and 2035
  • Figure 91: Middle East and Africa Market Y-o-Y Growth Comparison by Application, 2025-2035
  • Figure 92: Middle East and Africa Market Attractiveness Analysis by Application
  • Figure 93: Global Market - Tier Structure Analysis
  • Figure 94: Global Market - Company Share Analysis

Frequently Asked Questions

What is the market size of anti-caking agents in 2025?

The market is valued at USD 866.7 million in 2025.

What will be the anti-caking agents market size by 2035?

The market is projected to reach USD 1,371.2 million by 2035.

Which is the fastest-growing country in the anti-caking agents market?

Japan is the fastest-growing country with a CAGR of 5.2%.

Which segment leads the anti-caking agents market by application?

The fertilizer segment leads with a 35.2% market share in 2025.

What is the projected CAGR of the anti-caking agents market from 2025 to 2035?

The market is projected to grow at a CAGR of 4.8% during this period.

Explore Similar Insights

Future Market Insights

Anti-Caking Agents Market