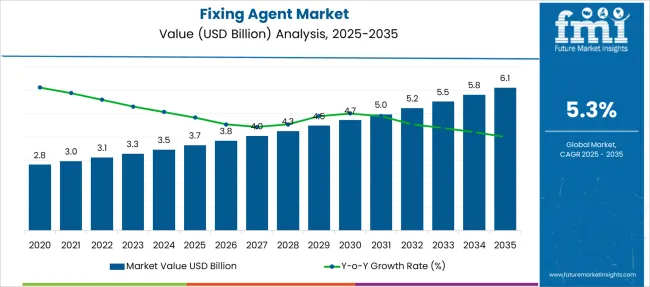
The fixing agent market is likely to register a CAGR of 5.3% during the forecast period, and is anticipated to reach a market share of USD 5.24 Billion in 2032, from USD 2.97 Billion in 2021.
Since the textile printing pattern has changed as a result of changing fashion trends and technical breakthroughs, there is a large demand for fixing agent.
Attributes | Details |
---|---|
Fixing Agent Market CAGR | 5.3% |
Fixing Agent Market Size (2021) | USD 2.97 billion |
Fixing Agent Market Size (2032) | USD 5.24 billion |
Demand for fixing agent is huge, as a fixing agent is a key component in the dyeing and printing industries, as it aids in improving dye color fastness. Its prominent qualities include effective wash resistance, stiffness, flame resistance, and a relatively higher crease, among others, creating a pool for sales of fixing agent.
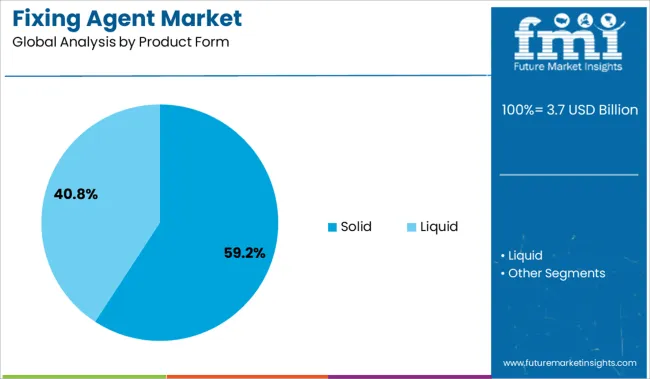
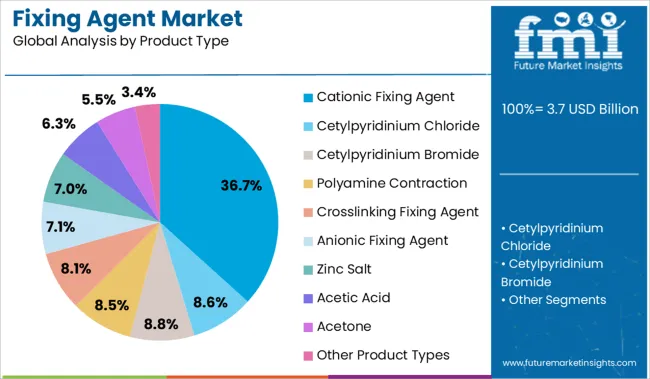
The fixing agent is segmented into two product forms: solid and liquid. It is divided into two forms based on the presence of an ion: cationic and anionic fixing agents, affecting the preferences and demand for fixing agents among its end users.
The demand for fixing agent is accelerating as it is utilized in the dyestuff business, food and beverage industry, chemicals, polymer industry, and other end-user sectors. The wide application is the main contributor to higher sales of fixing agent.
The textile industry has undergone revolutionary changes in recent years, with the textile printing pattern changing as a result of changing fashion trends and technical improvements, which is projected to drive the global fixing agent market share significantly.
Sales of fixing agent are increasing, as it is a vital ingredient in dyeing applications, according to the printing industry. As a result, by the end of the forecast period, customers who are increasingly interested in high-quality printed clothes are expected to have a favorable impact on the global fixing agent market growth.
For example, worldwide garment consumption was expected to be USD 1.8 trillion in 2017, accounting for about 2% of global GDP of USD 79.3 trillion. The sales of global fixing agent, on the other hand, are being hampered by rising raw material prices.
Furthermore, the food and beverage industry's demand for fixing agent will be hampered by the strict requirements related to product food applications.
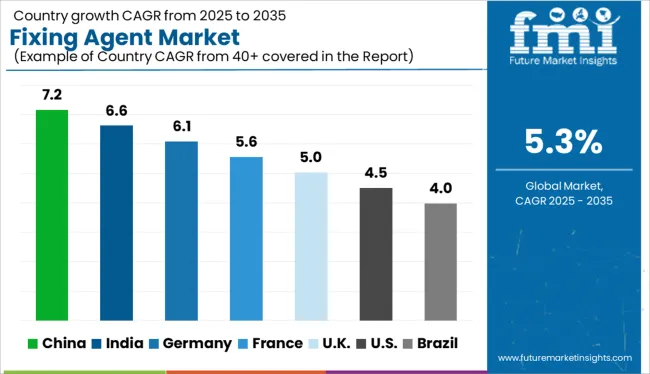
Geographically, the fixing agent market outlook is influenced by each region's textile and dye industries. The Asia Pacific region, excluding Japan, is anticipated to account for one-fourth of the global fixing agent market size.
Factors contributing to the sales of fixing agent in the APEJ region include economies with large populations and extensive industrial infrastructure, such as China and India. As a result, the Asia Pacific fixing agent market is expected to grow at a rapid pace throughout the forecast period.
In terms of fixing agent market volume share, Europe and North America are expected to grab half of the market during the forecast period, followed by Asia Pacific. Over the projected period, activities such as refinery repairs, textile industry enhancements, and capacity restarts in the GCC nations of the Middle East and Africa are expected to depress demand for fixing agent.
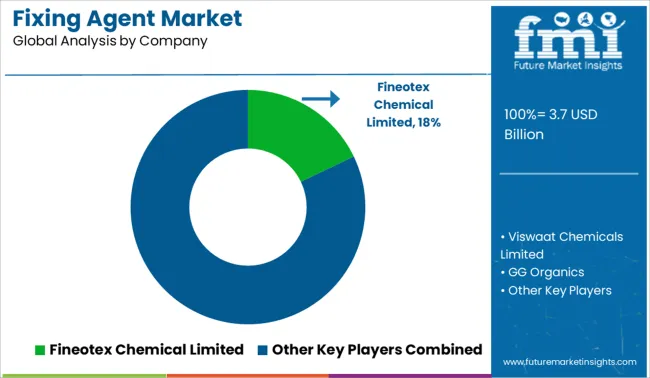
Few global fixing agent key players are Fineotex Chemical Limited, Viswaat Chemicals Limited, GG Organics, Protex Korea, CHT Group, eksoy Chemicals, HT Fine Chemical Co., Ltd., SENKA Corporation, PROTEX, D. K. CORPORATION, Piedmont Chemical Industries, NICCA Chemical, Avocet Dye & Chemical, S D International, Jain Chem, Vertellus Holdings, Achitex Minerva Spa, and among others.
To solidify their market position and increase sales of fire retardant coatings, these companies are utilizing various strategies, such as mergers and acquisitions, partnerships, collaborations, to cope up with the sales of fixing agent.
Report Attribute | Details |
---|---|
Growth Rate | CAGR of 5.3% from 2022 to 2032 |
Base Year for Estimation | 2021 |
Historical Data | 2015 to 2020 |
Forecast Period | 2022 to 2032 |
Quantitative Units | Revenue in USD Million, Volume in Kilotons and CAGR from 2022 to 2032 |
Report Coverage | Revenue Forecast, Volume Forecast, Company Ranking, Competitive Landscape, Growth Factors, Trends and Pricing Analysis |
Segments Covered | Application, Product Type, Product form, Region |
Regions Covered | North America; Latin America; Europe; South Asia; East Asia; Oceania; Middle East and Africa |
Key Countries Profiled | USA, Canada, Brazil, Argentina, Germany, UK, France, Spain, Italy, Nordics, BENELUX, Australia & New Zealand, China, India, ASEAN, GCC, South Africa |
Key Companies Profiled | Fineotex Chemical Limited; Viswaat Chemicals Limited; GG Organics, Protex Korea; CHT Group; eksoy Chemicals; HT Fine Chemical Co., Ltd.; SENKA Corporation; PROTEX; D. K. CORPORATION; Piedmont Chemical Industries; NICCA Chemical; Avocet Dye & Chemical; S D International; Jain Chem; Vertellus Holdings; Achitex Minerva Spa |
Customization | Available Upon Request |
Table 1: Global Fixing Agent Market Value (US$ Mn) Forecast by Region, 2017-2032
Table 2: Global Fixing Agent Market Volume (Tons) Forecast by Region, 2017-2032
Table 3: Global Fixing Agent Market Value (US$ Mn) Forecast by Product Form, 2017-2032
Table 4: Global Fixing Agent Market Volume (Tons) Forecast by Product Form, 2017-2032
Table 5: Global Fixing Agent Market Value (US$ Mn) Forecast by Product Type, 2017-2032
Table 6: Global Fixing Agent Market Volume (Tons) Forecast by Product Type, 2017-2032
Table 7: North America Fixing Agent Market Value (US$ Mn) Forecast by Country, 2017-2032
Table 8: North America Fixing Agent Market Volume (Tons) Forecast by Country, 2017-2032
Table 9: North America Fixing Agent Market Value (US$ Mn) Forecast by Product Form, 2017-2032
Table 10: North America Fixing Agent Market Volume (Tons) Forecast by Product Form, 2017-2032
Table 11: North America Fixing Agent Market Value (US$ Mn) Forecast by Product Type, 2017-2032
Table 12: North America Fixing Agent Market Volume (Tons) Forecast by Product Type, 2017-2032
Table 13: Latin America Fixing Agent Market Value (US$ Mn) Forecast by Country, 2017-2032
Table 14: Latin America Fixing Agent Market Volume (Tons) Forecast by Country, 2017-2032
Table 15: Latin America Fixing Agent Market Value (US$ Mn) Forecast by Product Form, 2017-2032
Table 16: Latin America Fixing Agent Market Volume (Tons) Forecast by Product Form, 2017-2032
Table 17: Latin America Fixing Agent Market Value (US$ Mn) Forecast by Product Type, 2017-2032
Table 18: Latin America Fixing Agent Market Volume (Tons) Forecast by Product Type, 2017-2032
Table 19: Europe Fixing Agent Market Value (US$ Mn) Forecast by Country, 2017-2032
Table 20: Europe Fixing Agent Market Volume (Tons) Forecast by Country, 2017-2032
Table 21: Europe Fixing Agent Market Value (US$ Mn) Forecast by Product Form, 2017-2032
Table 22: Europe Fixing Agent Market Volume (Tons) Forecast by Product Form, 2017-2032
Table 23: Europe Fixing Agent Market Value (US$ Mn) Forecast by Product Type, 2017-2032
Table 24: Europe Fixing Agent Market Volume (Tons) Forecast by Product Type, 2017-2032
Table 25: East Asia Fixing Agent Market Value (US$ Mn) Forecast by Country, 2017-2032
Table 26: East Asia Fixing Agent Market Volume (Tons) Forecast by Country, 2017-2032
Table 27: East Asia Fixing Agent Market Value (US$ Mn) Forecast by Product Form, 2017-2032
Table 28: East Asia Fixing Agent Market Volume (Tons) Forecast by Product Form, 2017-2032
Table 29: East Asia Fixing Agent Market Value (US$ Mn) Forecast by Product Type, 2017-2032
Table 30: East Asia Fixing Agent Market Volume (Tons) Forecast by Product Type, 2017-2032
Table 31: South Asia & Pacific Fixing Agent Market Value (US$ Mn) Forecast by Country, 2017-2032
Table 32: South Asia & Pacific Fixing Agent Market Volume (Tons) Forecast by Country, 2017-2032
Table 33: South Asia & Pacific Fixing Agent Market Value (US$ Mn) Forecast by Product Form, 2017-2032
Table 34: South Asia & Pacific Fixing Agent Market Volume (Tons) Forecast by Product Form, 2017-2032
Table 35: South Asia & Pacific Fixing Agent Market Value (US$ Mn) Forecast by Product Type, 2017-2032
Table 36: South Asia & Pacific Fixing Agent Market Volume (Tons) Forecast by Product Type, 2017-2032
Table 37: MEA Fixing Agent Market Value (US$ Mn) Forecast by Country, 2017-2032
Table 38: MEA Fixing Agent Market Volume (Tons) Forecast by Country, 2017-2032
Table 39: MEA Fixing Agent Market Value (US$ Mn) Forecast by Product Form, 2017-2032
Table 40: MEA Fixing Agent Market Volume (Tons) Forecast by Product Form, 2017-2032
Table 41: MEA Fixing Agent Market Value (US$ Mn) Forecast by Product Type, 2017-2032
Table 42: MEA Fixing Agent Market Volume (Tons) Forecast by Product Type, 2017-2032
Figure 1: Global Fixing Agent Market Value (US$ Mn) by Product Form, 2022-2032
Figure 2: Global Fixing Agent Market Value (US$ Mn) by Product Type, 2022-2032
Figure 3: Global Fixing Agent Market Value (US$ Mn) by Region, 2022-2032
Figure 4: Global Fixing Agent Market Value (US$ Mn) Analysis by Region, 2017-2032
Figure 5: Global Fixing Agent Market Volume (Tons) Analysis by Region, 2017-2032
Figure 6: Global Fixing Agent Market Value Share (%) and BPS Analysis by Region, 2022-2032
Figure 7: Global Fixing Agent Market Y-o-Y Growth (%) Projections by Region, 2022-2032
Figure 8: Global Fixing Agent Market Value (US$ Mn) Analysis by Product Form, 2017-2032
Figure 9: Global Fixing Agent Market Volume (Tons) Analysis by Product Form, 2017-2032
Figure 10: Global Fixing Agent Market Value Share (%) and BPS Analysis by Product Form, 2022-2032
Figure 11: Global Fixing Agent Market Y-o-Y Growth (%) Projections by Product Form, 2022-2032
Figure 12: Global Fixing Agent Market Value (US$ Mn) Analysis by Product Type, 2017-2032
Figure 13: Global Fixing Agent Market Volume (Tons) Analysis by Product Type, 2017-2032
Figure 14: Global Fixing Agent Market Value Share (%) and BPS Analysis by Product Type, 2022-2032
Figure 15: Global Fixing Agent Market Y-o-Y Growth (%) Projections by Product Type, 2022-2032
Figure 16: Global Fixing Agent Market Attractiveness by Product Form, 2022-2032
Figure 17: Global Fixing Agent Market Attractiveness by Product Type, 2022-2032
Figure 18: Global Fixing Agent Market Attractiveness by Region, 2022-2032
Figure 19: North America Fixing Agent Market Value (US$ Mn) by Product Form, 2022-2032
Figure 20: North America Fixing Agent Market Value (US$ Mn) by Product Type, 2022-2032
Figure 21: North America Fixing Agent Market Value (US$ Mn) by Country, 2022-2032
Figure 22: North America Fixing Agent Market Value (US$ Mn) Analysis by Country, 2017-2032
Figure 23: North America Fixing Agent Market Volume (Tons) Analysis by Country, 2017-2032
Figure 24: North America Fixing Agent Market Value Share (%) and BPS Analysis by Country, 2022-2032
Figure 25: North America Fixing Agent Market Y-o-Y Growth (%) Projections by Country, 2022-2032
Figure 26: North America Fixing Agent Market Value (US$ Mn) Analysis by Product Form, 2017-2032
Figure 27: North America Fixing Agent Market Volume (Tons) Analysis by Product Form, 2017-2032
Figure 28: North America Fixing Agent Market Value Share (%) and BPS Analysis by Product Form, 2022-2032
Figure 29: North America Fixing Agent Market Y-o-Y Growth (%) Projections by Product Form, 2022-2032
Figure 30: North America Fixing Agent Market Value (US$ Mn) Analysis by Product Type, 2017-2032
Figure 31: North America Fixing Agent Market Volume (Tons) Analysis by Product Type, 2017-2032
Figure 32: North America Fixing Agent Market Value Share (%) and BPS Analysis by Product Type, 2022-2032
Figure 33: North America Fixing Agent Market Y-o-Y Growth (%) Projections by Product Type, 2022-2032
Figure 34: North America Fixing Agent Market Attractiveness by Product Form, 2022-2032
Figure 35: North America Fixing Agent Market Attractiveness by Product Type, 2022-2032
Figure 36: North America Fixing Agent Market Attractiveness by Country, 2022-2032
Figure 37: Latin America Fixing Agent Market Value (US$ Mn) by Product Form, 2022-2032
Figure 38: Latin America Fixing Agent Market Value (US$ Mn) by Product Type, 2022-2032
Figure 39: Latin America Fixing Agent Market Value (US$ Mn) by Country, 2022-2032
Figure 40: Latin America Fixing Agent Market Value (US$ Mn) Analysis by Country, 2017-2032
Figure 41: Latin America Fixing Agent Market Volume (Tons) Analysis by Country, 2017-2032
Figure 42: Latin America Fixing Agent Market Value Share (%) and BPS Analysis by Country, 2022-2032
Figure 43: Latin America Fixing Agent Market Y-o-Y Growth (%) Projections by Country, 2022-2032
Figure 44: Latin America Fixing Agent Market Value (US$ Mn) Analysis by Product Form, 2017-2032
Figure 45: Latin America Fixing Agent Market Volume (Tons) Analysis by Product Form, 2017-2032
Figure 46: Latin America Fixing Agent Market Value Share (%) and BPS Analysis by Product Form, 2022-2032
Figure 47: Latin America Fixing Agent Market Y-o-Y Growth (%) Projections by Product Form, 2022-2032
Figure 48: Latin America Fixing Agent Market Value (US$ Mn) Analysis by Product Type, 2017-2032
Figure 49: Latin America Fixing Agent Market Volume (Tons) Analysis by Product Type, 2017-2032
Figure 50: Latin America Fixing Agent Market Value Share (%) and BPS Analysis by Product Type, 2022-2032
Figure 51: Latin America Fixing Agent Market Y-o-Y Growth (%) Projections by Product Type, 2022-2032
Figure 52: Latin America Fixing Agent Market Attractiveness by Product Form, 2022-2032
Figure 53: Latin America Fixing Agent Market Attractiveness by Product Type, 2022-2032
Figure 54: Latin America Fixing Agent Market Attractiveness by Country, 2022-2032
Figure 55: Europe Fixing Agent Market Value (US$ Mn) by Product Form, 2022-2032
Figure 56: Europe Fixing Agent Market Value (US$ Mn) by Product Type, 2022-2032
Figure 57: Europe Fixing Agent Market Value (US$ Mn) by Country, 2022-2032
Figure 58: Europe Fixing Agent Market Value (US$ Mn) Analysis by Country, 2017-2032
Figure 59: Europe Fixing Agent Market Volume (Tons) Analysis by Country, 2017-2032
Figure 60: Europe Fixing Agent Market Value Share (%) and BPS Analysis by Country, 2022-2032
Figure 61: Europe Fixing Agent Market Y-o-Y Growth (%) Projections by Country, 2022-2032
Figure 62: Europe Fixing Agent Market Value (US$ Mn) Analysis by Product Form, 2017-2032
Figure 63: Europe Fixing Agent Market Volume (Tons) Analysis by Product Form, 2017-2032
Figure 64: Europe Fixing Agent Market Value Share (%) and BPS Analysis by Product Form, 2022-2032
Figure 65: Europe Fixing Agent Market Y-o-Y Growth (%) Projections by Product Form, 2022-2032
Figure 66: Europe Fixing Agent Market Value (US$ Mn) Analysis by Product Type, 2017-2032
Figure 67: Europe Fixing Agent Market Volume (Tons) Analysis by Product Type, 2017-2032
Figure 68: Europe Fixing Agent Market Value Share (%) and BPS Analysis by Product Type, 2022-2032
Figure 69: Europe Fixing Agent Market Y-o-Y Growth (%) Projections by Product Type, 2022-2032
Figure 70: Europe Fixing Agent Market Attractiveness by Product Form, 2022-2032
Figure 71: Europe Fixing Agent Market Attractiveness by Product Type, 2022-2032
Figure 72: Europe Fixing Agent Market Attractiveness by Country, 2022-2032
Figure 73: East Asia Fixing Agent Market Value (US$ Mn) by Product Form, 2022-2032
Figure 74: East Asia Fixing Agent Market Value (US$ Mn) by Product Type, 2022-2032
Figure 75: East Asia Fixing Agent Market Value (US$ Mn) by Country, 2022-2032
Figure 76: East Asia Fixing Agent Market Value (US$ Mn) Analysis by Country, 2017-2032
Figure 77: East Asia Fixing Agent Market Volume (Tons) Analysis by Country, 2017-2032
Figure 78: East Asia Fixing Agent Market Value Share (%) and BPS Analysis by Country, 2022-2032
Figure 79: East Asia Fixing Agent Market Y-o-Y Growth (%) Projections by Country, 2022-2032
Figure 80: East Asia Fixing Agent Market Value (US$ Mn) Analysis by Product Form, 2017-2032
Figure 81: East Asia Fixing Agent Market Volume (Tons) Analysis by Product Form, 2017-2032
Figure 82: East Asia Fixing Agent Market Value Share (%) and BPS Analysis by Product Form, 2022-2032
Figure 83: East Asia Fixing Agent Market Y-o-Y Growth (%) Projections by Product Form, 2022-2032
Figure 84: East Asia Fixing Agent Market Value (US$ Mn) Analysis by Product Type, 2017-2032
Figure 85: East Asia Fixing Agent Market Volume (Tons) Analysis by Product Type, 2017-2032
Figure 86: East Asia Fixing Agent Market Value Share (%) and BPS Analysis by Product Type, 2022-2032
Figure 87: East Asia Fixing Agent Market Y-o-Y Growth (%) Projections by Product Type, 2022-2032
Figure 88: East Asia Fixing Agent Market Attractiveness by Product Form, 2022-2032
Figure 89: East Asia Fixing Agent Market Attractiveness by Product Type, 2022-2032
Figure 90: East Asia Fixing Agent Market Attractiveness by Country, 2022-2032
Figure 91: South Asia & Pacific Fixing Agent Market Value (US$ Mn) by Product Form, 2022-2032
Figure 92: South Asia & Pacific Fixing Agent Market Value (US$ Mn) by Product Type, 2022-2032
Figure 93: South Asia & Pacific Fixing Agent Market Value (US$ Mn) by Country, 2022-2032
Figure 94: South Asia & Pacific Fixing Agent Market Value (US$ Mn) Analysis by Country, 2017-2032
Figure 95: South Asia & Pacific Fixing Agent Market Volume (Tons) Analysis by Country, 2017-2032
Figure 96: South Asia & Pacific Fixing Agent Market Value Share (%) and BPS Analysis by Country, 2022-2032
Figure 97: South Asia & Pacific Fixing Agent Market Y-o-Y Growth (%) Projections by Country, 2022-2032
Figure 98: South Asia & Pacific Fixing Agent Market Value (US$ Mn) Analysis by Product Form, 2017-2032
Figure 99: South Asia & Pacific Fixing Agent Market Volume (Tons) Analysis by Product Form, 2017-2032
Figure 100: South Asia & Pacific Fixing Agent Market Value Share (%) and BPS Analysis by Product Form, 2022-2032
Figure 101: South Asia & Pacific Fixing Agent Market Y-o-Y Growth (%) Projections by Product Form, 2022-2032
Figure 102: South Asia & Pacific Fixing Agent Market Value (US$ Mn) Analysis by Product Type, 2017-2032
Figure 103: South Asia & Pacific Fixing Agent Market Volume (Tons) Analysis by Product Type, 2017-2032
Figure 104: South Asia & Pacific Fixing Agent Market Value Share (%) and BPS Analysis by Product Type, 2022-2032
Figure 105: South Asia & Pacific Fixing Agent Market Y-o-Y Growth (%) Projections by Product Type, 2022-2032
Figure 106: South Asia & Pacific Fixing Agent Market Attractiveness by Product Form, 2022-2032
Figure 107: South Asia & Pacific Fixing Agent Market Attractiveness by Product Type, 2022-2032
Figure 108: South Asia & Pacific Fixing Agent Market Attractiveness by Country, 2022-2032
Figure 109: MEA Fixing Agent Market Value (US$ Mn) by Product Form, 2022-2032
Figure 110: MEA Fixing Agent Market Value (US$ Mn) by Product Type, 2022-2032
Figure 111: MEA Fixing Agent Market Value (US$ Mn) by Country, 2022-2032
Figure 112: MEA Fixing Agent Market Value (US$ Mn) Analysis by Country, 2017-2032
Figure 113: MEA Fixing Agent Market Volume (Tons) Analysis by Country, 2017-2032
Figure 114: MEA Fixing Agent Market Value Share (%) and BPS Analysis by Country, 2022-2032
Figure 115: MEA Fixing Agent Market Y-o-Y Growth (%) Projections by Country, 2022-2032
Figure 116: MEA Fixing Agent Market Value (US$ Mn) Analysis by Product Form, 2017-2032
Figure 117: MEA Fixing Agent Market Volume (Tons) Analysis by Product Form, 2017-2032
Figure 118: MEA Fixing Agent Market Value Share (%) and BPS Analysis by Product Form, 2022-2032
Figure 119: MEA Fixing Agent Market Y-o-Y Growth (%) Projections by Product Form, 2022-2032
Figure 120: MEA Fixing Agent Market Value (US$ Mn) Analysis by Product Type, 2017-2032
Figure 121: MEA Fixing Agent Market Volume (Tons) Analysis by Product Type, 2017-2032
Figure 122: MEA Fixing Agent Market Value Share (%) and BPS Analysis by Product Type, 2022-2032
Figure 123: MEA Fixing Agent Market Y-o-Y Growth (%) Projections by Product Type, 2022-2032
Figure 124: MEA Fixing Agent Market Attractiveness by Product Form, 2022-2032
Figure 125: MEA Fixing Agent Market Attractiveness by Product Type, 2022-2032
Figure 126: MEA Fixing Agent Market Attractiveness by Country, 2022-2032
The global fixing agent market is set to advance at a CAGR of 5.3% from 2022 to 2032.
Asia Pacific is likely to hold major fixing agent market share during the forecast period.
The fixing agent market is expected to reach USD 5.24 billion by 2032.
Explore Similar Insights
Thank you!
You will receive an email from our Business Development Manager. Please be sure to check your SPAM/JUNK folder too.