Nanoscale Zero-Valent Iron Market Forecast and Outlook (2025-2035)

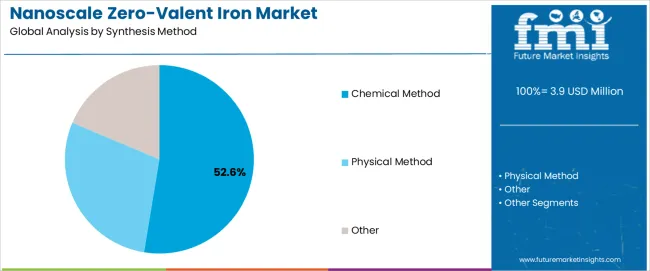
The nanoscale zero-valent iron market is projected to expand from USD 3.9 million in 2025 to USD 5.5 million by 2035, registering a CAGR of 3.4% and an absolute gain of USD 1.6 million, reflecting a total growth of 41%. This 1.4X expansion is underpinned by global momentum in groundwater and soil remediation, where nanoscale zero-valent iron (nZVI) demonstrates superior reactivity for in-situ treatment of chlorinated solvents, heavy metals, and persistent organic contaminants. Early-period growth from 2025 to 2030 will be propelled by government-mandated site cleanups, industrial redevelopment programs, and the adoption of chemical synthesis methods, which account for 52.6% share, given their scalability and controllable particle size production.

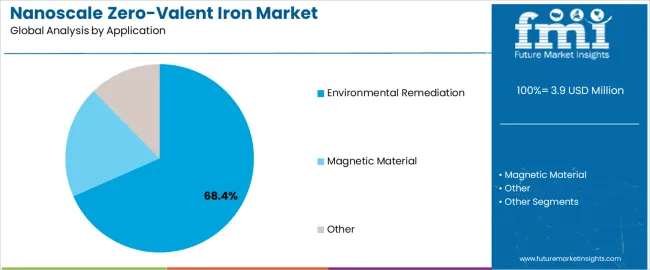
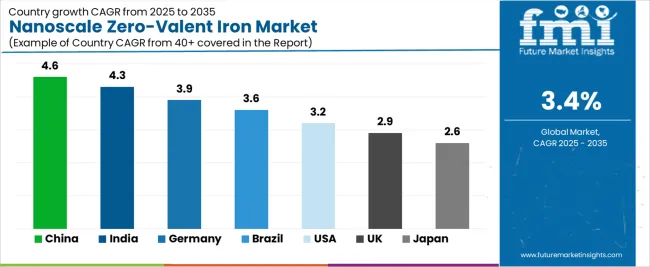
The market’s evolution will emphasize stabilized nanoparticle formulations, surface modification, and advanced delivery mechanisms that improve subsurface transport and contact efficiency. Environmental remediation applications, commanding 68.4% share, will remain the core driver, supported by Superfund and brownfield restoration initiatives in the United States and expanding soil rehabilitation mandates across Europe and Asia. China (4.6% CAGR) and India (4.3%) lead global growth, supported by industrial cleanup regulations and domestic nanomaterial production capacity. Germany (3.9%) and Brazil (3.6%) continue as high-value markets where remediation technology integration is reinforced by strong environmental enforcement, while the United States (3.2%) sustains mature, large-scale deployment driven by regulatory frameworks and proven field performance. Key participants such as NANOIRON, Reade Advanced Materials, and GeoNano Environ. Tech are focusing on particle stabilization chemistry, hybrid synthesis innovation, and eco-safe nanomaterial deployment.
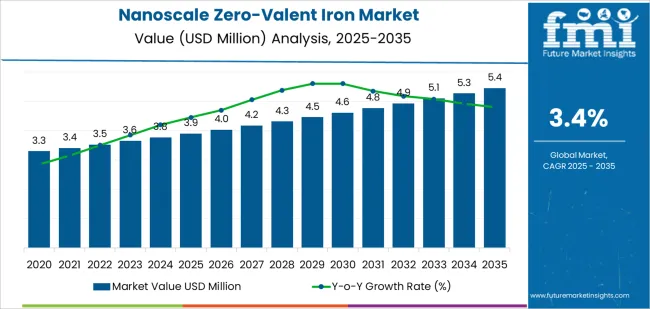
Quick Stats for Nanoscale Zero-Valent Iron Market

  • Nanoscale Zero-Valent Iron Market Value (2025): USD 3.9 million
  • Nanoscale Zero-Valent Iron Market Forecast Value (2035): USD 5.5 million
  • Nanoscale Zero-Valent Iron Market CAGR: 3.4%
  • Leading Segment by Synthesis Method (2025): Chemical Method (52.6%)
  • Leading Segment by Application (2025): Environmental Remediation (68.4%)
  • Key Growth Regions: China, India, Germany, Brazil, United States
  • Top Companies by Market Share: NANOIRON, Reade Advanced Materials, GeoNano Environ. Tech

Nanoscale Zero Valent Iron Market Market Value Analysis

Growing emphasis on environmental sustainability is driving demand for nanomaterials that offer superior reactivity and penetration capabilities compared to conventional remediation technologies, enabling treatment of previously inaccessible contamination zones and reducing long-term monitoring costs. The development of stabilized nanoparticle formulations and improved delivery mechanisms is addressing earlier limitations related to particle aggregation and mobility, facilitating adoption in diverse geological conditions and contamination scenarios.

Regulatory mandates for site cleanup, particularly in developed economies with legacy industrial contamination, are creating sustained demand for innovative remediation technologies that demonstrate cost-effectiveness and environmental safety. The market is characterized by ongoing research and development activities focused on synthesis method optimization, surface modification techniques, and application-specific formulations that enhance performance while addressing concerns related to nanoparticle transport, longevity, and potential ecological impacts in treatment zones.

Nanoscale Zero-Valent Iron Market Key Takeaways

Metric Value
Market Value (2025) USD 3.9 million
Market Forecast Value (2035) USD 5.5 million
Forecast CAGR (2025-2035) 3.4%

Why is the Nanoscale Zero-Valent Iron Market Growing?

ENVIRONMENTAL REMEDIATION DEMANDS TECHNOLOGY ADVANCEMENT FACTORS REGULATORY & SUSTAINABILITY DRIVERS
  • Legacy Contamination Treatment:Increasing need to address historical industrial pollution at manufacturing sites, military installations, and former industrial facilities requiring effective in-situ remediation technologies.
  • Groundwater Protection Emphasis:Growing focus on protecting groundwater resources from contamination by chlorinated solvents, heavy metals, and emerging contaminants driving adoption of reactive nanomaterials.
  • Cost-Effective Remediation Solutions:Demand for technologies that reduce long-term monitoring and treatment costs compared to conventional pump-and-treat systems or excavation approaches.
  • Nanoparticle Stabilization Innovation:Development of surface modification techniques and stabilizing agents preventing particle aggregation and enhancing subsurface mobility for effective contaminant contact.
  • Synthesis Method Optimization:Advances in chemical and physical synthesis approaches enabling production of nanoparticles with controlled size distribution, surface properties, and reactivity characteristics.
  • Delivery Mechanism Enhancement:Innovation in injection techniques, carrier fluids, and application methods improving nanoparticle distribution in contaminated zones and treatment efficiency.
  • Site Cleanup Mandates;Regulatory requirements for contaminated site remediation and brownfield redevelopment creating sustained demand for effective treatment technologies.
  • Environmental Safety Standards:Regulations limiting use of hazardous treatment chemicals and favoring technologies with minimal secondary environmental impacts.
  • Sustainability Compliance:Corporate environmental responsibility initiatives and sustainability reporting requirements driving adoption of green remediation technologies with lower carbon footprints than traditional approaches.

What Is the Market Segmentation for Nanoscale Zero-Valent Iron Market?

Category Segments Covered
By Synthesis Method Chemical Method, Physical Method, Other
By Application Environmental Remediation, Magnetic Material, Other
By Region China, India, Germany, Brazil, United States, United Kingdom, Japan

Nanoscale Zero-Valent Iron Market Analysis by Synthesis Method

Nanoscale Zero Valent Iron Market Analysis By Synthesis Method

Segment 2025 to 2035 Outlook
Chemical Method
  • Leader in 2025 with 52.6% market share, expected to maintain dominance through 2035. Chemical reduction approaches including liquid-phase synthesis and solution-based precipitation offer advantages in scalability, production cost-effectiveness, and ability to control particle size distribution. Established manufacturing processes with well-understood chemistry enabling consistent product quality and customization for specific application requirements. Surface modification and stabilization readily achieved during synthesis process through addition of coating agents and polyeric stabilizers.
  • Momentum: steady growth driven by ongoing environmental remediation projects and production scale-up capabilities.
  • Watchouts: environmental concerns regarding chemical reagents used in synthesis and waste stream management requirements.
Physical Method
  • Alternative synthesis approach gaining traction in specialized applications requiring ultra-pure nanoparticles or specific morphological characteristics. Physical techniques including ball milling, vapor deposition, and electrochemical synthesis offering advantages in avoiding chemical contaminants and producing highly reactive particles. Higher production costs and energy requirements currently limiting widespread adoption to premium applications and research-scale production. Technical capabilities enabling production of nanoparticles with unique surface properties and crystalline structures.
  • Momentum: moderate growth in niche applications where purity and specific properties justify cost premiums.
  • Watchouts: scalability challenges and economic viability for large-volume environmental applications.
Other
  • Encompasses emerging synthesis approaches including green synthesis using plant extracts, biological methods, and hybrid techniques combining multiple synthesis strategies. Focus on developing environmentally benign production methods reducing chemical usage and energy consumption. Early-stage technologies with limited commercial production but potential for future growth as sustainability concerns influence manufacturing method selection. Research emphasis on biomimetic approaches and renewable feedstock utilization.
  • Momentum: selective growth dependent on successful demonstration of cost-competitiveness and performance equivalence.
  • Watchouts: production consistency challenges and limited manufacturing infrastructure for commercial-scale deployment.

Nanoscale Zero-Valent Iron Market Analysis by Application

Nanoscale Zero Valent Iron Market Analysis By Application

Segment 2025 to 2035 Outlook
Environmental Remediation
  • Dominant segment with 68.4% market share in 2025, encompassing groundwater treatment, soil remediation, and contaminated site cleanup applications. Primary application area leveraging nanoscale zero-valent iron's ability to degrade chlorinated organic compounds, reduce heavy metals, and treat persistent pollutants through chemical reduction mechanisms. Growing adoption for in-situ remediation where nanoparticles are injected directly into contamination zones, eliminating excavation and ex-situ treatment costs. Regulatory drivers including Superfund site cleanup and industrial facility decommissioning sustaining demand.
  • Momentum: steady growth aligned with environmental compliance requirements and brownfield redevelopment initiatives.
  • Watchouts: regulatory scrutiny regarding nanoparticle environmental fate and potential unintended ecological impacts requiring comprehensive risk assessments.
Magnetic Material
  • Specialized segment utilizing magnetic properties of nanoscale iron particles for applications including magnetic recording media, ferrofluids, and electromagnetic shielding materials. Niche market with specific requirements for particle size uniformity, magnetic saturation characteristics, and surface functionalization. Competition from alternative magnetic nanomaterials including iron oxide nanoparticles and other ferromagnetic compositions offering comparable or superior properties for certain applications. Technical requirements driving demand for high-purity synthesis methods and precise morphological control.
  • Momentum: stable growth in specialized industrial and electronic applications.
  • Watchouts: substitution pressure from alternative materials and price sensitivity in commercial applications.
Other
  • Emerging applications including catalysis, water treatment beyond environmental remediation, and advanced materials development. Exploratory uses in pharmaceutical applications, analytical chemistry, and research activities investigating novel properties and functionalities. Small market volumes with diverse requirements and application-specific formulations. Research emphasis on expanding application portfolio and identifying high-value uses beyond established markets.
  • Momentum: selective growth dependent on successful commercialization of emerging applications.
Watchouts: fragmented demand and technical challenges in adapting nanoparticles for diverse application requirements.

What Are the Key Trends, Drivers, and Restraints Affecting the Demand for Nanoscale Zero-Valent Iron Market?

DRIVERS RESTRAINTS KEY TRENDS
  • Contaminated Site Cleanup Mandates:Regulatory requirements for addressing legacy contamination at industrial sites, brownfield redevelopment programs, and liability-driven remediation creating sustained demand for effective technologies.
  • In-Situ Treatment Advantages:Growing preference for technologies enabling subsurface treatment without excavation, reducing costs, minimizing site disruption, and avoiding waste disposal requirements.
  • Groundwater Protection Priorities:Increasing emphasis on protecting drinking water sources and aquifer resources from contamination driving adoption of reactive materials for treatment barriers and plume interception.
  • Nanoparticle Transport Limitations:Challenges achieving uniform nanoparticle distribution in heterogeneous subsurface conditions, with particle aggregation and limited mobility in low-permeability zones affecting treatment effectiveness.
  • Regulatory Uncertainty:Evolving regulatory frameworks for nanomaterial deployment creating approval delays and requiring extensive environmental fate studies and risk assessments.
  • Cost Competitiveness Pressure:Need to demonstrate economic advantages over established remediation technologies including chemical oxidation, bioremediation, and conventional ex-situ treatment approaches.
  • Stabilized Formulation Development:Innovation in nanoparticle surface modification and stabilization techniques using polymeric coatings and surfactants improving subsurface mobility and treatment zone longevity.
  • Targeted Delivery Systems:Development of advanced injection techniques and carrier fluids enabling improved nanoparticle distribution in contaminated zones and enhanced contaminant contact.
  • Multi-Contaminant Treatment:Research demonstrating nanoscale zero-valent iron effectiveness against emerging contaminants including per- and polyfluoroalkyl substances and pharmaceutical compounds.
  • Environmental Fate Characterization:Comprehensive studies addressing nanoparticle transformation, persistence, and ecological interactions providing data supporting regulatory approvals and stakeholder acceptance.

How Does the Demand for Nanoscale Zero-Valent Iron Market Vary Across Countries?

Nanoscale Zero Valent Iron Market Cagr Analysis By Country

Region Market Value 2025 (USD Million) Market Value 2035 (USD Million) CAGR (2025-2035)
China 1.4 3.5 4.6%
India 0.1 0.2 4.3%
Germany 3.3 4.5 3.9%
Brazil 3.4 4.6 3.6%
United States 3.7 4.9 3.2%
United Kingdom 3.8 5.1 2.9%
Japan 4 5.3 2.6%

How Does the Demand for Nanoscale Zero-Valent Iron Market Perform in China?

Nanoscale Zero Valent Iron Market Country Value Analysis

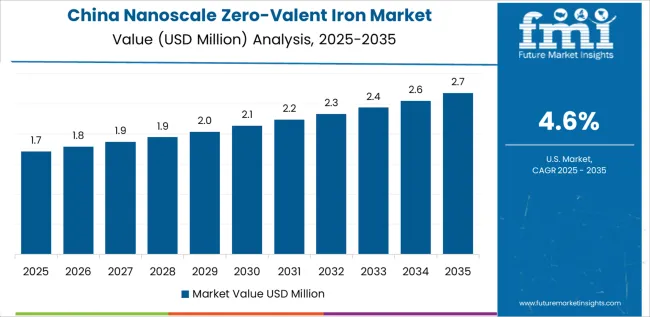
Revenue from nanoscale zero-valent iron in China is projected to reach USD 3.5 million by 2035, driven by extensive environmental remediation programs and government initiatives addressing industrial pollution creating substantial opportunities for advanced nanomaterial applications across contaminated site cleanup and groundwater protection projects. The country's large industrial base and historical contamination legacy from manufacturing operations are creating sustained demand for cost-effective remediation technologies. National environmental protection policies and soil pollution prevention action plans are mandating cleanup of contaminated industrial sites before redevelopment, with nanoscale zero-valent iron emerging as a preferred technology for treating chlorinated solvents and heavy metal contamination.

Provincial and municipal authorities are investing in pilot projects demonstrating nanoparticle remediation effectiveness, with successful implementations driving broader adoption across industrial zones. Domestic manufacturers are developing production capabilities for nanoscale zero-valent iron materials, benefiting from local supply chains, cost advantages, and proximity to application sites. Research institutions and universities are collaborating with environmental companies to optimize synthesis methods, improve particle stability, and develop application protocols suited to Chinese geological conditions and contamination profiles. The focus on green remediation approaches and minimizing secondary environmental impacts aligns with broader sustainability goals, supporting adoption of nanomaterial-based solutions over more disruptive conventional technologies.

What Are the Trends in the Demand for Nanoscale Zero-Valent Iron Market in India?

Revenue from nanoscale zero-valent iron in India is expanding to reach USD 0.2 million by 2035, supported by growing environmental awareness and regulatory pressure addressing industrial contamination creating emerging demand for innovative remediation technologies. The country's expanding industrial sector and increasing environmental compliance requirements are driving interest in advanced treatment methods for addressing groundwater contamination from industrial operations, particularly in manufacturing clusters and chemical processing zones. State pollution control boards are implementing stricter enforcement of environmental regulations, creating incentives for industries to adopt effective remediation technologies for historical contamination issues.

Research institutions are conducting studies on nanoscale zero-valent iron applications adapted to Indian conditions including high temperatures, varied soil compositions, and specific contaminant profiles typical of local industrial operations. Cost sensitivity remains a significant market characteristic with emphasis on demonstrating economic viability compared to alternative remediation approaches. Technical support and knowledge transfer from international environmental firms is facilitating early adoption, with pilot projects providing performance data and building confidence in nanoparticle-based remediation approaches among Indian environmental consultants and regulatory authorities.

How Is the Demand for Nanoscale Zero-Valent Iron Market Evolving in Germany?

Demand for nanoscale zero-valent iron in Germany is projected to reach USD 4.5 million by 2035, supported by the country's stringent environmental standards and advanced remediation technology sector requiring sophisticated nanomaterial solutions for complex contamination scenarios. German environmental regulations mandate comprehensive site investigations and risk-based remediation approaches, with nanoscale zero-valent iron applications demonstrating compliance with technical requirements and safety standards. The market is characterized by emphasis on thorough characterization, environmental fate studies, and long-term monitoring protocols ensuring responsible nanoparticle deployment.

German environmental engineering firms maintain expertise in advanced remediation technologies, with established capabilities for nanoparticle application including injection system design, distribution modeling, and performance verification. Research institutions and technology providers collaborate on developing next-generation formulations with enhanced stability, controlled reactivity, and improved environmental compatibility. Regulatory framework requires comprehensive risk assessments addressing potential nanoparticle impacts on soil microbiomes, groundwater quality, and human health, creating thorough approval processes that favor well-characterized products with extensive safety documentation. The focus on sustainable remediation and lifecycle assessment drives adoption of technologies demonstrating superior environmental profiles compared to energy-intensive alternatives.

What Is the Outlook for Nanoscale Zero-Valent Iron Market in Brazil?

Revenue from nanoscale zero-valent iron in Brazil is growing to reach USD 4.6 million by 2035, driven by industrial contamination legacy and regulatory requirements for site cleanup creating opportunities for advanced remediation technologies across petroleum facilities, chemical plants, and manufacturing sites. The country's oil and gas sector and historical industrial operations have created significant subsurface contamination requiring treatment, with conventional remediation approaches often proving cost-prohibitive or technically challenging. State environmental agencies are implementing contaminated site management programs, establishing registries of affected properties and requiring responsible parties to develop and implement cleanup plans.

Nanoscale zero-valent iron is gaining recognition as a viable technology for treating chlorinated solvent contamination and petroleum hydrocarbons in challenging geological conditions including clayey soils and heterogeneous subsurface environments. Environmental consulting firms are building technical capabilities for nanoparticle applications, supported by international technology providers offering training, technical support, and product supply. Economic considerations favor remediation approaches demonstrating shorter treatment timeframes and reduced long-term monitoring requirements compared to natural attenuation strategies. Challenges include limited local manufacturing capacity requiring imports and the need for adaptation of application protocols to tropical climate conditions and local subsurface characteristics.

How Does the Demand for Nanoscale Zero-Valent Iron Market Vary in the United States?

Revenue from nanoscale zero-valent iron in United States is projected to reach USD 4.9 million by 2035, supported by mature environmental remediation industry and extensive contaminated site inventory creating sustained demand for innovative treatment technologies. The country's Superfund program, state voluntary cleanup initiatives, and private sector remediation activities provide diverse market opportunities for nanoscale zero-valent iron applications. Decades of industrial activity have created widespread groundwater contamination from chlorinated solvents, heavy metals, and other persistent pollutants, with thousands of sites requiring ongoing treatment or active remediation.

Environmental consulting firms and remediation contractors have accumulated substantial experience with nanoparticle applications, developing best practices for site characterization, injection system design, and performance monitoring. Regulatory acceptance has evolved through successful project demonstrations and comprehensive environmental fate studies addressing initial concerns regarding nanoparticle deployment. The USA Environmental Protection Agency and state agencies have established guidance documents for nanoparticle remediation, providing framework for project approvals and monitoring requirements. Market maturity brings focus on optimizing cost-effectiveness, improving longevity of treatment zones, and addressing challenging contaminants including 1,4-dioxane and emerging per- and polyfluoroalkyl substances where nanoscale zero-valent iron shows promising treatment capabilities.
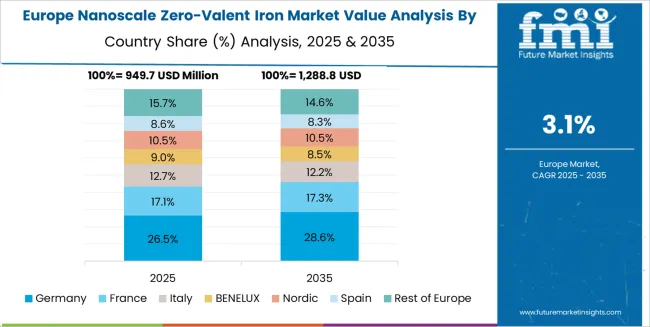
Europe Market Split by Country

Nanoscale Zero Valent Iron Market Europe Country Market Share Analysis, 2025 & 2035

The nanoscale zero-valent iron market in Europe is projected to grow from USD 3.6 million in 2025 to USD 4.8 million by 2035, registering a CAGR of 2.9% over the forecast period. Germany is expected to maintain its leadership position with a 34.7% market share in 2025, projected to reach 35.2% by 2035, supported by its stringent environmental regulations and comprehensive contaminated site management programs addressing industrial legacy pollution.

The United Kingdom follows with a 28.3% share in 2025, anticipated to stabilize at 28.1% by 2035, driven by ongoing remediation projects at former industrial sites and military installations. France holds a 19.4% share, while Netherlands accounts for 12.8% in 2025, reflecting active contaminated land management programs and technical expertise in advanced remediation technologies. The Rest of Europe region is projected to maintain approximately 4.8% collectively through 2035, with Nordic countries, Belgium, and Eastern European nations implementing nanoparticle-based remediation as environmental regulations strengthen and contaminated site inventories expand.
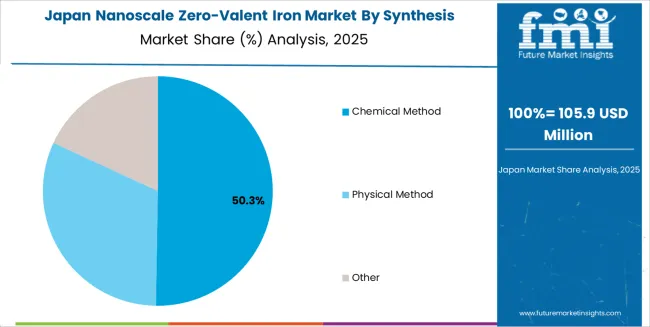
What Are the Trends in the Demand for Nanoscale Zero-Valent Iron Market in Japan?

Nanoscale Zero Valent Iron Market Japan Market Share Analysis By Synthesis Method

Japanese nanoscale zero-valent iron operations reflect the country's emphasis on environmental safety and rigorous technology validation. Environmental authorities and remediation practitioners maintain comprehensive evaluation protocols for nanomaterial applications, requiring extensive laboratory testing, pilot-scale demonstrations, and long-term monitoring data before approving full-scale deployments. This creates extended project timelines but ensures thorough risk assessment and stakeholder confidence. The Japanese market demonstrates unique requirements for nanoparticle formulations adapted to local geological conditions including volcanic soils, high groundwater tables, and seismic considerations affecting subsurface injection strategies.

Regulatory oversight through the Ministry of the Environment emphasizes precautionary approaches with requirements for comprehensive fate and transport studies, ecotoxicological assessments, and contingency plans for managing unintended nanoparticle migration. Environmental consulting firms and research institutions maintain collaborative relationships, conducting joint studies on nanoparticle behavior in Japanese subsurface conditions and developing application protocols suitable for local site characteristics. The focus on minimizing environmental disruption drives interest in nanoscale zero-valent iron for in-situ treatment, particularly at sites where excavation would be disruptive or economically prohibitive. Technical emphasis includes development of monitoring techniques for tracking nanoparticle distribution, verifying treatment effectiveness, and documenting long-term stability of remediated zones.
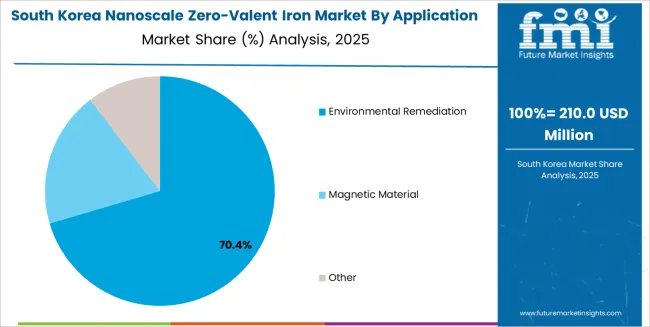
Market Dynamics Drive Innovation in South Korea

Nanoscale Zero Valent Iron Market South Korea Market Share Analysis By Application

South Korean nanoscale zero-valent iron operations reflect the country's growing environmental awareness and industrial contamination legacy from rapid industrialization. The Ministry of Environment has established contaminated soil management framework requiring systematic site investigation and risk-based remediation approaches. Nanoscale zero-valent iron applications are gaining recognition as viable technologies for treating chlorinated solvents and heavy metals at industrial sites, particularly in cases where conventional methods prove technically or economically challenging.

Korean environmental engineering firms are building technical capabilities through collaboration with international technology providers, implementing pilot projects that demonstrate nanoparticle effectiveness in local conditions. Research institutions including Korea Institute of Science and Technology and environmental research centers conduct fundamental studies on nanoparticle synthesis, characterization, and environmental interactions. Regulatory framework emphasizes environmental safety with requirements for comprehensive risk assessments addressing potential impacts on soil ecosystems, groundwater quality, and public health.

This creates thorough approval processes favoring well-documented technologies with international track records. Market development faces challenges including limited local manufacturing capacity, reliance on imported materials, and need for building practitioner expertise in nanoparticle application techniques. However, government support for green technologies and increasing corporate environmental responsibility commitments are supporting market expansion as nanoscale zero-valent iron demonstrates cost-effectiveness and technical performance in Korean remediation projects.
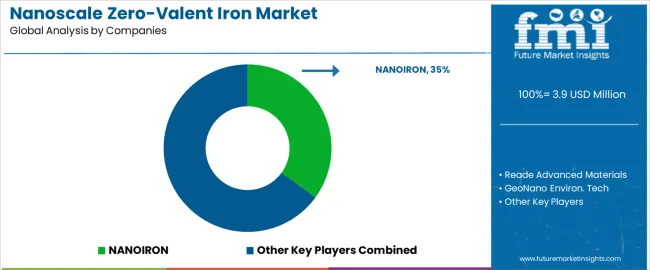
What Is the Competitive Landscape of the Nanoscale Zero-Valent Iron Market?

Nanoscale Zero Valent Iron Market Analysis By Company

The nanoscale zero-valent iron market demonstrates concentration among specialized nanomaterial producers and environmental technology companies. Profit focus centers on application-specific formulations, technical support services, and integrated remediation solutions rather than commodity nanoparticle sales. Value migration favors companies demonstrating successful project track records, regulatory approval experience, and comprehensive technical capabilities spanning synthesis, characterization, and field application support. Several competitive archetypes define market dynamics: specialized nanomaterial manufacturers focusing on production optimization and product quality control; environmental remediation companies integrating nanoparticle production with application services; research-based organizations commercializing proprietary synthesis methods and formulations; and distributors connecting manufacturers with environmental consultants and remediation contractors.

Market barriers include technical expertise requirements for synthesis and quality control, regulatory knowledge for navigating environmental approvals, and field application experience necessary for successful project implementation. Competition centers on demonstrating superior nanoparticle characteristics including reactivity, stability, and mobility properties that translate to better field performance and cost-effectiveness. Differentiation strategies emphasize proprietary stabilization techniques, customized formulations for specific contaminant types, and comprehensive technical support including site characterization assistance, injection system design, and performance monitoring protocols. Market dynamics favor established players with proven project portfolios and regulatory acceptance, creating challenges for new entrants lacking field demonstration data and stakeholder relationships.

Innovation opportunities exist in developing next-generation formulations addressing current limitations including particle aggregation, limited treatment zone persistence, and challenges treating complex contaminant mixtures. Strategic partnerships between nanomaterial producers and environmental engineering firms are common, combining production capabilities with application expertise and market access. The modest market size limits pure-play participants, with most companies maintaining diversified portfolios across environmental technologies or nanomaterials serving multiple applications.

Who Are the Key Players in the Nanoscale Zero-Valent Iron Market?

  • NANOIRON
  • Reade Advanced Materials
  • GeoNano Environ. Tech
  • Zhejiang Yamei Nano Technology
  • Redox
  • Hongwu International Group

Scope of the Report

Items Values
Quantitative Units USD 3.9 million
Synthesis Method Chemical Method, Physical Method, Other
Application Environmental Remediation, Magnetic Material, Other
Regions Covered China, India, Germany, Brazil, United States, United Kingdom, Japan
Countries Covered China, India, Germany, Brazil, United States, United Kingdom, Japan
Key Companies Profiled NANOIRON, Reade Advanced Materials, GeoNano Environ. Tech, Zhejiang Yamei Nano Technology, Redox, Hongwu International Group
Additional Attributes Dollar sales by synthesis method and application, regional demand across key markets, competitive landscape, remediation technology adoption patterns, nanoparticle characterization requirements, and environmental fate research driving contaminated site cleanup, groundwater protection, and sustainable remediation practices

Nanoscale Zero-Valent Iron Market Segmentation

By Synthesis Method:

  • Chemical Method
  • Physical Method
  • Other

By Application:

  • Environmental Remediation
  • Magnetic Material
  • Other

By Region:

  • China
  • India
  • Germany
  • Brazil
  • United States
  • United Kingdom
  • Japan

Frequently Asked Questions

How big is the nanoscale zero-valent iron market in 2025?

The global nanoscale zero-valent iron market is estimated to be valued at USD 3.9 million in 2025.

What will be the size of nanoscale zero-valent iron market in 2035?

The market size for the nanoscale zero-valent iron market is projected to reach USD 5.4 million by 2035.

How much will be the nanoscale zero-valent iron market growth between 2025 and 2035?

The nanoscale zero-valent iron market is expected to grow at a 3.4% CAGR between 2025 and 2035.

What are the key product types in the nanoscale zero-valent iron market?

The key product types in nanoscale zero-valent iron market are chemical method, physical method and other.

Which application segment to contribute significant share in the nanoscale zero-valent iron market in 2025?

In terms of application, environmental remediation segment to command 68.4% share in the nanoscale zero-valent iron market in 2025.

Table of Content

  1. Executive Summary
    • Global Market Outlook
    • Demand to side Trends
    • Supply to side Trends
    • Technology Roadmap Analysis
    • Analysis and Recommendations
  2. Market Overview
    • Market Coverage / Taxonomy
    • Market Definition / Scope / Limitations
  3. Market Background
    • Market Dynamics
      • Drivers
      • Restraints
      • Opportunity
      • Trends
    • Scenario Forecast
      • Demand in Optimistic Scenario
      • Demand in Likely Scenario
      • Demand in Conservative Scenario
    • Opportunity Map Analysis
    • Product Life Cycle Analysis
    • Supply Chain Analysis
    • Investment Feasibility Matrix
    • Value Chain Analysis
    • PESTLE and Porter’s Analysis
    • Regulatory Landscape
    • Regional Parent Market Outlook
    • Production and Consumption Statistics
    • Import and Export Statistics
  4. Global Market Analysis 2020 to 2024 and Forecast, 2025 to 2035
    • Historical Market Size Value (USD Million) Analysis, 2020 to 2024
    • Current and Future Market Size Value (USD Million) Projections, 2025 to 2035
      • Y to o to Y Growth Trend Analysis
      • Absolute $ Opportunity Analysis
  5. Global Market Pricing Analysis 2020 to 2024 and Forecast 2025 to 2035
  6. Global Market Analysis 2020 to 2024 and Forecast 2025 to 2035, By Synthesis Method
    • Introduction / Key Findings
    • Historical Market Size Value (USD Million) Analysis By Synthesis Method , 2020 to 2024
    • Current and Future Market Size Value (USD Million) Analysis and Forecast By Synthesis Method , 2025 to 2035
      • Chemical Method
      • Physical Method
      • Other
    • Y to o to Y Growth Trend Analysis By Synthesis Method , 2020 to 2024
    • Absolute $ Opportunity Analysis By Synthesis Method , 2025 to 2035
  7. Global Market Analysis 2020 to 2024 and Forecast 2025 to 2035, By Application
    • Introduction / Key Findings
    • Historical Market Size Value (USD Million) Analysis By Application, 2020 to 2024
    • Current and Future Market Size Value (USD Million) Analysis and Forecast By Application, 2025 to 2035
      • Environmental Remediation
      • Magnetic Material
      • Other
    • Y to o to Y Growth Trend Analysis By Application, 2020 to 2024
    • Absolute $ Opportunity Analysis By Application, 2025 to 2035
  8. Global Market Analysis 2020 to 2024 and Forecast 2025 to 2035, By Region
    • Introduction
    • Historical Market Size Value (USD Million) Analysis By Region, 2020 to 2024
    • Current Market Size Value (USD Million) Analysis and Forecast By Region, 2025 to 2035
      • North America
      • Latin America
      • Western Europe
      • Eastern Europe
      • East Asia
      • South Asia and Pacific
      • Middle East & Africa
    • Market Attractiveness Analysis By Region
  9. North America Market Analysis 2020 to 2024 and Forecast 2025 to 2035, By Country
    • Historical Market Size Value (USD Million) Trend Analysis By Market Taxonomy, 2020 to 2024
    • Market Size Value (USD Million) Forecast By Market Taxonomy, 2025 to 2035
      • By Country
        • USA
        • Canada
        • Mexico
      • By Synthesis Method
      • By Application
    • Market Attractiveness Analysis
      • By Country
      • By Synthesis Method
      • By Application
    • Key Takeaways
  10. Latin America Market Analysis 2020 to 2024 and Forecast 2025 to 2035, By Country
    • Historical Market Size Value (USD Million) Trend Analysis By Market Taxonomy, 2020 to 2024
    • Market Size Value (USD Million) Forecast By Market Taxonomy, 2025 to 2035
      • By Country
        • Brazil
        • Chile
        • Rest of Latin America
      • By Synthesis Method
      • By Application
    • Market Attractiveness Analysis
      • By Country
      • By Synthesis Method
      • By Application
    • Key Takeaways
  11. Western Europe Market Analysis 2020 to 2024 and Forecast 2025 to 2035, By Country
    • Historical Market Size Value (USD Million) Trend Analysis By Market Taxonomy, 2020 to 2024
    • Market Size Value (USD Million) Forecast By Market Taxonomy, 2025 to 2035
      • By Country
        • Germany
        • UK
        • Italy
        • Spain
        • France
        • Nordic
        • BENELUX
        • Rest of Western Europe
      • By Synthesis Method
      • By Application
    • Market Attractiveness Analysis
      • By Country
      • By Synthesis Method
      • By Application
    • Key Takeaways
  12. Eastern Europe Market Analysis 2020 to 2024 and Forecast 2025 to 2035, By Country
    • Historical Market Size Value (USD Million) Trend Analysis By Market Taxonomy, 2020 to 2024
    • Market Size Value (USD Million) Forecast By Market Taxonomy, 2025 to 2035
      • By Country
        • Russia
        • Poland
        • Hungary
        • Balkan & Baltic
        • Rest of Eastern Europe
      • By Synthesis Method
      • By Application
    • Market Attractiveness Analysis
      • By Country
      • By Synthesis Method
      • By Application
    • Key Takeaways
  13. East Asia Market Analysis 2020 to 2024 and Forecast 2025 to 2035, By Country
    • Historical Market Size Value (USD Million) Trend Analysis By Market Taxonomy, 2020 to 2024
    • Market Size Value (USD Million) Forecast By Market Taxonomy, 2025 to 2035
      • By Country
        • China
        • Japan
        • South Korea
      • By Synthesis Method
      • By Application
    • Market Attractiveness Analysis
      • By Country
      • By Synthesis Method
      • By Application
    • Key Takeaways
  14. South Asia and Pacific Market Analysis 2020 to 2024 and Forecast 2025 to 2035, By Country
    • Historical Market Size Value (USD Million) Trend Analysis By Market Taxonomy, 2020 to 2024
    • Market Size Value (USD Million) Forecast By Market Taxonomy, 2025 to 2035
      • By Country
        • India
        • ASEAN
        • Australia & New Zealand
        • Rest of South Asia and Pacific
      • By Synthesis Method
      • By Application
    • Market Attractiveness Analysis
      • By Country
      • By Synthesis Method
      • By Application
    • Key Takeaways
  15. Middle East & Africa Market Analysis 2020 to 2024 and Forecast 2025 to 2035, By Country
    • Historical Market Size Value (USD Million) Trend Analysis By Market Taxonomy, 2020 to 2024
    • Market Size Value (USD Million) Forecast By Market Taxonomy, 2025 to 2035
      • By Country
        • Kingdom of Saudi Arabia
        • Other GCC Countries
        • Turkiye
        • South Africa
        • Other African Union
        • Rest of Middle East & Africa
      • By Synthesis Method
      • By Application
    • Market Attractiveness Analysis
      • By Country
      • By Synthesis Method
      • By Application
    • Key Takeaways
  16. Key Countries Market Analysis
    • USA
      • Pricing Analysis
      • Market Share Analysis, 2024
        • By Synthesis Method
        • By Application
    • Canada
      • Pricing Analysis
      • Market Share Analysis, 2024
        • By Synthesis Method
        • By Application
    • Mexico
      • Pricing Analysis
      • Market Share Analysis, 2024
        • By Synthesis Method
        • By Application
    • Brazil
      • Pricing Analysis
      • Market Share Analysis, 2024
        • By Synthesis Method
        • By Application
    • Chile
      • Pricing Analysis
      • Market Share Analysis, 2024
        • By Synthesis Method
        • By Application
    • Germany
      • Pricing Analysis
      • Market Share Analysis, 2024
        • By Synthesis Method
        • By Application
    • UK
      • Pricing Analysis
      • Market Share Analysis, 2024
        • By Synthesis Method
        • By Application
    • Italy
      • Pricing Analysis
      • Market Share Analysis, 2024
        • By Synthesis Method
        • By Application
    • Spain
      • Pricing Analysis
      • Market Share Analysis, 2024
        • By Synthesis Method
        • By Application
    • France
      • Pricing Analysis
      • Market Share Analysis, 2024
        • By Synthesis Method
        • By Application
    • India
      • Pricing Analysis
      • Market Share Analysis, 2024
        • By Synthesis Method
        • By Application
    • ASEAN
      • Pricing Analysis
      • Market Share Analysis, 2024
        • By Synthesis Method
        • By Application
    • Australia & New Zealand
      • Pricing Analysis
      • Market Share Analysis, 2024
        • By Synthesis Method
        • By Application
    • China
      • Pricing Analysis
      • Market Share Analysis, 2024
        • By Synthesis Method
        • By Application
    • Japan
      • Pricing Analysis
      • Market Share Analysis, 2024
        • By Synthesis Method
        • By Application
    • South Korea
      • Pricing Analysis
      • Market Share Analysis, 2024
        • By Synthesis Method
        • By Application
    • Russia
      • Pricing Analysis
      • Market Share Analysis, 2024
        • By Synthesis Method
        • By Application
    • Poland
      • Pricing Analysis
      • Market Share Analysis, 2024
        • By Synthesis Method
        • By Application
    • Hungary
      • Pricing Analysis
      • Market Share Analysis, 2024
        • By Synthesis Method
        • By Application
    • Kingdom of Saudi Arabia
      • Pricing Analysis
      • Market Share Analysis, 2024
        • By Synthesis Method
        • By Application
    • Turkiye
      • Pricing Analysis
      • Market Share Analysis, 2024
        • By Synthesis Method
        • By Application
    • South Africa
      • Pricing Analysis
      • Market Share Analysis, 2024
        • By Synthesis Method
        • By Application
  17. Market Structure Analysis
    • Competition Dashboard
    • Competition Benchmarking
    • Market Share Analysis of Top Players
      • By Regional
      • By Synthesis Method
      • By Application
  18. Competition Analysis
    • Competition Deep Dive
      • NANOIRON
        • Overview
        • Product Portfolio
        • Profitability by Market Segments (Product/Age /Sales Channel/Region)
        • Sales Footprint
        • Strategy Overview
          • Marketing Strategy
          • Product Strategy
          • Channel Strategy
      • Reade Advanced Materials
      • GeoNano Environ. Tech
      • Zhejiang Yamei Nano Technology
      • Redox
      • Hongwu International Group
  19. Assumptions & Acronyms Used
  20. Research Methodology

List of Tables

  • Table 1: Global Market Value (USD Million) Forecast by Region, 2020 to 2035
  • Table 2: Global Market Value (USD Million) Forecast by Synthesis Method , 2020 to 2035
  • Table 3: Global Market Value (USD Million) Forecast by Application, 2020 to 2035
  • Table 4: North America Market Value (USD Million) Forecast by Country, 2020 to 2035
  • Table 5: North America Market Value (USD Million) Forecast by Synthesis Method , 2020 to 2035
  • Table 6: North America Market Value (USD Million) Forecast by Application, 2020 to 2035
  • Table 7: Latin America Market Value (USD Million) Forecast by Country, 2020 to 2035
  • Table 8: Latin America Market Value (USD Million) Forecast by Synthesis Method , 2020 to 2035
  • Table 9: Latin America Market Value (USD Million) Forecast by Application, 2020 to 2035
  • Table 10: Western Europe Market Value (USD Million) Forecast by Country, 2020 to 2035
  • Table 11: Western Europe Market Value (USD Million) Forecast by Synthesis Method , 2020 to 2035
  • Table 12: Western Europe Market Value (USD Million) Forecast by Application, 2020 to 2035
  • Table 13: Eastern Europe Market Value (USD Million) Forecast by Country, 2020 to 2035
  • Table 14: Eastern Europe Market Value (USD Million) Forecast by Synthesis Method , 2020 to 2035
  • Table 15: Eastern Europe Market Value (USD Million) Forecast by Application, 2020 to 2035
  • Table 16: East Asia Market Value (USD Million) Forecast by Country, 2020 to 2035
  • Table 17: East Asia Market Value (USD Million) Forecast by Synthesis Method , 2020 to 2035
  • Table 18: East Asia Market Value (USD Million) Forecast by Application, 2020 to 2035
  • Table 19: South Asia and Pacific Market Value (USD Million) Forecast by Country, 2020 to 2035
  • Table 20: South Asia and Pacific Market Value (USD Million) Forecast by Synthesis Method , 2020 to 2035
  • Table 21: South Asia and Pacific Market Value (USD Million) Forecast by Application, 2020 to 2035
  • Table 22: Middle East & Africa Market Value (USD Million) Forecast by Country, 2020 to 2035
  • Table 23: Middle East & Africa Market Value (USD Million) Forecast by Synthesis Method , 2020 to 2035
  • Table 24: Middle East & Africa Market Value (USD Million) Forecast by Application, 2020 to 2035

List of Figures

  • Figure 1: Global Market Pricing Analysis
  • Figure 2: Global Market Value (USD Million) Forecast 2020-2035
  • Figure 3: Global Market Value Share and BPS Analysis by Synthesis Method , 2025 and 2035
  • Figure 4: Global Market Y-o-Y Growth Comparison by Synthesis Method , 2025-2035
  • Figure 5: Global Market Attractiveness Analysis by Synthesis Method
  • Figure 6: Global Market Value Share and BPS Analysis by Application, 2025 and 2035
  • Figure 7: Global Market Y-o-Y Growth Comparison by Application, 2025-2035
  • Figure 8: Global Market Attractiveness Analysis by Application
  • Figure 9: Global Market Value (USD Million) Share and BPS Analysis by Region, 2025 and 2035
  • Figure 10: Global Market Y-o-Y Growth Comparison by Region, 2025-2035
  • Figure 11: Global Market Attractiveness Analysis by Region
  • Figure 12: North America Market Incremental Dollar Opportunity, 2025-2035
  • Figure 13: Latin America Market Incremental Dollar Opportunity, 2025-2035
  • Figure 14: Western Europe Market Incremental Dollar Opportunity, 2025-2035
  • Figure 15: Eastern Europe Market Incremental Dollar Opportunity, 2025-2035
  • Figure 16: East Asia Market Incremental Dollar Opportunity, 2025-2035
  • Figure 17: South Asia and Pacific Market Incremental Dollar Opportunity, 2025-2035
  • Figure 18: Middle East & Africa Market Incremental Dollar Opportunity, 2025-2035
  • Figure 19: North America Market Value Share and BPS Analysis by Country, 2025 and 2035
  • Figure 20: North America Market Value Share and BPS Analysis by Synthesis Method , 2025 and 2035
  • Figure 21: North America Market Y-o-Y Growth Comparison by Synthesis Method , 2025-2035
  • Figure 22: North America Market Attractiveness Analysis by Synthesis Method
  • Figure 23: North America Market Value Share and BPS Analysis by Application, 2025 and 2035
  • Figure 24: North America Market Y-o-Y Growth Comparison by Application, 2025-2035
  • Figure 25: North America Market Attractiveness Analysis by Application
  • Figure 26: Latin America Market Value Share and BPS Analysis by Country, 2025 and 2035
  • Figure 27: Latin America Market Value Share and BPS Analysis by Synthesis Method , 2025 and 2035
  • Figure 28: Latin America Market Y-o-Y Growth Comparison by Synthesis Method , 2025-2035
  • Figure 29: Latin America Market Attractiveness Analysis by Synthesis Method
  • Figure 30: Latin America Market Value Share and BPS Analysis by Application, 2025 and 2035
  • Figure 31: Latin America Market Y-o-Y Growth Comparison by Application, 2025-2035
  • Figure 32: Latin America Market Attractiveness Analysis by Application
  • Figure 33: Western Europe Market Value Share and BPS Analysis by Country, 2025 and 2035
  • Figure 34: Western Europe Market Value Share and BPS Analysis by Synthesis Method , 2025 and 2035
  • Figure 35: Western Europe Market Y-o-Y Growth Comparison by Synthesis Method , 2025-2035
  • Figure 36: Western Europe Market Attractiveness Analysis by Synthesis Method
  • Figure 37: Western Europe Market Value Share and BPS Analysis by Application, 2025 and 2035
  • Figure 38: Western Europe Market Y-o-Y Growth Comparison by Application, 2025-2035
  • Figure 39: Western Europe Market Attractiveness Analysis by Application
  • Figure 40: Eastern Europe Market Value Share and BPS Analysis by Country, 2025 and 2035
  • Figure 41: Eastern Europe Market Value Share and BPS Analysis by Synthesis Method , 2025 and 2035
  • Figure 42: Eastern Europe Market Y-o-Y Growth Comparison by Synthesis Method , 2025-2035
  • Figure 43: Eastern Europe Market Attractiveness Analysis by Synthesis Method
  • Figure 44: Eastern Europe Market Value Share and BPS Analysis by Application, 2025 and 2035
  • Figure 45: Eastern Europe Market Y-o-Y Growth Comparison by Application, 2025-2035
  • Figure 46: Eastern Europe Market Attractiveness Analysis by Application
  • Figure 47: East Asia Market Value Share and BPS Analysis by Country, 2025 and 2035
  • Figure 48: East Asia Market Value Share and BPS Analysis by Synthesis Method , 2025 and 2035
  • Figure 49: East Asia Market Y-o-Y Growth Comparison by Synthesis Method , 2025-2035
  • Figure 50: East Asia Market Attractiveness Analysis by Synthesis Method
  • Figure 51: East Asia Market Value Share and BPS Analysis by Application, 2025 and 2035
  • Figure 52: East Asia Market Y-o-Y Growth Comparison by Application, 2025-2035
  • Figure 53: East Asia Market Attractiveness Analysis by Application
  • Figure 54: South Asia and Pacific Market Value Share and BPS Analysis by Country, 2025 and 2035
  • Figure 55: South Asia and Pacific Market Value Share and BPS Analysis by Synthesis Method , 2025 and 2035
  • Figure 56: South Asia and Pacific Market Y-o-Y Growth Comparison by Synthesis Method , 2025-2035
  • Figure 57: South Asia and Pacific Market Attractiveness Analysis by Synthesis Method
  • Figure 58: South Asia and Pacific Market Value Share and BPS Analysis by Application, 2025 and 2035
  • Figure 59: South Asia and Pacific Market Y-o-Y Growth Comparison by Application, 2025-2035
  • Figure 60: South Asia and Pacific Market Attractiveness Analysis by Application
  • Figure 61: Middle East & Africa Market Value Share and BPS Analysis by Country, 2025 and 2035
  • Figure 62: Middle East & Africa Market Value Share and BPS Analysis by Synthesis Method , 2025 and 2035
  • Figure 63: Middle East & Africa Market Y-o-Y Growth Comparison by Synthesis Method , 2025-2035
  • Figure 64: Middle East & Africa Market Attractiveness Analysis by Synthesis Method
  • Figure 65: Middle East & Africa Market Value Share and BPS Analysis by Application, 2025 and 2035
  • Figure 66: Middle East & Africa Market Y-o-Y Growth Comparison by Application, 2025-2035
  • Figure 67: Middle East & Africa Market Attractiveness Analysis by Application
  • Figure 68: Global Market - Tier Structure Analysis
  • Figure 69: Global Market - Company Share Analysis
Dashboard
Dashboard
Dashboard
Dashboard
Dashboard
Dashboard

Full Research Suite comprises of:

Market outlook & trends analysis

Market outlook & trends analysis

Interviews & case studies

Interviews & case studies

Strategic recommendations

Strategic recommendations

Vendor profiles & capabilities analysis

Vendor profiles & capabilities analysis

5-year forecasts

5-year forecasts

8 regions and 60+ country-level data splits

8 regions and 60+ country-level data splits

Market segment data splits

Market segment data splits

12 months of continuous data updates

12 months of continuous data updates

DELIVERED AS:

PDF EXCEL ONLINE

Full Research Suite


$5000

$7500

$10000

Buy Report Now
Similar Industry Reports

Similar Industry Reports

Nanoscale Sand Mill Market

Nanoscale Sand Mill Market Size and Share Forecast Outlook 2025 to 2035

Nanoscale Chemicals Market

Nanoscale Chemicals Market Growth - Trends & Forecast 2025 to 2035

Iron and Steel Counterweight Market

Iron and Steel Counterweight Market Size and Share Forecast Outlook 2025 to 2035

Iron and Steel Casting Market

Iron and Steel Casting Market Size and Share Forecast Outlook 2025 to 2035

Iron Phosphate Market

Iron Phosphate Market Size and Share Forecast Outlook 2025 to 2035

Ironing Table Market

Ironing Table Market Size and Share Forecast Outlook 2025 to 2035

Iron Powder Market
Iron Powder Market

Iron Powder Market - Trends & Forecast 2025 to 2035

Iron Oxide Market
Iron Oxide Market

Iron Oxide Market Report - Growth, Demand & Forecast 2025 to 2035

Iron Ore Pellets Market

Iron Ore Pellets Market Growth - Trends & Forecast 2025 to 2035

Environmentally Friendly RPET Webbing Market

Environmentally Friendly RPET Webbing Market Size and Share Forecast Outlook 2025 to 2035

Environment Health and Safety Market

Environment Health and Safety Market Size and Share Forecast Outlook 2025 to 2035

Environmental Radiation Monitor Market

Environmental Radiation Monitor Market Size and Share Forecast Outlook 2025 to 2035

Environmental Test Chambers Market

Environmental Test Chambers Market Size and Share Forecast Outlook 2025 to 2035

Environmental Management Systems Market

Environmental Management Systems Market Size and Share Forecast Outlook 2025 to 2035

Environmental Sensor Market

Environmental Sensor Market Size and Share Forecast Outlook 2025 to 2035

Environmental Test Equipment Market

Environmental Test Equipment Market Growth - Trends & Forecast 2025 to 2035

Environment Testing, Inspection and Certification Market

Environment Testing, Inspection and Certification Market Report – Demand, Growth & Industry Outlook 2025 to 2035

Environmental Remediation Technology Market

Environmental Remediation Technology Market - Size, Share & Forecast 2025 to 2035

Environmental Catalysts Market

Environmental Catalysts Market Trends & Growth 2025 to 2035

Environmental Monitoring Market

Environmental Monitoring Market Report – Trends & Forecast 2024-2034

Future Market Insights

Nanoscale Zero-Valent Iron Market

Chat With MaRIA

Chat With

MaRIA

Hi There, I am MaRIA, Your Market Research Intelligence Assistant. How may I help you?