Reports

- Global Locations -

Headquarters

Future Market Insights, Inc.

Christiana Corporate, 200
Continental Drive, Suite 401,
Newark, Delaware - 19713,
United States

T: +1-845-579-5705

Americas

Future Market Insights, Inc.

616 Corporate Way, Suite 2-9018,
Valley Cottage, NY 10989, United States

T: +1-347-918-3531

MEA

Future Market Insights

1602-6 Jumeirah Bay X2 Tower, Plot No: JLT-PH2-X2A,
Jumeirah Lakes Towers, Dubai,
United Arab Emirates

Europe

Future Market Insights

3rd Floor, 207 Regent Street,
W1B 3HH London
United Kingdom

T: + 44 (0) 20 8123 9659
D: +44 (0) 20 3287 4268

Asia Pacific

Future Market Insights

IndiaLand Global Tech Park, Unit UG-1, Behind Grand HighStreet, Phase 1, Hinjawadi, MH, Pune – 411057, India

HDPE Crate Market Overview

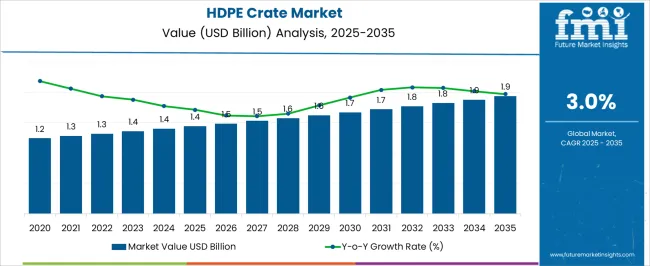
As per the updated reports of Future Market Insights, our lead analyst gives a detailed analysis of the packaging market. As per the analysis, sales of HDPE crates hold a current valuation of US$ 1.4 billion in 2024.

Reflecting on consumers’ expectations, HDPE crate producers work on simpler labels with understandable ingredients, reinforcing continuous demand. Going by this pattern, demand could rise and equate to a market valuation of US$ 1.9 billion, with a sluggish CAGR of 3% by 2034.

Attributes Details
Market Value for 2024 US$ 1.4 billion
Market Value for 2034 US$ 1.9 billion
Market Forecast CAGR for 2024 to 2034 3%

Don't pay for what you don't need

Customize your report by selecting specific countries or regions and save 30%!

Historical Performance and Future Growth of the HDPE Crate Market

In 2018, the global HDPE crate market showed a potential worth US$ 1.2 billion, according to a report from Future Market Insights (FMI). The HDPE crate market witnessed significant growth, registering a CAGR of 2.20% from 2018 to 2023.

Historical CAGR 2.20%
Forecast CAGR 3%

The market reflects augmenting demand for HDPE crates across various industries, propelled by their durability, lightweight nature, and versatility in storage and transportation applications. As companies sought efficient and sustainable packaging solutions, HDPE crates emerged as a preferred choice, contributing to extending the market.

The HDPE crate market is projected to continue its production with a forecasted CAGR of 3% from 2018 to 2023. The scheduled rate suggests sustained demand for HDPE crates globally, fueled by factors such as the magnification of e-commerce, the extension of the retail sector, and the envisioned emphasis on sustainable packaging solutions.

Beacons to Guide the HDPE Crate Market Forward

  • The augmented focus on sustainability and environmental conservation serves as a beacon guiding the HDPE crate market forward.
  • HDPE crates are fundamentally eco-friendly, as they are recyclable and reusable, compressing the environmental footprint of packaging materials.
  • With flourishing consumer awareness and regulatory pressure to adopt sustainable practices, the demand for HDPE crates is augmented to rise, propelling the market growth.
  • Advancements in manufacturing processes, such as injection molding technology, allow for the production of HDPE crates with improved durability, strength, and customization options.
Ismail Sutaria
Ismail Sutaria

Principal Consultant

Talk to Analyst

Find your sweet spots for generating winning opportunities in this market.

Key Factors Hampering the HDPE Crate Market

  • Alternative packaging materials such as cardboard, wood, and metal can be substituted with HDPE crates as they offer numerous benefits, including durability and recyclability.
  • Alternative materials are mainly preferred in certain applications due to cost, weight, or specific packaging requirements, posing a challenge to the market.
  • The high cost of HDPE resin is subject to market volatility influenced by factors such as oil prices, supply-demand dynamics, and geopolitical tensions.
  • Fluctuating prices in raw materials impact production costs and profit margins for HDPE crate manufacturers, affecting market stability.

Comparative View of the Adjacent HDPE Crate Market

This section compares the HDPE crate industry, the crates market, and the wooden crates market. Augmented demand for efficient and durable packaging solutions protects goods during transportation and delivery. Wooden crates exude craftsmanship and authenticity, making the market highly desirable for packaging and display purposes.

HDPE Crate Market:

Attributes HDPE Crate Market
CAGR from 2024 to 2034 3%
Opportunity Sustainable packaging solutions amplify demand for the HDPE crate industry.
Key Trends Integration of IoT into crate design.

Crates Market:

Attributes Crates Market
CAGR from 2023 to 2033 5.9%
Opportunity Rapid growth in e-commerce and subsequent demand for specialized packaging solutions raised the market.
Key Trends Augmenting demand for customization and personalization options.

Wooden Crates Market:

Attributes Wooden Crates Market
CAGR from 2022 to 2032 5.6%
Opportunity Exponential growth in the e-commerce sector.
Key Trends Aesthetic appeal and branding opportunities are offered to raise the market.

Get the data you need at a Fraction of the cost

Personalize your report by choosing insights you need
and save 40%!

Category-wise Insights

The below section shows the leading segment. Based on the product type, the nestable segment is accounted to hold a market share of 49.6% in 2024. Based on end-use, the logistics and transportation segment is accounted to hold a market share of 31.4% in 2024.

Nestable crates are stacked efficiently when empty, as they can be nested together, which helps reduce the required space. Businesses use HDPE crates so that they can streamline logistics operations that help in the reduction of damage to the products, ensuring deliveries on time, thus improving the supply efficiency.

Category Market Share in 2024
Nestable 49.6%
Logistics and Transportation 31.4%

Nestable Segment to Hold a Significant Share in the Market

Based on the product type, the nestable segment stands out, capturing a significant market share of 49.6%. Nestable HDPE crates are favored for their space-saving design, that allowed them to be stacked efficiently when empty and nested together to optimize storage and transportation.

The nestable segment is highly suitable for industries that maximize warehouse spaces and streamline logistics operations. Businesses tend to prioritize efficiency and cost-effectiveness in their supply chain management, and the demand for nestable HDPE crates continued to propel.

Logistics and Transportation Segment to Hold a Dominant Share in the Market

Based on end-users, the logistics and transportation segment is accounted to hold a market share of 31.4% in 2024. HDPE crates provide a reliable and durable packaging solution for safely handling and distributing goods.

Such crates offer superior product protection during transit by minimizing the risk of damage or breakage. With the global expansion of e-commerce and the propelling need for efficient warehousing and distribution networks, the demand for HDPE crates is augmented to have a robust surge in the segment.

Country-wise Insights

The table describes the top five countries ranked by revenue, with India holding the top position. India holds a magnified position due to the major usage of HDPE crates in the pharmaceutical industry as it ensures safe and secure delivery of medicines to hospitals, pharmacies, etc.

Forecast CAGRs from 2024 to 2034

Countries CAGR
United States 1.8%
Germany 1.5%
China 4.7%
Spain 2.1%
India 6.1%

Retail and Grocery Industry Improves the United States Market

The HDPE crate market is primarily used in the retail and grocery industry in the United States. Supermarkets, convenience stores, and retailers widely utilize HDPE crates to store and transport fresh produce, dairy products, beverages, and other perishable goods.

The crates offer durability, hygiene, and ease of handling, making them indispensable for efficiently managing inventory and supply chain logistics in the retail sector.

A boom in Automotive Manufacturing Raises the Market in Germany

In Germany, the HDPE crate market is majorly used in the automotive manufacturing sector. HDPE crates are employed for storing and transporting automotive parts, components, and assemblies within manufacturing facilities and throughout the supply chain.

The crates act as damage control and prohibit contamination and moisture, and critical components are ensured to be safe and efficient, thus handling the highly demanding automotive production environment.

Agriculture and Horticulture Boosts China Market

The market is predominantly used in the agriculture and horticulture sectors. HDPE crates have extensive applications in storing and transporting fruits, vegetables, and agricultural produce from farms to markets and distribution centers.

The crates offer ventilation, moisture resistance, and durability, facilitating proper airflow and protection for perishable crops during handling, storage, and transit.

Food and Beverage Distribution holds a Prominent Position in the Market

The HDPE crate market in Spain is primarily used in the food and beverage distribution industry. HDPE crates serve as essential packaging solutions for the safe and hygienic transportation of packaged food products, beverages, and bottled goods from manufacturers to retailers, restaurants, and consumers.

The crates ensure product integrity, hygiene, and freshness, contributing to the efficient and reliable distribution of food and beverage products across the supply chain.

Pharmaceutical Logistics has a Pivotal Position in India

The HDPE crate market in India is majorly used in the pharmaceutical logistics sector. HDPE crates are employed for storing and transporting pharmaceutical products, medicines, and healthcare supplies, ensuring their safe and secure delivery to hospitals, pharmacies, and healthcare facilities.

Such crates offer protection against contamination, tampering, and environmental factors, maintaining the quality and integrity of pharmaceutical products throughout the distribution process.
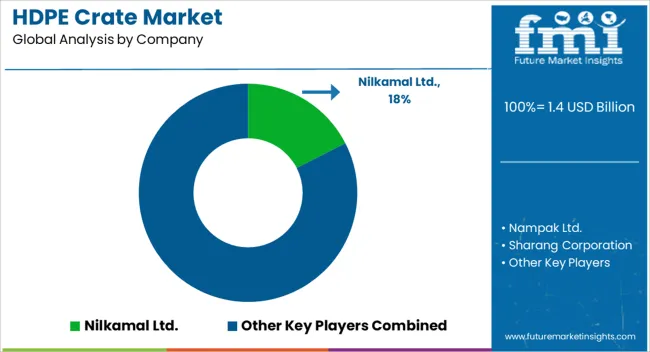
Competitive Landscape

Established manufacturers and suppliers of the HDPE market have a market share through strategic partnerships, product innovation, and expansion into new geographical regions.

Continuous efforts enhance the product offerings by improvising operational efficiency and meeting evolving customer demands that propel competition within the HDPE crate market.

Some of the key developments

  • In 2023, Sharang Corporation introduced a new line of HDPE crates featuring innovative design enhancements to improve stackability and durability. The development addressed customer feedback and market demand for crates that optimize storage space and withstand rigorous handling in various industries, including retail, agriculture, and logistics.
  • In 2023, Nampak Ltd. announced the extension of its manufacturing capacity for HDPE crates to meet growing demand in key markets. The strategic development allowed Nampak to strengthen its position as a leading supplier of HDPE crates.

Key Coverage in the HDPE Crate Industry Report

  • Adjacent Study on HDPE Crate Market
  • India Plastic Crates Market
  • Returnable Plastic Crate Market Size, Current Insights, and Demographic Trends
  • Global HDPE Crate Sales Market
  • Key Strategies in the Global HDPE Crate Market

Report Scope

Attributes Details
Estimated Market Size in 2024 US$ 1.4 billion
Projected Market Valuation in 2034 US$ 1.9 billion
Value-based CAGR 2024 to 2034 3%
Forecast Period 2024 to 2034
Historical Data Available for 2018 to 2023
Market Analysis Value in US$ billion
Key Regions Covered
  • North America
  • Latin America
  • Western Europe
  • Eastern Europe
  • South Asia and Pacific
  • East Asia
  • The Middle East and Africa
Key Market Segments Covered
  • Packaging Type
  • Product Type
  • End-use
  • Region
Key Countries Profiled
  • The United States
  • Canada
  • Brazil
  • Mexico
  • Germany
  • The United Kingdom
  • France
  • Spain
  • Italy
  • Russia
  • Poland
  • Czech Republic
  • Romania
  • India
  • Bangladesh
  • Australia
  • New Zealand
  • China
  • Japan
  • South Korea
  • GCC countries
  • South Africa
  • Israel
Key Companies Profiled
  • Sharang Corporation
  • Nampak Ltd.
  • ENKO Plastics
  • Gamma Wopla N.V
  • Chespak (Pty) Ltd.
  • Kenploy Manufacturers Limited
  • Nilkamal Ltd.
  • Plastwell Products

Key Segments

By Packaging Type:

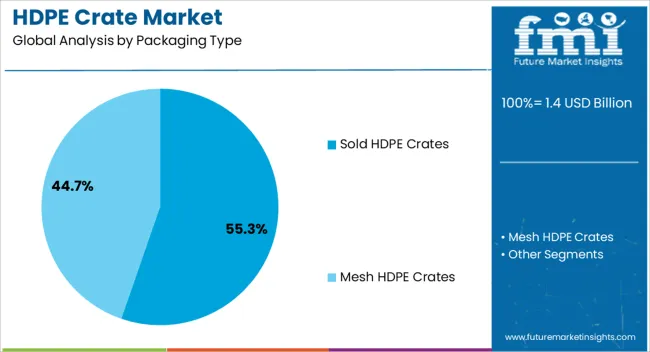
  • Sold HDPE Crates
  • Mesh HDPE Crates

By Product Type:

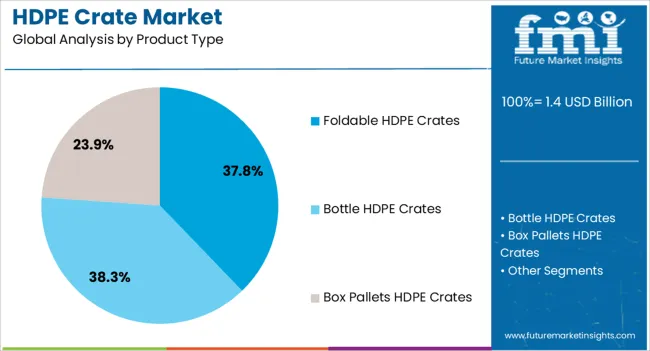
  • Foldable HDPE Crates
  • Bottle HDPE Crates
  • Box Pallets HDPE Crates

By End Use:

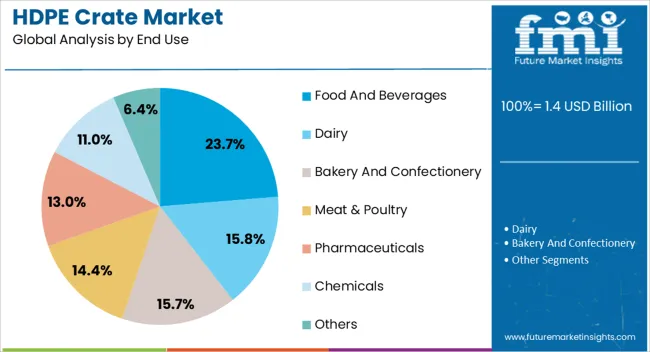
  • Food and Beverages
  • Dairy
  • Bakery and Confectionery
  • Meat & Poultry
  • Pharmaceuticals
  • Chemicals
  • Others

By Region:

  • North America
  • Latin America
  • Western Europe
  • Eastern Europe
  • South Asia and Pacific
  • East Asia
  • The Middle East and Africa

Frequently Asked Questions

What is the expected worth of the HDPE crate market in 2024?

As of 2024, the market for HDPE crates is expected to be valued at US$ 1.4 billion.

What is the market potential for HDPE crates?

The HDPE crate market is projected to expand at a CAGR of 3% between 2024 and 2034.

Which product type segment dominates the HDPE crate market?

The nestable segment is projected to dominate the industry.

What is the anticipated market value for HDPE crates in 2034?

By 2034, the market value of HDPE crates is expected to reach US$ 1.9 billion.

Which country is likely to dominate the HDPE crate market?

India is likely the top-performing market, with a CAGR of 6.1%.

Table of Content

1. Executive Summary

    1.1. Global Market Outlook

    1.2. Demand-side Trends

    1.3. Supply-side Trends

    1.4. Technology Roadmap Analysis

    1.5. Analysis and Recommendations

2. Market Overview

    2.1. Market Coverage / Taxonomy

    2.2. Market Definition / Scope / Limitations

3. Market Background

    3.1. Market Dynamics

        3.1.1. Drivers

        3.1.2. Restraints

        3.1.3. Opportunity

        3.1.4. Trends

    3.2. Scenario Forecast

        3.2.1. Demand in Optimistic Scenario

        3.2.2. Demand in Likely Scenario

        3.2.3. Demand in Conservative Scenario

    3.3. Opportunity Map Analysis

    3.4. Product Life Cycle Analysis

    3.5. Supply Chain Analysis

        3.5.1. Supply Side Participants and their Roles

            3.5.1.1. Manufacturer

        3.5.2. Value Added and Value Created at Node in the Supply Chain

        3.5.3. List of Raw Material Suppliers

        3.5.4. List of Existing and Potential Buyer’s

    3.6. Investment Feasibility Matrix

    3.7. Value Chain Analysis

        3.7.1. Profit Margin Analysis

    3.8. PESTLE and Porter’s Analysis

    3.9. Regulatory Landscape

        3.9.1. By Key Regions

        3.9.2. By Key Countries

    3.10. Regional Parent Market Outlook

    3.11. Production and Consumption Statistics

    3.12. Import and Export Statistics

4. Global Market Analysis 2019 to 2023 and Forecast, 2024 to 2034

    4.1. Historical Market Size Value (US$ Million) & Volume (Units) Analysis, 2019 to 2023

    4.2. Current and Future Market Size Value (US$ Million) & Volume (Units) Projections, 2024 to 2034

        4.2.1. Y-o-Y Growth Trend Analysis

        4.2.2. Absolute $ Opportunity Analysis

5. Global Market Analysis 2019 to 2023 and Forecast 2024 to 2034, By Packaging Type

    5.1. Introduction / Key Findings

    5.2. Historical Market Size Value (US$ Million) & Volume (Units) Analysis By Packaging Type, 2019 to 2023

    5.3. Current and Future Market Size Value (US$ Million) & Volume (Units) Analysis and Forecast By Packaging Type, 2024 to 2034

        5.3.1. Sold HDPE Crate

        5.3.2. Mesh HDPE Crate

    5.4. Y-o-Y Growth Trend Analysis By Packaging Type, 2019 to 2023

    5.5. Absolute $ Opportunity Analysis By Packaging Type, 2024 to 2034

6. Global Market Analysis 2019 to 2023 and Forecast 2024 to 2034, By Product Type

    6.1. Introduction / Key Findings

    6.2. Historical Market Size Value (US$ Million) & Volume (Units) Analysis By Product Type, 2019 to 2023

    6.3. Current and Future Market Size Value (US$ Million) & Volume (Units) Analysis and Forecast By Product Type, 2024 to 2034

        6.3.1. Foldable HDPE Crate

        6.3.2. Bottle HDPE Crate

        6.3.3. Box Pallets HDPE Crate

    6.4. Y-o-Y Growth Trend Analysis By Product Type, 2019 to 2023

    6.5. Absolute $ Opportunity Analysis By Product Type, 2024 to 2034

7. Global Market Analysis 2019 to 2023 and Forecast 2024 to 2034, By End Use

    7.1. Introduction / Key Findings

    7.2. Historical Market Size Value (US$ Million) & Volume (Units) Analysis By End Use, 2019 to 2023

    7.3. Current and Future Market Size Value (US$ Million) & Volume (Units) Analysis and Forecast By End Use, 2024 to 2034

        7.3.1. Food and Beverages

        7.3.2. Dairy

        7.3.3. Bakery and Confectionery

        7.3.4. Meat & Poultry

        7.3.5. Pharmaceuticals

        7.3.6. Chemicals

        7.3.7. Others

    7.4. Y-o-Y Growth Trend Analysis By End Use, 2019 to 2023

    7.5. Absolute $ Opportunity Analysis By End Use, 2024 to 2034

8. Global Market Analysis 2019 to 2023 and Forecast 2024 to 2034, By Region

    8.1. Introduction

    8.2. Historical Market Size Value (US$ Million) & Volume (Units) Analysis By Region, 2019 to 2023

    8.3. Current Market Size Value (US$ Million) & Volume (Units) Analysis and Forecast By Region, 2024 to 2034

        8.3.1. North America

        8.3.2. Latin America

        8.3.3. Western Europe

        8.3.4. Eastern Europe

        8.3.5. South Asia and Pacific

        8.3.6. East Asia

        8.3.7. Middle East and Africa

    8.4. Market Attractiveness Analysis By Region

9. North America Market Analysis 2019 to 2023 and Forecast 2024 to 2034, By Country

    9.1. Historical Market Size Value (US$ Million) & Volume (Units) Trend Analysis By Market Taxonomy, 2019 to 2023

    9.2. Market Size Value (US$ Million) & Volume (Units) Forecast By Market Taxonomy, 2024 to 2034

        9.2.1. By Country

            9.2.1.1. USA

            9.2.1.2. Canada

        9.2.2. By Packaging Type

        9.2.3. By Product Type

        9.2.4. By End Use

    9.3. Market Attractiveness Analysis

        9.3.1. By Country

        9.3.2. By Packaging Type

        9.3.3. By Product Type

        9.3.4. By End Use

    9.4. Key Takeaways

10. Latin America Market Analysis 2019 to 2023 and Forecast 2024 to 2034, By Country

    10.1. Historical Market Size Value (US$ Million) & Volume (Units) Trend Analysis By Market Taxonomy, 2019 to 2023

    10.2. Market Size Value (US$ Million) & Volume (Units) Forecast By Market Taxonomy, 2024 to 2034

        10.2.1. By Country

            10.2.1.1. Brazil

            10.2.1.2. Mexico

            10.2.1.3. Rest of Latin America

        10.2.2. By Packaging Type

        10.2.3. By Product Type

        10.2.4. By End Use

    10.3. Market Attractiveness Analysis

        10.3.1. By Country

        10.3.2. By Packaging Type

        10.3.3. By Product Type

        10.3.4. By End Use

    10.4. Key Takeaways

11. Western Europe Market Analysis 2019 to 2023 and Forecast 2024 to 2034, By Country

    11.1. Historical Market Size Value (US$ Million) & Volume (Units) Trend Analysis By Market Taxonomy, 2019 to 2023

    11.2. Market Size Value (US$ Million) & Volume (Units) Forecast By Market Taxonomy, 2024 to 2034

        11.2.1. By Country

            11.2.1.1. Germany

            11.2.1.2. UK

            11.2.1.3. France

            11.2.1.4. Spain

            11.2.1.5. Italy

            11.2.1.6. Rest of Western Europe

        11.2.2. By Packaging Type

        11.2.3. By Product Type

        11.2.4. By End Use

    11.3. Market Attractiveness Analysis

        11.3.1. By Country

        11.3.2. By Packaging Type

        11.3.3. By Product Type

        11.3.4. By End Use

    11.4. Key Takeaways

12. Eastern Europe Market Analysis 2019 to 2023 and Forecast 2024 to 2034, By Country

    12.1. Historical Market Size Value (US$ Million) & Volume (Units) Trend Analysis By Market Taxonomy, 2019 to 2023

    12.2. Market Size Value (US$ Million) & Volume (Units) Forecast By Market Taxonomy, 2024 to 2034

        12.2.1. By Country

            12.2.1.1. Poland

            12.2.1.2. Russia

            12.2.1.3. Czech Republic

            12.2.1.4. Romania

            12.2.1.5. Rest of Eastern Europe

        12.2.2. By Packaging Type

        12.2.3. By Product Type

        12.2.4. By End Use

    12.3. Market Attractiveness Analysis

        12.3.1. By Country

        12.3.2. By Packaging Type

        12.3.3. By Product Type

        12.3.4. By End Use

    12.4. Key Takeaways

13. South Asia and Pacific Market Analysis 2019 to 2023 and Forecast 2024 to 2034, By Country

    13.1. Historical Market Size Value (US$ Million) & Volume (Units) Trend Analysis By Market Taxonomy, 2019 to 2023

    13.2. Market Size Value (US$ Million) & Volume (Units) Forecast By Market Taxonomy, 2024 to 2034

        13.2.1. By Country

            13.2.1.1. India

            13.2.1.2. Bangladesh

            13.2.1.3. Australia

            13.2.1.4. New Zealand

            13.2.1.5. Rest of South Asia and Pacific

        13.2.2. By Packaging Type

        13.2.3. By Product Type

        13.2.4. By End Use

    13.3. Market Attractiveness Analysis

        13.3.1. By Country

        13.3.2. By Packaging Type

        13.3.3. By Product Type

        13.3.4. By End Use

    13.4. Key Takeaways

14. East Asia Market Analysis 2019 to 2023 and Forecast 2024 to 2034, By Country

    14.1. Historical Market Size Value (US$ Million) & Volume (Units) Trend Analysis By Market Taxonomy, 2019 to 2023

    14.2. Market Size Value (US$ Million) & Volume (Units) Forecast By Market Taxonomy, 2024 to 2034

        14.2.1. By Country

            14.2.1.1. China

            14.2.1.2. Japan

            14.2.1.3. South Korea

        14.2.2. By Packaging Type

        14.2.3. By Product Type

        14.2.4. By End Use

    14.3. Market Attractiveness Analysis

        14.3.1. By Country

        14.3.2. By Packaging Type

        14.3.3. By Product Type

        14.3.4. By End Use

    14.4. Key Takeaways

15. Middle East and Africa Market Analysis 2019 to 2023 and Forecast 2024 to 2034, By Country

    15.1. Historical Market Size Value (US$ Million) & Volume (Units) Trend Analysis By Market Taxonomy, 2019 to 2023

    15.2. Market Size Value (US$ Million) & Volume (Units) Forecast By Market Taxonomy, 2024 to 2034

        15.2.1. By Country

            15.2.1.1. GCC Countries

            15.2.1.2. South Africa

            15.2.1.3. Israel

            15.2.1.4. Rest of MEA

        15.2.2. By Packaging Type

        15.2.3. By Product Type

        15.2.4. By End Use

    15.3. Market Attractiveness Analysis

        15.3.1. By Country

        15.3.2. By Packaging Type

        15.3.3. By Product Type

        15.3.4. By End Use

    15.4. Key Takeaways

16. Key Countries Market Analysis

    16.1. USA

        16.1.1. Pricing Analysis

        16.1.2. Market Share Analysis, 2023

            16.1.2.1. By Packaging Type

            16.1.2.2. By Product Type

            16.1.2.3. By End Use

    16.2. Canada

        16.2.1. Pricing Analysis

        16.2.2. Market Share Analysis, 2023

            16.2.2.1. By Packaging Type

            16.2.2.2. By Product Type

            16.2.2.3. By End Use

    16.3. Brazil

        16.3.1. Pricing Analysis

        16.3.2. Market Share Analysis, 2023

            16.3.2.1. By Packaging Type

            16.3.2.2. By Product Type

            16.3.2.3. By End Use

    16.4. Mexico

        16.4.1. Pricing Analysis

        16.4.2. Market Share Analysis, 2023

            16.4.2.1. By Packaging Type

            16.4.2.2. By Product Type

            16.4.2.3. By End Use

    16.5. Germany

        16.5.1. Pricing Analysis

        16.5.2. Market Share Analysis, 2023

            16.5.2.1. By Packaging Type

            16.5.2.2. By Product Type

            16.5.2.3. By End Use

    16.6. UK

        16.6.1. Pricing Analysis

        16.6.2. Market Share Analysis, 2023

            16.6.2.1. By Packaging Type

            16.6.2.2. By Product Type

            16.6.2.3. By End Use

    16.7. France

        16.7.1. Pricing Analysis

        16.7.2. Market Share Analysis, 2023

            16.7.2.1. By Packaging Type

            16.7.2.2. By Product Type

            16.7.2.3. By End Use

    16.8. Spain

        16.8.1. Pricing Analysis

        16.8.2. Market Share Analysis, 2023

            16.8.2.1. By Packaging Type

            16.8.2.2. By Product Type

            16.8.2.3. By End Use

    16.9. Italy

        16.9.1. Pricing Analysis

        16.9.2. Market Share Analysis, 2023

            16.9.2.1. By Packaging Type

            16.9.2.2. By Product Type

            16.9.2.3. By End Use

    16.10. Poland

        16.10.1. Pricing Analysis

        16.10.2. Market Share Analysis, 2023

            16.10.2.1. By Packaging Type

            16.10.2.2. By Product Type

            16.10.2.3. By End Use

    16.11. Russia

        16.11.1. Pricing Analysis

        16.11.2. Market Share Analysis, 2023

            16.11.2.1. By Packaging Type

            16.11.2.2. By Product Type

            16.11.2.3. By End Use

    16.12. Czech Republic

        16.12.1. Pricing Analysis

        16.12.2. Market Share Analysis, 2023

            16.12.2.1. By Packaging Type

            16.12.2.2. By Product Type

            16.12.2.3. By End Use

    16.13. Romania

        16.13.1. Pricing Analysis

        16.13.2. Market Share Analysis, 2023

            16.13.2.1. By Packaging Type

            16.13.2.2. By Product Type

            16.13.2.3. By End Use

    16.14. India

        16.14.1. Pricing Analysis

        16.14.2. Market Share Analysis, 2023

            16.14.2.1. By Packaging Type

            16.14.2.2. By Product Type

            16.14.2.3. By End Use

    16.15. Bangladesh

        16.15.1. Pricing Analysis

        16.15.2. Market Share Analysis, 2023

            16.15.2.1. By Packaging Type

            16.15.2.2. By Product Type

            16.15.2.3. By End Use

    16.16. Australia

        16.16.1. Pricing Analysis

        16.16.2. Market Share Analysis, 2023

            16.16.2.1. By Packaging Type

            16.16.2.2. By Product Type

            16.16.2.3. By End Use

    16.17. New Zealand

        16.17.1. Pricing Analysis

        16.17.2. Market Share Analysis, 2023

            16.17.2.1. By Packaging Type

            16.17.2.2. By Product Type

            16.17.2.3. By End Use

    16.18. China

        16.18.1. Pricing Analysis

        16.18.2. Market Share Analysis, 2023

            16.18.2.1. By Packaging Type

            16.18.2.2. By Product Type

            16.18.2.3. By End Use

    16.19. Japan

        16.19.1. Pricing Analysis

        16.19.2. Market Share Analysis, 2023

            16.19.2.1. By Packaging Type

            16.19.2.2. By Product Type

            16.19.2.3. By End Use

    16.20. South Korea

        16.20.1. Pricing Analysis

        16.20.2. Market Share Analysis, 2023

            16.20.2.1. By Packaging Type

            16.20.2.2. By Product Type

            16.20.2.3. By End Use

    16.21. GCC Countries

        16.21.1. Pricing Analysis

        16.21.2. Market Share Analysis, 2023

            16.21.2.1. By Packaging Type

            16.21.2.2. By Product Type

            16.21.2.3. By End Use

    16.22. South Africa

        16.22.1. Pricing Analysis

        16.22.2. Market Share Analysis, 2023

            16.22.2.1. By Packaging Type

            16.22.2.2. By Product Type

            16.22.2.3. By End Use

    16.23. Israel

        16.23.1. Pricing Analysis

        16.23.2. Market Share Analysis, 2023

            16.23.2.1. By Packaging Type

            16.23.2.2. By Product Type

            16.23.2.3. By End Use

17. Market Structure Analysis

    17.1. Competition Dashboard

    17.2. Competition Benchmarking

    17.3. Market Share Analysis of Top Players

        17.3.1. By Regional

        17.3.2. By Packaging Type

        17.3.3. By Product Type

        17.3.4. By End Use

18. Competition Analysis

    18.1. Competition Deep Dive

        18.1.1. Sharang Corporation

            18.1.1.1. Overview

            18.1.1.2. Product Portfolio

            18.1.1.3. Profitability by Market Segments

            18.1.1.4. Sales Footprint

            18.1.1.5. Strategy Overview

                18.1.1.5.1. Marketing Strategy

                18.1.1.5.2. Product Strategy

                18.1.1.5.3. Channel Strategy

        18.1.2. Nampak Ltd.

            18.1.2.1. Overview

            18.1.2.2. Product Portfolio

            18.1.2.3. Profitability by Market Segments

            18.1.2.4. Sales Footprint

            18.1.2.5. Strategy Overview

                18.1.2.5.1. Marketing Strategy

                18.1.2.5.2. Product Strategy

                18.1.2.5.3. Channel Strategy

        18.1.3. ENKO Plastics

            18.1.3.1. Overview

            18.1.3.2. Product Portfolio

            18.1.3.3. Profitability by Market Segments

            18.1.3.4. Sales Footprint

            18.1.3.5. Strategy Overview

                18.1.3.5.1. Marketing Strategy

                18.1.3.5.2. Product Strategy

                18.1.3.5.3. Channel Strategy

        18.1.4. Gamma Wopla N.V

            18.1.4.1. Overview

            18.1.4.2. Product Portfolio

            18.1.4.3. Profitability by Market Segments

            18.1.4.4. Sales Footprint

            18.1.4.5. Strategy Overview

                18.1.4.5.1. Marketing Strategy

                18.1.4.5.2. Product Strategy

                18.1.4.5.3. Channel Strategy

        18.1.5. Chespak (Pty) Ltd.

            18.1.5.1. Overview

            18.1.5.2. Product Portfolio

            18.1.5.3. Profitability by Market Segments

            18.1.5.4. Sales Footprint

            18.1.5.5. Strategy Overview

                18.1.5.5.1. Marketing Strategy

                18.1.5.5.2. Product Strategy

                18.1.5.5.3. Channel Strategy

        18.1.6. Kenploy Manufacturers Limited

            18.1.6.1. Overview

            18.1.6.2. Product Portfolio

            18.1.6.3. Profitability by Market Segments

            18.1.6.4. Sales Footprint

            18.1.6.5. Strategy Overview

                18.1.6.5.1. Marketing Strategy

                18.1.6.5.2. Product Strategy

                18.1.6.5.3. Channel Strategy

        18.1.7. Nilkamal Ltd.

            18.1.7.1. Overview

            18.1.7.2. Product Portfolio

            18.1.7.3. Profitability by Market Segments

            18.1.7.4. Sales Footprint

            18.1.7.5. Strategy Overview

                18.1.7.5.1. Marketing Strategy

                18.1.7.5.2. Product Strategy

                18.1.7.5.3. Channel Strategy

        18.1.8. Plastwell Products

            18.1.8.1. Overview

            18.1.8.2. Product Portfolio

            18.1.8.3. Profitability by Market Segments

            18.1.8.4. Sales Footprint

            18.1.8.5. Strategy Overview

                18.1.8.5.1. Marketing Strategy

                18.1.8.5.2. Product Strategy

                18.1.8.5.3. Channel Strategy

19. Assumptions & Acronyms Used

20. Research Methodology

Don't pay for what you don't need

Customize your report by selecting specific countries or regions and save 30%!

List of Tables

Table 1: Global Market Value (US$ Million) Forecast by Region, 2019 to 2034

Table 2: Global Market Volume (Units) Forecast by Region, 2019 to 2034

Table 3: Global Market Value (US$ Million) Forecast by Packaging Type, 2019 to 2034

Table 4: Global Market Volume (Units) Forecast by Packaging Type, 2019 to 2034

Table 5: Global Market Value (US$ Million) Forecast by Product Type, 2019 to 2034

Table 6: Global Market Volume (Units) Forecast by Product Type, 2019 to 2034

Table 7: Global Market Value (US$ Million) Forecast by End Use, 2019 to 2034

Table 8: Global Market Volume (Units) Forecast by End Use, 2019 to 2034

Table 9: North America Market Value (US$ Million) Forecast by Country, 2019 to 2034

Table 10: North America Market Volume (Units) Forecast by Country, 2019 to 2034

Table 11: North America Market Value (US$ Million) Forecast by Packaging Type, 2019 to 2034

Table 12: North America Market Volume (Units) Forecast by Packaging Type, 2019 to 2034

Table 13: North America Market Value (US$ Million) Forecast by Product Type, 2019 to 2034

Table 14: North America Market Volume (Units) Forecast by Product Type, 2019 to 2034

Table 15: North America Market Value (US$ Million) Forecast by End Use, 2019 to 2034

Table 16: North America Market Volume (Units) Forecast by End Use, 2019 to 2034

Table 17: Latin America Market Value (US$ Million) Forecast by Country, 2019 to 2034

Table 18: Latin America Market Volume (Units) Forecast by Country, 2019 to 2034

Table 19: Latin America Market Value (US$ Million) Forecast by Packaging Type, 2019 to 2034

Table 20: Latin America Market Volume (Units) Forecast by Packaging Type, 2019 to 2034

Table 21: Latin America Market Value (US$ Million) Forecast by Product Type, 2019 to 2034

Table 22: Latin America Market Volume (Units) Forecast by Product Type, 2019 to 2034

Table 23: Latin America Market Value (US$ Million) Forecast by End Use, 2019 to 2034

Table 24: Latin America Market Volume (Units) Forecast by End Use, 2019 to 2034

Table 25: Western Europe Market Value (US$ Million) Forecast by Country, 2019 to 2034

Table 26: Western Europe Market Volume (Units) Forecast by Country, 2019 to 2034

Table 27: Western Europe Market Value (US$ Million) Forecast by Packaging Type, 2019 to 2034

Table 28: Western Europe Market Volume (Units) Forecast by Packaging Type, 2019 to 2034

Table 29: Western Europe Market Value (US$ Million) Forecast by Product Type, 2019 to 2034

Table 30: Western Europe Market Volume (Units) Forecast by Product Type, 2019 to 2034

Table 31: Western Europe Market Value (US$ Million) Forecast by End Use, 2019 to 2034

Table 32: Western Europe Market Volume (Units) Forecast by End Use, 2019 to 2034

Table 33: Eastern Europe Market Value (US$ Million) Forecast by Country, 2019 to 2034

Table 34: Eastern Europe Market Volume (Units) Forecast by Country, 2019 to 2034

Table 35: Eastern Europe Market Value (US$ Million) Forecast by Packaging Type, 2019 to 2034

Table 36: Eastern Europe Market Volume (Units) Forecast by Packaging Type, 2019 to 2034

Table 37: Eastern Europe Market Value (US$ Million) Forecast by Product Type, 2019 to 2034

Table 38: Eastern Europe Market Volume (Units) Forecast by Product Type, 2019 to 2034

Table 39: Eastern Europe Market Value (US$ Million) Forecast by End Use, 2019 to 2034

Table 40: Eastern Europe Market Volume (Units) Forecast by End Use, 2019 to 2034

Table 41: South Asia and Pacific Market Value (US$ Million) Forecast by Country, 2019 to 2034

Table 42: South Asia and Pacific Market Volume (Units) Forecast by Country, 2019 to 2034

Table 43: South Asia and Pacific Market Value (US$ Million) Forecast by Packaging Type, 2019 to 2034

Table 44: South Asia and Pacific Market Volume (Units) Forecast by Packaging Type, 2019 to 2034

Table 45: South Asia and Pacific Market Value (US$ Million) Forecast by Product Type, 2019 to 2034

Table 46: South Asia and Pacific Market Volume (Units) Forecast by Product Type, 2019 to 2034

Table 47: South Asia and Pacific Market Value (US$ Million) Forecast by End Use, 2019 to 2034

Table 48: South Asia and Pacific Market Volume (Units) Forecast by End Use, 2019 to 2034

Table 49: East Asia Market Value (US$ Million) Forecast by Country, 2019 to 2034

Table 50: East Asia Market Volume (Units) Forecast by Country, 2019 to 2034

Table 51: East Asia Market Value (US$ Million) Forecast by Packaging Type, 2019 to 2034

Table 52: East Asia Market Volume (Units) Forecast by Packaging Type, 2019 to 2034

Table 53: East Asia Market Value (US$ Million) Forecast by Product Type, 2019 to 2034

Table 54: East Asia Market Volume (Units) Forecast by Product Type, 2019 to 2034

Table 55: East Asia Market Value (US$ Million) Forecast by End Use, 2019 to 2034

Table 56: East Asia Market Volume (Units) Forecast by End Use, 2019 to 2034

Table 57: Middle East and Africa Market Value (US$ Million) Forecast by Country, 2019 to 2034

Table 58: Middle East and Africa Market Volume (Units) Forecast by Country, 2019 to 2034

Table 59: Middle East and Africa Market Value (US$ Million) Forecast by Packaging Type, 2019 to 2034

Table 60: Middle East and Africa Market Volume (Units) Forecast by Packaging Type, 2019 to 2034

Table 61: Middle East and Africa Market Value (US$ Million) Forecast by Product Type, 2019 to 2034

Table 62: Middle East and Africa Market Volume (Units) Forecast by Product Type, 2019 to 2034

Table 63: Middle East and Africa Market Value (US$ Million) Forecast by End Use, 2019 to 2034

Table 64: Middle East and Africa Market Volume (Units) Forecast by End Use, 2019 to 2034
Ismail Sutaria
Ismail Sutaria

Principal Consultant

Talk to Analyst

Find your sweet spots for generating winning opportunities in this market.

List of Charts

Figure 1: Global Market Value (US$ Million) by Packaging Type, 2024 to 2034

Figure 2: Global Market Value (US$ Million) by Product Type, 2024 to 2034

Figure 3: Global Market Value (US$ Million) by End Use, 2024 to 2034

Figure 4: Global Market Value (US$ Million) by Region, 2024 to 2034

Figure 5: Global Market Value (US$ Million) Analysis by Region, 2019 to 2034

Figure 6: Global Market Volume (Units) Analysis by Region, 2019 to 2034

Figure 7: Global Market Value Share (%) and BPS Analysis by Region, 2024 to 2034

Figure 8: Global Market Y-o-Y Growth (%) Projections by Region, 2024 to 2034

Figure 9: Global Market Value (US$ Million) Analysis by Packaging Type, 2019 to 2034

Figure 10: Global Market Volume (Units) Analysis by Packaging Type, 2019 to 2034

Figure 11: Global Market Value Share (%) and BPS Analysis by Packaging Type, 2024 to 2034

Figure 12: Global Market Y-o-Y Growth (%) Projections by Packaging Type, 2024 to 2034

Figure 13: Global Market Value (US$ Million) Analysis by Product Type, 2019 to 2034

Figure 14: Global Market Volume (Units) Analysis by Product Type, 2019 to 2034

Figure 15: Global Market Value Share (%) and BPS Analysis by Product Type, 2024 to 2034

Figure 16: Global Market Y-o-Y Growth (%) Projections by Product Type, 2024 to 2034

Figure 17: Global Market Value (US$ Million) Analysis by End Use, 2019 to 2034

Figure 18: Global Market Volume (Units) Analysis by End Use, 2019 to 2034

Figure 19: Global Market Value Share (%) and BPS Analysis by End Use, 2024 to 2034

Figure 20: Global Market Y-o-Y Growth (%) Projections by End Use, 2024 to 2034

Figure 21: Global Market Attractiveness by Packaging Type, 2024 to 2034

Figure 22: Global Market Attractiveness by Product Type, 2024 to 2034

Figure 23: Global Market Attractiveness by End Use, 2024 to 2034

Figure 24: Global Market Attractiveness by Region, 2024 to 2034

Figure 25: North America Market Value (US$ Million) by Packaging Type, 2024 to 2034

Figure 26: North America Market Value (US$ Million) by Product Type, 2024 to 2034

Figure 27: North America Market Value (US$ Million) by End Use, 2024 to 2034

Figure 28: North America Market Value (US$ Million) by Country, 2024 to 2034

Figure 29: North America Market Value (US$ Million) Analysis by Country, 2019 to 2034

Figure 30: North America Market Volume (Units) Analysis by Country, 2019 to 2034

Figure 31: North America Market Value Share (%) and BPS Analysis by Country, 2024 to 2034

Figure 32: North America Market Y-o-Y Growth (%) Projections by Country, 2024 to 2034

Figure 33: North America Market Value (US$ Million) Analysis by Packaging Type, 2019 to 2034

Figure 34: North America Market Volume (Units) Analysis by Packaging Type, 2019 to 2034

Figure 35: North America Market Value Share (%) and BPS Analysis by Packaging Type, 2024 to 2034

Figure 36: North America Market Y-o-Y Growth (%) Projections by Packaging Type, 2024 to 2034

Figure 37: North America Market Value (US$ Million) Analysis by Product Type, 2019 to 2034

Figure 38: North America Market Volume (Units) Analysis by Product Type, 2019 to 2034

Figure 39: North America Market Value Share (%) and BPS Analysis by Product Type, 2024 to 2034

Figure 40: North America Market Y-o-Y Growth (%) Projections by Product Type, 2024 to 2034

Figure 41: North America Market Value (US$ Million) Analysis by End Use, 2019 to 2034

Figure 42: North America Market Volume (Units) Analysis by End Use, 2019 to 2034

Figure 43: North America Market Value Share (%) and BPS Analysis by End Use, 2024 to 2034

Figure 44: North America Market Y-o-Y Growth (%) Projections by End Use, 2024 to 2034

Figure 45: North America Market Attractiveness by Packaging Type, 2024 to 2034

Figure 46: North America Market Attractiveness by Product Type, 2024 to 2034

Figure 47: North America Market Attractiveness by End Use, 2024 to 2034

Figure 48: North America Market Attractiveness by Country, 2024 to 2034

Figure 49: Latin America Market Value (US$ Million) by Packaging Type, 2024 to 2034

Figure 50: Latin America Market Value (US$ Million) by Product Type, 2024 to 2034

Figure 51: Latin America Market Value (US$ Million) by End Use, 2024 to 2034

Figure 52: Latin America Market Value (US$ Million) by Country, 2024 to 2034

Figure 53: Latin America Market Value (US$ Million) Analysis by Country, 2019 to 2034

Figure 54: Latin America Market Volume (Units) Analysis by Country, 2019 to 2034

Figure 55: Latin America Market Value Share (%) and BPS Analysis by Country, 2024 to 2034

Figure 56: Latin America Market Y-o-Y Growth (%) Projections by Country, 2024 to 2034

Figure 57: Latin America Market Value (US$ Million) Analysis by Packaging Type, 2019 to 2034

Figure 58: Latin America Market Volume (Units) Analysis by Packaging Type, 2019 to 2034

Figure 59: Latin America Market Value Share (%) and BPS Analysis by Packaging Type, 2024 to 2034

Figure 60: Latin America Market Y-o-Y Growth (%) Projections by Packaging Type, 2024 to 2034

Figure 61: Latin America Market Value (US$ Million) Analysis by Product Type, 2019 to 2034

Figure 62: Latin America Market Volume (Units) Analysis by Product Type, 2019 to 2034

Figure 63: Latin America Market Value Share (%) and BPS Analysis by Product Type, 2024 to 2034

Figure 64: Latin America Market Y-o-Y Growth (%) Projections by Product Type, 2024 to 2034

Figure 65: Latin America Market Value (US$ Million) Analysis by End Use, 2019 to 2034

Figure 66: Latin America Market Volume (Units) Analysis by End Use, 2019 to 2034

Figure 67: Latin America Market Value Share (%) and BPS Analysis by End Use, 2024 to 2034

Figure 68: Latin America Market Y-o-Y Growth (%) Projections by End Use, 2024 to 2034

Figure 69: Latin America Market Attractiveness by Packaging Type, 2024 to 2034

Figure 70: Latin America Market Attractiveness by Product Type, 2024 to 2034

Figure 71: Latin America Market Attractiveness by End Use, 2024 to 2034

Figure 72: Latin America Market Attractiveness by Country, 2024 to 2034

Figure 73: Western Europe Market Value (US$ Million) by Packaging Type, 2024 to 2034

Figure 74: Western Europe Market Value (US$ Million) by Product Type, 2024 to 2034

Figure 75: Western Europe Market Value (US$ Million) by End Use, 2024 to 2034

Figure 76: Western Europe Market Value (US$ Million) by Country, 2024 to 2034

Figure 77: Western Europe Market Value (US$ Million) Analysis by Country, 2019 to 2034

Figure 78: Western Europe Market Volume (Units) Analysis by Country, 2019 to 2034

Figure 79: Western Europe Market Value Share (%) and BPS Analysis by Country, 2024 to 2034

Figure 80: Western Europe Market Y-o-Y Growth (%) Projections by Country, 2024 to 2034

Figure 81: Western Europe Market Value (US$ Million) Analysis by Packaging Type, 2019 to 2034

Figure 82: Western Europe Market Volume (Units) Analysis by Packaging Type, 2019 to 2034

Figure 83: Western Europe Market Value Share (%) and BPS Analysis by Packaging Type, 2024 to 2034

Figure 84: Western Europe Market Y-o-Y Growth (%) Projections by Packaging Type, 2024 to 2034

Figure 85: Western Europe Market Value (US$ Million) Analysis by Product Type, 2019 to 2034

Figure 86: Western Europe Market Volume (Units) Analysis by Product Type, 2019 to 2034

Figure 87: Western Europe Market Value Share (%) and BPS Analysis by Product Type, 2024 to 2034

Figure 88: Western Europe Market Y-o-Y Growth (%) Projections by Product Type, 2024 to 2034

Figure 89: Western Europe Market Value (US$ Million) Analysis by End Use, 2019 to 2034

Figure 90: Western Europe Market Volume (Units) Analysis by End Use, 2019 to 2034

Figure 91: Western Europe Market Value Share (%) and BPS Analysis by End Use, 2024 to 2034

Figure 92: Western Europe Market Y-o-Y Growth (%) Projections by End Use, 2024 to 2034

Figure 93: Western Europe Market Attractiveness by Packaging Type, 2024 to 2034

Figure 94: Western Europe Market Attractiveness by Product Type, 2024 to 2034

Figure 95: Western Europe Market Attractiveness by End Use, 2024 to 2034

Figure 96: Western Europe Market Attractiveness by Country, 2024 to 2034

Figure 97: Eastern Europe Market Value (US$ Million) by Packaging Type, 2024 to 2034

Figure 98: Eastern Europe Market Value (US$ Million) by Product Type, 2024 to 2034

Figure 99: Eastern Europe Market Value (US$ Million) by End Use, 2024 to 2034

Figure 100: Eastern Europe Market Value (US$ Million) by Country, 2024 to 2034

Figure 101: Eastern Europe Market Value (US$ Million) Analysis by Country, 2019 to 2034

Figure 102: Eastern Europe Market Volume (Units) Analysis by Country, 2019 to 2034

Figure 103: Eastern Europe Market Value Share (%) and BPS Analysis by Country, 2024 to 2034

Figure 104: Eastern Europe Market Y-o-Y Growth (%) Projections by Country, 2024 to 2034

Figure 105: Eastern Europe Market Value (US$ Million) Analysis by Packaging Type, 2019 to 2034

Figure 106: Eastern Europe Market Volume (Units) Analysis by Packaging Type, 2019 to 2034

Figure 107: Eastern Europe Market Value Share (%) and BPS Analysis by Packaging Type, 2024 to 2034

Figure 108: Eastern Europe Market Y-o-Y Growth (%) Projections by Packaging Type, 2024 to 2034

Figure 109: Eastern Europe Market Value (US$ Million) Analysis by Product Type, 2019 to 2034

Figure 110: Eastern Europe Market Volume (Units) Analysis by Product Type, 2019 to 2034

Figure 111: Eastern Europe Market Value Share (%) and BPS Analysis by Product Type, 2024 to 2034

Figure 112: Eastern Europe Market Y-o-Y Growth (%) Projections by Product Type, 2024 to 2034

Figure 113: Eastern Europe Market Value (US$ Million) Analysis by End Use, 2019 to 2034

Figure 114: Eastern Europe Market Volume (Units) Analysis by End Use, 2019 to 2034

Figure 115: Eastern Europe Market Value Share (%) and BPS Analysis by End Use, 2024 to 2034

Figure 116: Eastern Europe Market Y-o-Y Growth (%) Projections by End Use, 2024 to 2034

Figure 117: Eastern Europe Market Attractiveness by Packaging Type, 2024 to 2034

Figure 118: Eastern Europe Market Attractiveness by Product Type, 2024 to 2034

Figure 119: Eastern Europe Market Attractiveness by End Use, 2024 to 2034

Figure 120: Eastern Europe Market Attractiveness by Country, 2024 to 2034

Figure 121: South Asia and Pacific Market Value (US$ Million) by Packaging Type, 2024 to 2034

Figure 122: South Asia and Pacific Market Value (US$ Million) by Product Type, 2024 to 2034

Figure 123: South Asia and Pacific Market Value (US$ Million) by End Use, 2024 to 2034

Figure 124: South Asia and Pacific Market Value (US$ Million) by Country, 2024 to 2034

Figure 125: South Asia and Pacific Market Value (US$ Million) Analysis by Country, 2019 to 2034

Figure 126: South Asia and Pacific Market Volume (Units) Analysis by Country, 2019 to 2034

Figure 127: South Asia and Pacific Market Value Share (%) and BPS Analysis by Country, 2024 to 2034

Figure 128: South Asia and Pacific Market Y-o-Y Growth (%) Projections by Country, 2024 to 2034

Figure 129: South Asia and Pacific Market Value (US$ Million) Analysis by Packaging Type, 2019 to 2034

Figure 130: South Asia and Pacific Market Volume (Units) Analysis by Packaging Type, 2019 to 2034

Figure 131: South Asia and Pacific Market Value Share (%) and BPS Analysis by Packaging Type, 2024 to 2034

Figure 132: South Asia and Pacific Market Y-o-Y Growth (%) Projections by Packaging Type, 2024 to 2034

Figure 133: South Asia and Pacific Market Value (US$ Million) Analysis by Product Type, 2019 to 2034

Figure 134: South Asia and Pacific Market Volume (Units) Analysis by Product Type, 2019 to 2034

Figure 135: South Asia and Pacific Market Value Share (%) and BPS Analysis by Product Type, 2024 to 2034

Figure 136: South Asia and Pacific Market Y-o-Y Growth (%) Projections by Product Type, 2024 to 2034

Figure 137: South Asia and Pacific Market Value (US$ Million) Analysis by End Use, 2019 to 2034

Figure 138: South Asia and Pacific Market Volume (Units) Analysis by End Use, 2019 to 2034

Figure 139: South Asia and Pacific Market Value Share (%) and BPS Analysis by End Use, 2024 to 2034

Figure 140: South Asia and Pacific Market Y-o-Y Growth (%) Projections by End Use, 2024 to 2034

Figure 141: South Asia and Pacific Market Attractiveness by Packaging Type, 2024 to 2034

Figure 142: South Asia and Pacific Market Attractiveness by Product Type, 2024 to 2034

Figure 143: South Asia and Pacific Market Attractiveness by End Use, 2024 to 2034

Figure 144: South Asia and Pacific Market Attractiveness by Country, 2024 to 2034

Figure 145: East Asia Market Value (US$ Million) by Packaging Type, 2024 to 2034

Figure 146: East Asia Market Value (US$ Million) by Product Type, 2024 to 2034

Figure 147: East Asia Market Value (US$ Million) by End Use, 2024 to 2034

Figure 148: East Asia Market Value (US$ Million) by Country, 2024 to 2034

Figure 149: East Asia Market Value (US$ Million) Analysis by Country, 2019 to 2034

Figure 150: East Asia Market Volume (Units) Analysis by Country, 2019 to 2034

Figure 151: East Asia Market Value Share (%) and BPS Analysis by Country, 2024 to 2034

Figure 152: East Asia Market Y-o-Y Growth (%) Projections by Country, 2024 to 2034

Figure 153: East Asia Market Value (US$ Million) Analysis by Packaging Type, 2019 to 2034

Figure 154: East Asia Market Volume (Units) Analysis by Packaging Type, 2019 to 2034

Figure 155: East Asia Market Value Share (%) and BPS Analysis by Packaging Type, 2024 to 2034

Figure 156: East Asia Market Y-o-Y Growth (%) Projections by Packaging Type, 2024 to 2034

Figure 157: East Asia Market Value (US$ Million) Analysis by Product Type, 2019 to 2034

Figure 158: East Asia Market Volume (Units) Analysis by Product Type, 2019 to 2034

Figure 159: East Asia Market Value Share (%) and BPS Analysis by Product Type, 2024 to 2034

Figure 160: East Asia Market Y-o-Y Growth (%) Projections by Product Type, 2024 to 2034

Figure 161: East Asia Market Value (US$ Million) Analysis by End Use, 2019 to 2034

Figure 162: East Asia Market Volume (Units) Analysis by End Use, 2019 to 2034

Figure 163: East Asia Market Value Share (%) and BPS Analysis by End Use, 2024 to 2034

Figure 164: East Asia Market Y-o-Y Growth (%) Projections by End Use, 2024 to 2034

Figure 165: East Asia Market Attractiveness by Packaging Type, 2024 to 2034

Figure 166: East Asia Market Attractiveness by Product Type, 2024 to 2034

Figure 167: East Asia Market Attractiveness by End Use, 2024 to 2034

Figure 168: East Asia Market Attractiveness by Country, 2024 to 2034

Figure 169: Middle East and Africa Market Value (US$ Million) by Packaging Type, 2024 to 2034

Figure 170: Middle East and Africa Market Value (US$ Million) by Product Type, 2024 to 2034

Figure 171: Middle East and Africa Market Value (US$ Million) by End Use, 2024 to 2034

Figure 172: Middle East and Africa Market Value (US$ Million) by Country, 2024 to 2034

Figure 173: Middle East and Africa Market Value (US$ Million) Analysis by Country, 2019 to 2034

Figure 174: Middle East and Africa Market Volume (Units) Analysis by Country, 2019 to 2034

Figure 175: Middle East and Africa Market Value Share (%) and BPS Analysis by Country, 2024 to 2034

Figure 176: Middle East and Africa Market Y-o-Y Growth (%) Projections by Country, 2024 to 2034

Figure 177: Middle East and Africa Market Value (US$ Million) Analysis by Packaging Type, 2019 to 2034

Figure 178: Middle East and Africa Market Volume (Units) Analysis by Packaging Type, 2019 to 2034

Figure 179: Middle East and Africa Market Value Share (%) and BPS Analysis by Packaging Type, 2024 to 2034

Figure 180: Middle East and Africa Market Y-o-Y Growth (%) Projections by Packaging Type, 2024 to 2034

Figure 181: Middle East and Africa Market Value (US$ Million) Analysis by Product Type, 2019 to 2034

Figure 182: Middle East and Africa Market Volume (Units) Analysis by Product Type, 2019 to 2034

Figure 183: Middle East and Africa Market Value Share (%) and BPS Analysis by Product Type, 2024 to 2034

Figure 184: Middle East and Africa Market Y-o-Y Growth (%) Projections by Product Type, 2024 to 2034

Figure 185: Middle East and Africa Market Value (US$ Million) Analysis by End Use, 2019 to 2034

Figure 186: Middle East and Africa Market Volume (Units) Analysis by End Use, 2019 to 2034

Figure 187: Middle East and Africa Market Value Share (%) and BPS Analysis by End Use, 2024 to 2034

Figure 188: Middle East and Africa Market Y-o-Y Growth (%) Projections by End Use, 2024 to 2034

Figure 189: Middle East and Africa Market Attractiveness by Packaging Type, 2024 to 2034

Figure 190: Middle East and Africa Market Attractiveness by Product Type, 2024 to 2034

Figure 191: Middle East and Africa Market Attractiveness by End Use, 2024 to 2034

Figure 192: Middle East and Africa Market Attractiveness by Country, 2024 to 2034

Recommendations

Packaging

Wooden Crate Market

Published : March 2024

Packaging

Crates Market

Published : August 2023

Packaging

Crates And Pallets Packaging Market

Published : September 2022

Packaging

Cardboard Crates Market

Published : July 2021

Explore Packaging Insights

View Reports