Reports
- Global Locations -
Headquarters
Future Market Insights, Inc.
Christiana Corporate, 200
Continental Drive, Suite 401,
Newark, Delaware - 19713,
United States
Americas
Future Market Insights, Inc.
616 Corporate Way, Suite 2-9018,
Valley Cottage, NY 10989, United States
MEA
Future Market Insights
1602-6 Jumeirah Bay X2 Tower, Plot No: JLT-PH2-X2A,
Jumeirah Lakes Towers, Dubai,
United Arab Emirates
Europe
Future Market Insights
3rd Floor, 207 Regent Street,
W1B 3HH London
United Kingdom
Asia Pacific
Future Market Insights
Office No. 401-A, 4th Floor,
VANTAGE 9, S.No. 36/1/1,
Baner, Pune 411045, India
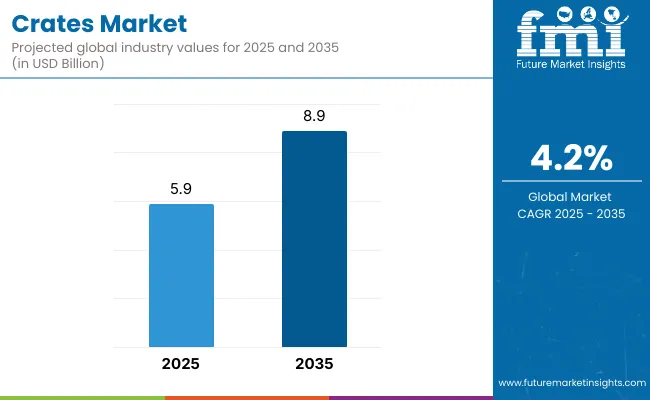
The global crates market size was valued at US$ 5.3 billion in 2022 and is likely to exhibit a year-on-year (YoY) growth rate of 4% in 2023, reaching around US$ 5.61 billion. With the growing adoption of crates across various end-use industries, the demand is slated to increase at 5.9% CAGR between 2023 and 2033, totaling around US$ 9.95 billion by 2033.
Key Statistics:
Consumer demand for plastic crates has increased significantly due to HDPE's strong resilience and the huge carrying capacity of collapsible crates made of HDPE. Also, fruits, vegetables, drinks, and other items are stored or transported in crates in the food and beverage business. According to market research, the food & beverage end-use segment may increase at a CAGR of 6.7% over the forecast period.
In 2023, the United States crates market is projected to expand 1.8 times the current sales, bucking initial skepticism about how the market may perform. Across the whole of North America, total sales of crates reached US$ 1.3 billion.
Crates Industry (From 2018 to 2022):
CAGR | 4.8% |
---|---|
Market Size - 2018 | US$ 4.34 billion |
Market Size - 2022 | US$ 5.24 billion |
Crates Industry (From 2023 to 2033):
CAGR | 5.9% |
---|---|
Market Size - 2023 | US$ 5.61 billion |
Market Size - 2033 | US$ 9.95 billion |
Don't pay for what you don't need
Customize your report by selecting specific countries or regions and save 30%!
The global crates market witnessed an HCAGR of 4.8% between 2018 and 2022. With the significant growth of industries such as food & beverages and logistics, the overall sales of crates are set to rise at 5.9% CAGR between 2023 and 2033.
Crates are lightweight carriages or cases for transporting vegetables, groceries, and many other products. They help end users in the safe transportation of products while reducing costs.
Ventilated crates and partition crates are estimated to gain significant traction among end users as these types of crates are used directly for display on the shelves of supermarkets.
Regular crates with collapsible sides are mostly preferred in returnable packaging, wherein crates are folded for inbound trips and rigid for outbound trips. Although the demand for bulk bags and FIBCs is increasing, the consumption of crates is likely to outpace these packaging solutions as they give huge support against impacts during storage and transportation.
Notable expansion of end-use industries and a growing preference for lightweight and durable packaging solutions are expected to provide a strong thrust to the crates industry during the forecast period. Moreover, various market participants and product innovations entering the market may support the market growth of crates during the forthcoming years.
Crates Pooling Creating Opportunities for Collapsible Crates in the Market
As per the key insights that the Reusable Packaging Association shared, the global transport or transit packaging market is estimated to hold nearly 21% of the global packaging market. This includes transporting raw materials, commodities, or finished products involving business-to-business or business-to-consumer product transport.
Out of this global transport packaging market, the reusable packaging market holds a significant value share of 50%. The global reusable transport packaging (RTP) market includes various products such as crates and others, which comprise the estimated worth of US$ 100 billion reusable packaging market. Crates, including rigid containers and trays, are counted to record a value of US$ 17.7 billion in the RTP market.
It is analyzed that the end users are moving toward including reusable packaging for transportation over single-use packaging formats based on these facts. Most end users outsource shipping and logistics to rental services with a high demand for crates for transporting bulk packages.
FMI estimates that the crates pooling/renting services may create an opportunity to boost sales of collapsible crates as they consume less storage space during return transit and save the additional cost of transportation.
The Surge in Grocery Delivery and Pickup Amplifying Crate Sales
It has been witnessed that grocery delivery & pickup has increased significantly during the last three years, and the trend is likely to continue during the forecast period.
People are keen to order products from their homes to save their precious time and money. The e-commerce industry is significantly gaining momentum, attributing to a jarring spike in the pickup and delivery of essential products such as groceries, vegetables, fruits, and general medicines.
As per FMI, online grocery sales increased by more than 28% in 2021 compared to last year and crossed 41% in 2022. The demand for crates among e-commerce giants such as Amazon, Big Basket, Carrefour Hypermarches, Fresh Direct LLC., and many others increased exponentially for delivering grocery products to consumers' doorsteps.
End users are switching to these products as crates are an easy and convenient packaging format for material handling. They are sturdy and reusable, ensuring the product's quality during transportation.
Category | Material Type |
---|---|
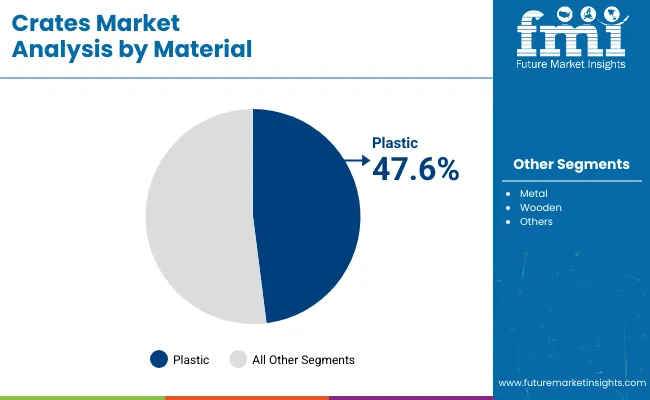
Leading Segment | Plastic Crates |
Details | Share - 69% |
Category | End Use |
---|---|
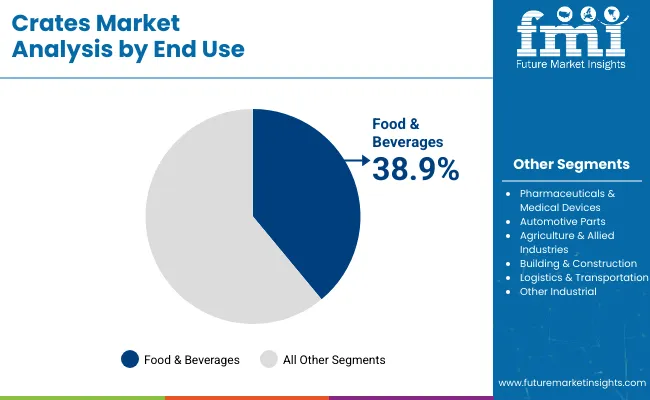
Leading Segment | Food and Beverages |
Details | CAGR - 6.7% |
Lightweight and Cost-Effective Nature of Plastic Crates Making them Popular Among End Users
As per FMI, the plastic crates segment accounts for over 69% of the global crate market, and it is expected to increase at a rate of 2.1X through 2033. This can be attributable to the rising end-user preference for plastic crates due to their attractive features, such as lightweight, affordable, and better protection.
Plastic crates safeguard delivered and stored products from damage or breakage while simplifying their handling. Also, they are preferred over metal or wooden crates due to various features.
Demand for Crates to Remain High in Food & Beverages Industry
Food and beverages are predicted to account for the dominant share of the global crates market in 2023, and this trend is expected to continue throughout the forecast period. This can be attributed to the rapid expansion of the food and beverage industry and the increasing usage of flexible packaging solutions such as crates.
FMI forecasts the food and beverages segment is expected to accelerate with a CAGR of 6.7% during the forecast period.
Space-Saving Feature of Collapsible Crates Fueling their Adoption
Collapsible crates are mostly used to convey food and beverages, and they serve a significant function because they can fold down and take up less room when not in use. This reduces the cost of transportation and storage. Further, they have perforated sides and bases that enable air to circulate, making them perfect for transporting fresh fruits and vegetables.
Growth in the E-commerce Industry and the Growing Popularity of Ecofriendly Crates is Spurring Market Growth in the United States
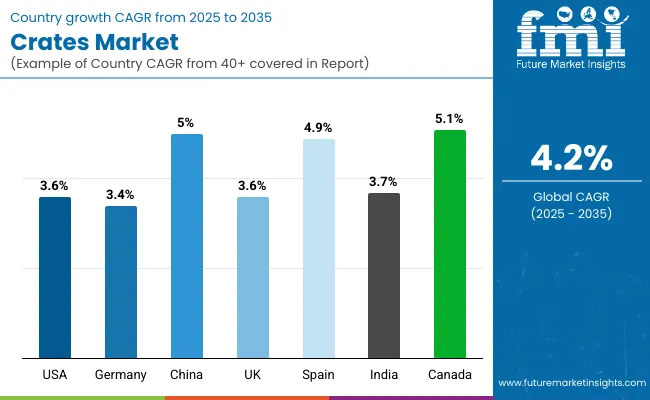
According to FMI analysis, the United States crates market is projected to expand at 5.5% CAGR between 2023 and 2033, reaching a valuation of around US$ 941.48 million in 2023. The United States may hold a considerable share of 17.4% of the global crates market in 2023.
Growth in the United States crates market is driven by flourishing export business, the e-commerce industry's significant expansion, and the growing popularity of eco-friendly carte packaging.
The country's strong presence of leading crate manufacturers is expected to play a key role in boosting market growth in the forecast period.
Notable Expansion of End-use Industries Pushing Demand for Crates in India Market
Amid the rapid growth of end-use industries such as food & beverages, pharmaceuticals, automotive, and logistics, India’s crates market is set to expand at a prominent CAGR of 7.6% between 2023 and 2033, reaching a valuation of US$ 974.75 million by 2033.
Several industries, including food and beverage, pharmaceuticals, and retail, have experienced substantial industrialization and expansion due to increased international commerce and several favorable measures by the government of India. Make-in-India initiatives and industry-specific incentives are boosting the establishment of numerous manufacturing enterprises in India.
The significant expansion of these industries may provide momentum to the growth of the crates market in India during the forecast period. Demand is particularly for plastic crates in the country due to their low costs and easy availability. They are being increasingly used for the transportation of numerous products by end-use industries.
Get the data you need at a Fraction of the cost
Personalize your report by choosing insights you need
and save 40%!
Some of the leading manufacturers of crates market are Brambles Limited, Schoeller Allibert AB, NEFAB GROUP, Myers Industries, Inc., DS Smith PLC, Dynawest Limited, Craemer UK Ltd, SABIC, Supreme Industries Limited, and Rehrig Pacific Company, Inc.
Crate manufacturers have reshaped the product so consumers are drawn to acquire crates. They also provide their customers with lightweight and environment-friendly crates.
Novel Breakthroughs
Company | Schoeller Allibert |
---|---|
Strategy | Innovation |
Details | In 2021, Schoeller Allibert developed a highly sustainable beer crate made from maritime plastics for AB InBev. The new crate is 100% recyclable and may help the company to attract many customers. |
Company | IFCO |
---|---|
Strategy | Launch |
Details | In February 2022, IFCO, the world’s leading provider of Reusable Packaging Containers (RPCs) for fresh grocery products, launched a newly designed Collapsible Egg Crate to transport fresh eggs and dairy products through the entire supply chain. |
Company | IFCO |
---|---|
Strategy | Launch |
Details | In June 2021, IFCO launched a new Banana Lift Lock crate that offers additional benefits for the transportation of bananas. |
The WestRock Company and Brambles: Two Leading Names Driving Innovation in Crate Manufacturing
For any crate manufacturer, having a production center and various distribution and supply channels is paramount. Leading crate manufacturers ensure that they keep these business areas agile to consolidate their position.
The WestRock Company, a leading crate manufacturer, continues to invest in new projects as part of its overall business strategy. For instance, it announced the start of construction on a US$ 97 million project to expand and modernize the company's paper mill, a key employer and driver of economic activity in Jackson Parish, the United States.
The investment in construction may increase capacity and efficiencies at the facility, which employs more than 450 people with an annual payroll of more than US$ 44 million in north Louisiana.
The company announced in 2021 that it may invest more than US$ 47 million to expand its manufacturing facility in Claremont, North Carolina. The project is expected to create 50 jobs in Catawba County.
Sustainability is also a key focus area for The WestRock Company, and it continues to invest in innovative and eco-friendly materials. For instance, the company announced it had developed a proprietary collection of packaging made from sustainably sourced wood fiber.
The EverGrow packaging is curbside recyclable when emptied and flattened, supporting the company's ambition to reduce waste and build a 100 percent reusable, recyclable, and compostable product portfolio. The company is dedicated to manufacturing eco-friendly and sustainable packaging solutions such as boxes and crates.
Brambles, another prominent crate manufacturer, is also increasing its production capacity while ensuring it meets its sustainability goals. For instance, in 2021, the company received a high score in the Dow Jones Barron's sustainability ranking. The company also announced in 2020 that it was on course to meet its sustainability targets.
Brambles has made considerable progress toward its goal of positively impacting the environment since 2015. Through the Better Planet pillar, it has significantly reduced its environmental footprint by eliminating 10.3 million tons of CO2–equivalent to the CO2 emitted by 1,950,560 homes in one year; 34.3 gigaliters of water–or around 13,720 Olympic-sized pools; and 8 million cubic meters of wood and 5.8 million tons of solid waste.
The company is focused on developing eco-friendly crates that may help it increase its customer base while at the same time complying with stringent environmental regulations.
1. Executive Summary 1.1. Global Market Outlook 1.2. Demand-side Trends 1.3. Supply-side Trends 1.4. Technology Roadmap Analysis 1.5. Analysis and Recommendations 2. Market Overview 2.1. Market Coverage / Taxonomy 2.2. Market Definition / Scope / Limitations 3. Market Background 3.1. Market Dynamics 3.1.1. Drivers 3.1.2. Restraints 3.1.3. Opportunity 3.1.4. Trends 3.2. Scenario Forecast 3.2.1. Demand in Optimistic Scenario 3.2.2. Demand in Likely Scenario 3.2.3. Demand in Conservative Scenario 3.3. Opportunity Map Analysis 3.4. Product Life Cycle Analysis 3.5. Supply Chain Analysis 3.5.1. Supply Side Participants and their Roles 3.5.1.1. Producers 3.5.1.2. Mid-Level Participants (Traders/ Agents/ Brokers) 3.5.1.3. Wholesalers and Distributors 3.5.2. Value Added and Value Created at Node in the Supply Chain 3.5.3. List of Raw Material Suppliers 3.5.4. List of Existing and Potential Buyer’s 3.6. Investment Feasibility Matrix 3.7. Value Chain Analysis 3.7.1. Profit Margin Analysis 3.7.2. Wholesalers and Distributors 3.7.3. Retailers 3.8. PESTLE and Porter’s Analysis 3.9. Regulatory Landscape 3.9.1. By Key Regions 3.9.2. By Key Countries 3.10. Regional Parent Market Outlook 3.11. Production and Consumption Statistics 3.12. Import and Export Statistics 4. Global Market Analysis 2018 to 2022 and Forecast, 2023 to 2033 4.1. Historical Market Size Value (US$ Million) & Volume (Units) Analysis, 2018 to 2022 4.2. Current and Future Market Size Value (US$ Million) & Volume (Units) Projections, 2023 to 2033 4.2.1. Y-o-Y Growth Trend Analysis 4.2.2. Absolute $ Opportunity Analysis 5. Global Market Analysis 2018 to 2022 and Forecast 2023 to 2033, By Material Type 5.1. Introduction / Key Findings 5.2. Historical Market Size Value (US$ Million) & Volume (Units) Analysis By Material Type, 2018 to 2022 5.3. Current and Future Market Size Value (US$ Million) & Volume (Units) Analysis and Forecast By Material Type, 2023 to 2033 5.3.1. Plastic 5.3.1.1. High-density Polyethylene (HDPE) 5.3.1.2. Polypropylene (PP) 5.3.2. Wooden 5.3.3. Metal 5.4. Y-o-Y Growth Trend Analysis By Material Type, 2018 to 2022 5.5. Absolute $ Opportunity Analysis By Material Type, 2023 to 2033 6. Global Market Analysis 2018 to 2022 and Forecast 2023 to 2033, By Product Type 6.1. Introduction / Key Findings 6.2. Historical Market Size Value (US$ Million) & Volume (Units) Analysis By Product Type, 2018 to 2022 6.3. Current and Future Market Size Value (US$ Million) & Volume (Units) Analysis and Forecast By Product Type, 2023 to 2033 6.3.1. Stackable 6.3.2. Nestable 6.3.3. Collapsible 6.4. Y-o-Y Growth Trend Analysis By Product Type, 2018 to 2022 6.5. Absolute $ Opportunity Analysis By Product Type, 2023 to 2033 7. Global Market Analysis 2018 to 2022 and Forecast 2023 to 2033, By End Use 7.1. Introduction / Key Findings 7.2. Historical Market Size Value (US$ Million) & Volume (Units) Analysis By End Use, 2018 to 2022 7.3. Current and Future Market Size Value (US$ Million) & Volume (Units) Analysis and Forecast By End Use, 2023 to 2033 7.3.1. Food & Beverages 7.3.1.1. Fruits & Vegetables 7.3.1.2. Dairy Products 7.3.1.3. Meat, Poultry & Seafood 7.3.1.4. Others 7.3.2. Pharmaceuticals & Medical Devices 7.3.3. Automotive 7.3.4. Building and Construction 7.3.5. Logistics and Transportation 7.4. Y-o-Y Growth Trend Analysis By End Use, 2018 to 2022 7.5. Absolute $ Opportunity Analysis By End Use, 2023 to 2033 8. Global Market Analysis 2018 to 2022 and Forecast 2023 to 2033, By Region 8.1. Introduction 8.2. Historical Market Size Value (US$ Million) & Volume (Units) Analysis By Region, 2018 to 2022 8.3. Current Market Size Value (US$ Million) & Volume (Units) Analysis and Forecast By Region, 2023 to 2033 8.3.1. North America 8.3.2. Latin America 8.3.3. Western Europe 8.3.4. Eastern Europe 8.3.5. South Asia and Pacific 8.3.6. East Asia 8.3.7. Middle East and Africa 8.4. Market Attractiveness Analysis By Region 9. North America Market Analysis 2018 to 2022 and Forecast 2023 to 2033, By Country 9.1. Historical Market Size Value (US$ Million) & Volume (Units) Trend Analysis By Market Taxonomy, 2018 to 2022 9.2. Market Size Value (US$ Million) & Volume (Units) Forecast By Market Taxonomy, 2023 to 2033 9.2.1. By Country 9.2.1.1. USA 9.2.1.2. Canada 9.2.2. By Material Type 9.2.3. By Product Type 9.2.4. By End Use 9.3. Market Attractiveness Analysis 9.3.1. By Country 9.3.2. By Material Type 9.3.3. By Product Type 9.3.4. By End Use 9.4. Key Takeaways 10. Latin America Market Analysis 2018 to 2022 and Forecast 2023 to 2033, By Country 10.1. Historical Market Size Value (US$ Million) & Volume (Units) Trend Analysis By Market Taxonomy, 2018 to 2022 10.2. Market Size Value (US$ Million) & Volume (Units) Forecast By Market Taxonomy, 2023 to 2033 10.2.1. By Country 10.2.1.1. Brazil 10.2.1.2. Mexico 10.2.1.3. Rest of Latin America 10.2.2. By Material Type 10.2.3. By Product Type 10.2.4. By End Use 10.3. Market Attractiveness Analysis 10.3.1. By Country 10.3.2. By Material Type 10.3.3. By Product Type 10.3.4. By End Use 10.4. Key Takeaways 11. Western Europe Market Analysis 2018 to 2022 and Forecast 2023 to 2033, By Country 11.1. Historical Market Size Value (US$ Million) & Volume (Units) Trend Analysis By Market Taxonomy, 2018 to 2022 11.2. Market Size Value (US$ Million) & Volume (Units) Forecast By Market Taxonomy, 2023 to 2033 11.2.1. By Country 11.2.1.1. Germany 11.2.1.2. UK 11.2.1.3. France 11.2.1.4. Spain 11.2.1.5. Italy 11.2.1.6. Rest of Western Europe 11.2.2. By Material Type 11.2.3. By Product Type 11.2.4. By End Use 11.3. Market Attractiveness Analysis 11.3.1. By Country 11.3.2. By Material Type 11.3.3. By Product Type 11.3.4. By End Use 11.4. Key Takeaways 12. Eastern Europe Market Analysis 2018 to 2022 and Forecast 2023 to 2033, By Country 12.1. Historical Market Size Value (US$ Million) & Volume (Units) Trend Analysis By Market Taxonomy, 2018 to 2022 12.2. Market Size Value (US$ Million) & Volume (Units) Forecast By Market Taxonomy, 2023 to 2033 12.2.1. By Country 12.2.1.1. Poland 12.2.1.2. Russia 12.2.1.3. Czech Republic 12.2.1.4. Romania 12.2.1.5. Rest of Eastern Europe 12.2.2. By Material Type 12.2.3. By Product Type 12.2.4. By End Use 12.3. Market Attractiveness Analysis 12.3.1. By Country 12.3.2. By Material Type 12.3.3. By Product Type 12.3.4. By End Use 12.4. Key Takeaways 13. South Asia and Pacific Market Analysis 2018 to 2022 and Forecast 2023 to 2033, By Country 13.1. Historical Market Size Value (US$ Million) & Volume (Units) Trend Analysis By Market Taxonomy, 2018 to 2022 13.2. Market Size Value (US$ Million) & Volume (Units) Forecast By Market Taxonomy, 2023 to 2033 13.2.1. By Country 13.2.1.1. India 13.2.1.2. Bangladesh 13.2.1.3. Australia 13.2.1.4. New Zealand 13.2.1.5. Rest of South Asia and Pacific 13.2.2. By Material Type 13.2.3. By Product Type 13.2.4. By End Use 13.3. Market Attractiveness Analysis 13.3.1. By Country 13.3.2. By Material Type 13.3.3. By Product Type 13.3.4. By End Use 13.4. Key Takeaways 14. East Asia Market Analysis 2018 to 2022 and Forecast 2023 to 2033, By Country 14.1. Historical Market Size Value (US$ Million) & Volume (Units) Trend Analysis By Market Taxonomy, 2018 to 2022 14.2. Market Size Value (US$ Million) & Volume (Units) Forecast By Market Taxonomy, 2023 to 2033 14.2.1. By Country 14.2.1.1. China 14.2.1.2. Japan 14.2.1.3. South Korea 14.2.2. By Material Type 14.2.3. By Product Type 14.2.4. By End Use 14.3. Market Attractiveness Analysis 14.3.1. By Country 14.3.2. By Material Type 14.3.3. By Product Type 14.3.4. By End Use 14.4. Key Takeaways 15. Middle East and Africa Market Analysis 2018 to 2022 and Forecast 2023 to 2033, By Country 15.1. Historical Market Size Value (US$ Million) & Volume (Units) Trend Analysis By Market Taxonomy, 2018 to 2022 15.2. Market Size Value (US$ Million) & Volume (Units) Forecast By Market Taxonomy, 2023 to 2033 15.2.1. By Country 15.2.1.1. GCC Countries 15.2.1.2. South Africa 15.2.1.3. Israel 15.2.1.4. Rest of MEA 15.2.2. By Material Type 15.2.3. By Product Type 15.2.4. By End Use 15.3. Market Attractiveness Analysis 15.3.1. By Country 15.3.2. By Material Type 15.3.3. By Product Type 15.3.4. By End Use 15.4. Key Takeaways 16. Key Countries Market Analysis 16.1. USA 16.1.1. Pricing Analysis 16.1.2. Market Share Analysis, 2022 16.1.2.1. By Material Type 16.1.2.2. By Product Type 16.1.2.3. By End Use 16.2. Canada 16.2.1. Pricing Analysis 16.2.2. Market Share Analysis, 2022 16.2.2.1. By Material Type 16.2.2.2. By Product Type 16.2.2.3. By End Use 16.3. Brazil 16.3.1. Pricing Analysis 16.3.2. Market Share Analysis, 2022 16.3.2.1. By Material Type 16.3.2.2. By Product Type 16.3.2.3. By End Use 16.4. Mexico 16.4.1. Pricing Analysis 16.4.2. Market Share Analysis, 2022 16.4.2.1. By Material Type 16.4.2.2. By Product Type 16.4.2.3. By End Use 16.5. Germany 16.5.1. Pricing Analysis 16.5.2. Market Share Analysis, 2022 16.5.2.1. By Material Type 16.5.2.2. By Product Type 16.5.2.3. By End Use 16.6. UK 16.6.1. Pricing Analysis 16.6.2. Market Share Analysis, 2022 16.6.2.1. By Material Type 16.6.2.2. By Product Type 16.6.2.3. By End Use 16.7. France 16.7.1. Pricing Analysis 16.7.2. Market Share Analysis, 2022 16.7.2.1. By Material Type 16.7.2.2. By Product Type 16.7.2.3. By End Use 16.8. Spain 16.8.1. Pricing Analysis 16.8.2. Market Share Analysis, 2022 16.8.2.1. By Material Type 16.8.2.2. By Product Type 16.8.2.3. By End Use 16.9. Italy 16.9.1. Pricing Analysis 16.9.2. Market Share Analysis, 2022 16.9.2.1. By Material Type 16.9.2.2. By Product Type 16.9.2.3. By End Use 16.10. Poland 16.10.1. Pricing Analysis 16.10.2. Market Share Analysis, 2022 16.10.2.1. By Material Type 16.10.2.2. By Product Type 16.10.2.3. By End Use 16.11. Russia 16.11.1. Pricing Analysis 16.11.2. Market Share Analysis, 2022 16.11.2.1. By Material Type 16.11.2.2. By Product Type 16.11.2.3. By End Use 16.12. Czech Republic 16.12.1. Pricing Analysis 16.12.2. Market Share Analysis, 2022 16.12.2.1. By Material Type 16.12.2.2. By Product Type 16.12.2.3. By End Use 16.13. Romania 16.13.1. Pricing Analysis 16.13.2. Market Share Analysis, 2022 16.13.2.1. By Material Type 16.13.2.2. By Product Type 16.13.2.3. By End Use 16.14. India 16.14.1. Pricing Analysis 16.14.2. Market Share Analysis, 2022 16.14.2.1. By Material Type 16.14.2.2. By Product Type 16.14.2.3. By End Use 16.15. Bangladesh 16.15.1. Pricing Analysis 16.15.2. Market Share Analysis, 2022 16.15.2.1. By Material Type 16.15.2.2. By Product Type 16.15.2.3. By End Use 16.16. Australia 16.16.1. Pricing Analysis 16.16.2. Market Share Analysis, 2022 16.16.2.1. By Material Type 16.16.2.2. By Product Type 16.16.2.3. By End Use 16.17. New Zealand 16.17.1. Pricing Analysis 16.17.2. Market Share Analysis, 2022 16.17.2.1. By Material Type 16.17.2.2. By Product Type 16.17.2.3. By End Use 16.18. China 16.18.1. Pricing Analysis 16.18.2. Market Share Analysis, 2022 16.18.2.1. By Material Type 16.18.2.2. By Product Type 16.18.2.3. By End Use 16.19. Japan 16.19.1. Pricing Analysis 16.19.2. Market Share Analysis, 2022 16.19.2.1. By Material Type 16.19.2.2. By Product Type 16.19.2.3. By End Use 16.20. South Korea 16.20.1. Pricing Analysis 16.20.2. Market Share Analysis, 2022 16.20.2.1. By Material Type 16.20.2.2. By Product Type 16.20.2.3. By End Use 16.21. GCC Countries 16.21.1. Pricing Analysis 16.21.2. Market Share Analysis, 2022 16.21.2.1. By Material Type 16.21.2.2. By Product Type 16.21.2.3. By End Use 16.22. South Africa 16.22.1. Pricing Analysis 16.22.2. Market Share Analysis, 2022 16.22.2.1. By Material Type 16.22.2.2. By Product Type 16.22.2.3. By End Use 16.23. Israel 16.23.1. Pricing Analysis 16.23.2. Market Share Analysis, 2022 16.23.2.1. By Material Type 16.23.2.2. By Product Type 16.23.2.3. By End Use 17. Market Structure Analysis 17.1. Competition Dashboard 17.2. Competition Benchmarking 17.3. Market Share Analysis of Top Players 17.3.1. By Regional 17.3.2. By Material Type 17.3.3. By Product Type 17.3.4. By End Use 18. Competition Analysis 18.1. Competition Deep Dive 18.1.1. Brambles Limited 18.1.1.1. Overview 18.1.1.2. Product Portfolio 18.1.1.3. Profitability by Market Segments 18.1.1.4. Sales Footprint 18.1.1.5. Strategy Overview 18.1.1.5.1. Marketing Strategy 18.1.1.5.2. Product Strategy 18.1.1.5.3. Channel Strategy 18.1.2. Schoeller Allibert AB 18.1.2.1. Overview 18.1.2.2. Product Portfolio 18.1.2.3. Profitability by Market Segments 18.1.2.4. Sales Footprint 18.1.2.5. Strategy Overview 18.1.2.5.1. Marketing Strategy 18.1.2.5.2. Product Strategy 18.1.2.5.3. Channel Strategy 18.1.3. NEFAB GROUP 18.1.3.1. Overview 18.1.3.2. Product Portfolio 18.1.3.3. Profitability by Market Segments 18.1.3.4. Sales Footprint 18.1.3.5. Strategy Overview 18.1.3.5.1. Marketing Strategy 18.1.3.5.2. Product Strategy 18.1.3.5.3. Channel Strategy 18.1.4. IFCO Systems 18.1.4.1. Overview 18.1.4.2. Product Portfolio 18.1.4.3. Profitability by Market Segments 18.1.4.4. Sales Footprint 18.1.4.5. Strategy Overview 18.1.4.5.1. Marketing Strategy 18.1.4.5.2. Product Strategy 18.1.4.5.3. Channel Strategy 18.1.5. Myers Industries, Inc 18.1.5.1. Overview 18.1.5.2. Product Portfolio 18.1.5.3. Profitability by Market Segments 18.1.5.4. Sales Footprint 18.1.5.5. Strategy Overview 18.1.5.5.1. Marketing Strategy 18.1.5.5.2. Product Strategy 18.1.5.5.3. Channel Strategy 18.1.6. DS Smith PLC 18.1.6.1. Overview 18.1.6.2. Product Portfolio 18.1.6.3. Profitability by Market Segments 18.1.6.4. Sales Footprint 18.1.6.5. Strategy Overview 18.1.6.5.1. Marketing Strategy 18.1.6.5.2. Product Strategy 18.1.6.5.3. Channel Strategy 18.1.7. Dynawest Limited 18.1.7.1. Overview 18.1.7.2. Product Portfolio 18.1.7.3. Profitability by Market Segments 18.1.7.4. Sales Footprint 18.1.7.5. Strategy Overview 18.1.7.5.1. Marketing Strategy 18.1.7.5.2. Product Strategy 18.1.7.5.3. Channel Strategy 18.1.8. Craemer UK Ltd 18.1.8.1. Overview 18.1.8.2. Product Portfolio 18.1.8.3. Profitability by Market Segments 18.1.8.4. Sales Footprint 18.1.8.5. Strategy Overview 18.1.8.5.1. Marketing Strategy 18.1.8.5.2. Product Strategy 18.1.8.5.3. Channel Strategy 18.1.9. SABIC 18.1.9.1. Overview 18.1.9.2. Product Portfolio 18.1.9.3. Profitability by Market Segments 18.1.9.4. Sales Footprint 18.1.9.5. Strategy Overview 18.1.9.5.1. Marketing Strategy 18.1.9.5.2. Product Strategy 18.1.9.5.3. Channel Strategy 18.1.10. Supreme Industries Limited 18.1.10.1. Overview 18.1.10.2. Product Portfolio 18.1.10.3. Profitability by Market Segments 18.1.10.4. Sales Footprint 18.1.10.5. Strategy Overview 18.1.10.5.1. Marketing Strategy 18.1.10.5.2. Product Strategy 18.1.10.5.3. Channel Strategy 18.1.11. Rehrig Pacific Company, Inc 18.1.11.1. Overview 18.1.11.2. Product Portfolio 18.1.11.3. Profitability by Market Segments 18.1.11.4. Sales Footprint 18.1.11.5. Strategy Overview 18.1.11.5.1. Marketing Strategy 18.1.11.5.2. Product Strategy 18.1.11.5.3. Channel Strategy 19. Assumptions & Acronyms Used 20. Research Methodology
Don't pay for what you don't need
Customize your report by selecting specific countries or regions and save 30%!
Table 1: Global Market Value (US$ Million) Forecast by Region, 2018 to 2033 Table 2: Global Market Volume (Units) Forecast by Region, 2018 to 2033 Table 3: Global Market Value (US$ Million) Forecast by Material Type, 2018 to 2033 Table 4: Global Market Volume (Units) Forecast by Material Type, 2018 to 2033 Table 5: Global Market Value (US$ Million) Forecast by Product Type, 2018 to 2033 Table 6: Global Market Volume (Units) Forecast by Product Type, 2018 to 2033 Table 7: Global Market Value (US$ Million) Forecast by End Use, 2018 to 2033 Table 8: Global Market Volume (Units) Forecast by End Use, 2018 to 2033 Table 9: North America Market Value (US$ Million) Forecast by Country, 2018 to 2033 Table 10: North America Market Volume (Units) Forecast by Country, 2018 to 2033 Table 11: North America Market Value (US$ Million) Forecast by Material Type, 2018 to 2033 Table 12: North America Market Volume (Units) Forecast by Material Type, 2018 to 2033 Table 13: North America Market Value (US$ Million) Forecast by Product Type, 2018 to 2033 Table 14: North America Market Volume (Units) Forecast by Product Type, 2018 to 2033 Table 15: North America Market Value (US$ Million) Forecast by End Use, 2018 to 2033 Table 16: North America Market Volume (Units) Forecast by End Use, 2018 to 2033 Table 17: Latin America Market Value (US$ Million) Forecast by Country, 2018 to 2033 Table 18: Latin America Market Volume (Units) Forecast by Country, 2018 to 2033 Table 19: Latin America Market Value (US$ Million) Forecast by Material Type, 2018 to 2033 Table 20: Latin America Market Volume (Units) Forecast by Material Type, 2018 to 2033 Table 21: Latin America Market Value (US$ Million) Forecast by Product Type, 2018 to 2033 Table 22: Latin America Market Volume (Units) Forecast by Product Type, 2018 to 2033 Table 23: Latin America Market Value (US$ Million) Forecast by End Use, 2018 to 2033 Table 24: Latin America Market Volume (Units) Forecast by End Use, 2018 to 2033 Table 25: Western Europe Market Value (US$ Million) Forecast by Country, 2018 to 2033 Table 26: Western Europe Market Volume (Units) Forecast by Country, 2018 to 2033 Table 27: Western Europe Market Value (US$ Million) Forecast by Material Type, 2018 to 2033 Table 28: Western Europe Market Volume (Units) Forecast by Material Type, 2018 to 2033 Table 29: Western Europe Market Value (US$ Million) Forecast by Product Type, 2018 to 2033 Table 30: Western Europe Market Volume (Units) Forecast by Product Type, 2018 to 2033 Table 31: Western Europe Market Value (US$ Million) Forecast by End Use, 2018 to 2033 Table 32: Western Europe Market Volume (Units) Forecast by End Use, 2018 to 2033 Table 33: Eastern Europe Market Value (US$ Million) Forecast by Country, 2018 to 2033 Table 34: Eastern Europe Market Volume (Units) Forecast by Country, 2018 to 2033 Table 35: Eastern Europe Market Value (US$ Million) Forecast by Material Type, 2018 to 2033 Table 36: Eastern Europe Market Volume (Units) Forecast by Material Type, 2018 to 2033 Table 37: Eastern Europe Market Value (US$ Million) Forecast by Product Type, 2018 to 2033 Table 38: Eastern Europe Market Volume (Units) Forecast by Product Type, 2018 to 2033 Table 39: Eastern Europe Market Value (US$ Million) Forecast by End Use, 2018 to 2033 Table 40: Eastern Europe Market Volume (Units) Forecast by End Use, 2018 to 2033 Table 41: South Asia and Pacific Market Value (US$ Million) Forecast by Country, 2018 to 2033 Table 42: South Asia and Pacific Market Volume (Units) Forecast by Country, 2018 to 2033 Table 43: South Asia and Pacific Market Value (US$ Million) Forecast by Material Type, 2018 to 2033 Table 44: South Asia and Pacific Market Volume (Units) Forecast by Material Type, 2018 to 2033 Table 45: South Asia and Pacific Market Value (US$ Million) Forecast by Product Type, 2018 to 2033 Table 46: South Asia and Pacific Market Volume (Units) Forecast by Product Type, 2018 to 2033 Table 47: South Asia and Pacific Market Value (US$ Million) Forecast by End Use, 2018 to 2033 Table 48: South Asia and Pacific Market Volume (Units) Forecast by End Use, 2018 to 2033 Table 49: East Asia Market Value (US$ Million) Forecast by Country, 2018 to 2033 Table 50: East Asia Market Volume (Units) Forecast by Country, 2018 to 2033 Table 51: East Asia Market Value (US$ Million) Forecast by Material Type, 2018 to 2033 Table 52: East Asia Market Volume (Units) Forecast by Material Type, 2018 to 2033 Table 53: East Asia Market Value (US$ Million) Forecast by Product Type, 2018 to 2033 Table 54: East Asia Market Volume (Units) Forecast by Product Type, 2018 to 2033 Table 55: East Asia Market Value (US$ Million) Forecast by End Use, 2018 to 2033 Table 56: East Asia Market Volume (Units) Forecast by End Use, 2018 to 2033 Table 57: Middle East and Africa Market Value (US$ Million) Forecast by Country, 2018 to 2033 Table 58: Middle East and Africa Market Volume (Units) Forecast by Country, 2018 to 2033 Table 59: Middle East and Africa Market Value (US$ Million) Forecast by Material Type, 2018 to 2033 Table 60: Middle East and Africa Market Volume (Units) Forecast by Material Type, 2018 to 2033 Table 61: Middle East and Africa Market Value (US$ Million) Forecast by Product Type, 2018 to 2033 Table 62: Middle East and Africa Market Volume (Units) Forecast by Product Type, 2018 to 2033 Table 63: Middle East and Africa Market Value (US$ Million) Forecast by End Use, 2018 to 2033 Table 64: Middle East and Africa Market Volume (Units) Forecast by End Use, 2018 to 2033
Figure 1: Global Market Value (US$ Million) by Material Type, 2023 to 2033 Figure 2: Global Market Value (US$ Million) by Product Type, 2023 to 2033 Figure 3: Global Market Value (US$ Million) by End Use, 2023 to 2033 Figure 4: Global Market Value (US$ Million) by Region, 2023 to 2033 Figure 5: Global Market Value (US$ Million) Analysis by Region, 2018 to 2033 Figure 6: Global Market Volume (Units) Analysis by Region, 2018 to 2033 Figure 7: Global Market Value Share (%) and BPS Analysis by Region, 2023 to 2033 Figure 8: Global Market Y-o-Y Growth (%) Projections by Region, 2023 to 2033 Figure 9: Global Market Value (US$ Million) Analysis by Material Type, 2018 to 2033 Figure 10: Global Market Volume (Units) Analysis by Material Type, 2018 to 2033 Figure 11: Global Market Value Share (%) and BPS Analysis by Material Type, 2023 to 2033 Figure 12: Global Market Y-o-Y Growth (%) Projections by Material Type, 2023 to 2033 Figure 13: Global Market Value (US$ Million) Analysis by Product Type, 2018 to 2033 Figure 14: Global Market Volume (Units) Analysis by Product Type, 2018 to 2033 Figure 15: Global Market Value Share (%) and BPS Analysis by Product Type, 2023 to 2033 Figure 16: Global Market Y-o-Y Growth (%) Projections by Product Type, 2023 to 2033 Figure 17: Global Market Value (US$ Million) Analysis by End Use, 2018 to 2033 Figure 18: Global Market Volume (Units) Analysis by End Use, 2018 to 2033 Figure 19: Global Market Value Share (%) and BPS Analysis by End Use, 2023 to 2033 Figure 20: Global Market Y-o-Y Growth (%) Projections by End Use, 2023 to 2033 Figure 21: Global Market Attractiveness by Material Type, 2023 to 2033 Figure 22: Global Market Attractiveness by Product Type, 2023 to 2033 Figure 23: Global Market Attractiveness by End Use, 2023 to 2033 Figure 24: Global Market Attractiveness by Region, 2023 to 2033 Figure 25: North America Market Value (US$ Million) by Material Type, 2023 to 2033 Figure 26: North America Market Value (US$ Million) by Product Type, 2023 to 2033 Figure 27: North America Market Value (US$ Million) by End Use, 2023 to 2033 Figure 28: North America Market Value (US$ Million) by Country, 2023 to 2033 Figure 29: North America Market Value (US$ Million) Analysis by Country, 2018 to 2033 Figure 30: North America Market Volume (Units) Analysis by Country, 2018 to 2033 Figure 31: North America Market Value Share (%) and BPS Analysis by Country, 2023 to 2033 Figure 32: North America Market Y-o-Y Growth (%) Projections by Country, 2023 to 2033 Figure 33: North America Market Value (US$ Million) Analysis by Material Type, 2018 to 2033 Figure 34: North America Market Volume (Units) Analysis by Material Type, 2018 to 2033 Figure 35: North America Market Value Share (%) and BPS Analysis by Material Type, 2023 to 2033 Figure 36: North America Market Y-o-Y Growth (%) Projections by Material Type, 2023 to 2033 Figure 37: North America Market Value (US$ Million) Analysis by Product Type, 2018 to 2033 Figure 38: North America Market Volume (Units) Analysis by Product Type, 2018 to 2033 Figure 39: North America Market Value Share (%) and BPS Analysis by Product Type, 2023 to 2033 Figure 40: North America Market Y-o-Y Growth (%) Projections by Product Type, 2023 to 2033 Figure 41: North America Market Value (US$ Million) Analysis by End Use, 2018 to 2033 Figure 42: North America Market Volume (Units) Analysis by End Use, 2018 to 2033 Figure 43: North America Market Value Share (%) and BPS Analysis by End Use, 2023 to 2033 Figure 44: North America Market Y-o-Y Growth (%) Projections by End Use, 2023 to 2033 Figure 45: North America Market Attractiveness by Material Type, 2023 to 2033 Figure 46: North America Market Attractiveness by Product Type, 2023 to 2033 Figure 47: North America Market Attractiveness by End Use, 2023 to 2033 Figure 48: North America Market Attractiveness by Country, 2023 to 2033 Figure 49: Latin America Market Value (US$ Million) by Material Type, 2023 to 2033 Figure 50: Latin America Market Value (US$ Million) by Product Type, 2023 to 2033 Figure 51: Latin America Market Value (US$ Million) by End Use, 2023 to 2033 Figure 52: Latin America Market Value (US$ Million) by Country, 2023 to 2033 Figure 53: Latin America Market Value (US$ Million) Analysis by Country, 2018 to 2033 Figure 54: Latin America Market Volume (Units) Analysis by Country, 2018 to 2033 Figure 55: Latin America Market Value Share (%) and BPS Analysis by Country, 2023 to 2033 Figure 56: Latin America Market Y-o-Y Growth (%) Projections by Country, 2023 to 2033 Figure 57: Latin America Market Value (US$ Million) Analysis by Material Type, 2018 to 2033 Figure 58: Latin America Market Volume (Units) Analysis by Material Type, 2018 to 2033 Figure 59: Latin America Market Value Share (%) and BPS Analysis by Material Type, 2023 to 2033 Figure 60: Latin America Market Y-o-Y Growth (%) Projections by Material Type, 2023 to 2033 Figure 61: Latin America Market Value (US$ Million) Analysis by Product Type, 2018 to 2033 Figure 62: Latin America Market Volume (Units) Analysis by Product Type, 2018 to 2033 Figure 63: Latin America Market Value Share (%) and BPS Analysis by Product Type, 2023 to 2033 Figure 64: Latin America Market Y-o-Y Growth (%) Projections by Product Type, 2023 to 2033 Figure 65: Latin America Market Value (US$ Million) Analysis by End Use, 2018 to 2033 Figure 66: Latin America Market Volume (Units) Analysis by End Use, 2018 to 2033 Figure 67: Latin America Market Value Share (%) and BPS Analysis by End Use, 2023 to 2033 Figure 68: Latin America Market Y-o-Y Growth (%) Projections by End Use, 2023 to 2033 Figure 69: Latin America Market Attractiveness by Material Type, 2023 to 2033 Figure 70: Latin America Market Attractiveness by Product Type, 2023 to 2033 Figure 71: Latin America Market Attractiveness by End Use, 2023 to 2033 Figure 72: Latin America Market Attractiveness by Country, 2023 to 2033 Figure 73: Western Europe Market Value (US$ Million) by Material Type, 2023 to 2033 Figure 74: Western Europe Market Value (US$ Million) by Product Type, 2023 to 2033 Figure 75: Western Europe Market Value (US$ Million) by End Use, 2023 to 2033 Figure 76: Western Europe Market Value (US$ Million) by Country, 2023 to 2033 Figure 77: Western Europe Market Value (US$ Million) Analysis by Country, 2018 to 2033 Figure 78: Western Europe Market Volume (Units) Analysis by Country, 2018 to 2033 Figure 79: Western Europe Market Value Share (%) and BPS Analysis by Country, 2023 to 2033 Figure 80: Western Europe Market Y-o-Y Growth (%) Projections by Country, 2023 to 2033 Figure 81: Western Europe Market Value (US$ Million) Analysis by Material Type, 2018 to 2033 Figure 82: Western Europe Market Volume (Units) Analysis by Material Type, 2018 to 2033 Figure 83: Western Europe Market Value Share (%) and BPS Analysis by Material Type, 2023 to 2033 Figure 84: Western Europe Market Y-o-Y Growth (%) Projections by Material Type, 2023 to 2033 Figure 85: Western Europe Market Value (US$ Million) Analysis by Product Type, 2018 to 2033 Figure 86: Western Europe Market Volume (Units) Analysis by Product Type, 2018 to 2033 Figure 87: Western Europe Market Value Share (%) and BPS Analysis by Product Type, 2023 to 2033 Figure 88: Western Europe Market Y-o-Y Growth (%) Projections by Product Type, 2023 to 2033 Figure 89: Western Europe Market Value (US$ Million) Analysis by End Use, 2018 to 2033 Figure 90: Western Europe Market Volume (Units) Analysis by End Use, 2018 to 2033 Figure 91: Western Europe Market Value Share (%) and BPS Analysis by End Use, 2023 to 2033 Figure 92: Western Europe Market Y-o-Y Growth (%) Projections by End Use, 2023 to 2033 Figure 93: Western Europe Market Attractiveness by Material Type, 2023 to 2033 Figure 94: Western Europe Market Attractiveness by Product Type, 2023 to 2033 Figure 95: Western Europe Market Attractiveness by End Use, 2023 to 2033 Figure 96: Western Europe Market Attractiveness by Country, 2023 to 2033 Figure 97: Eastern Europe Market Value (US$ Million) by Material Type, 2023 to 2033 Figure 98: Eastern Europe Market Value (US$ Million) by Product Type, 2023 to 2033 Figure 99: Eastern Europe Market Value (US$ Million) by End Use, 2023 to 2033 Figure 100: Eastern Europe Market Value (US$ Million) by Country, 2023 to 2033 Figure 101: Eastern Europe Market Value (US$ Million) Analysis by Country, 2018 to 2033 Figure 102: Eastern Europe Market Volume (Units) Analysis by Country, 2018 to 2033 Figure 103: Eastern Europe Market Value Share (%) and BPS Analysis by Country, 2023 to 2033 Figure 104: Eastern Europe Market Y-o-Y Growth (%) Projections by Country, 2023 to 2033 Figure 105: Eastern Europe Market Value (US$ Million) Analysis by Material Type, 2018 to 2033 Figure 106: Eastern Europe Market Volume (Units) Analysis by Material Type, 2018 to 2033 Figure 107: Eastern Europe Market Value Share (%) and BPS Analysis by Material Type, 2023 to 2033 Figure 108: Eastern Europe Market Y-o-Y Growth (%) Projections by Material Type, 2023 to 2033 Figure 109: Eastern Europe Market Value (US$ Million) Analysis by Product Type, 2018 to 2033 Figure 110: Eastern Europe Market Volume (Units) Analysis by Product Type, 2018 to 2033 Figure 111: Eastern Europe Market Value Share (%) and BPS Analysis by Product Type, 2023 to 2033 Figure 112: Eastern Europe Market Y-o-Y Growth (%) Projections by Product Type, 2023 to 2033 Figure 113: Eastern Europe Market Value (US$ Million) Analysis by End Use, 2018 to 2033 Figure 114: Eastern Europe Market Volume (Units) Analysis by End Use, 2018 to 2033 Figure 115: Eastern Europe Market Value Share (%) and BPS Analysis by End Use, 2023 to 2033 Figure 116: Eastern Europe Market Y-o-Y Growth (%) Projections by End Use, 2023 to 2033 Figure 117: Eastern Europe Market Attractiveness by Material Type, 2023 to 2033 Figure 118: Eastern Europe Market Attractiveness by Product Type, 2023 to 2033 Figure 119: Eastern Europe Market Attractiveness by End Use, 2023 to 2033 Figure 120: Eastern Europe Market Attractiveness by Country, 2023 to 2033 Figure 121: South Asia and Pacific Market Value (US$ Million) by Material Type, 2023 to 2033 Figure 122: South Asia and Pacific Market Value (US$ Million) by Product Type, 2023 to 2033 Figure 123: South Asia and Pacific Market Value (US$ Million) by End Use, 2023 to 2033 Figure 124: South Asia and Pacific Market Value (US$ Million) by Country, 2023 to 2033 Figure 125: South Asia and Pacific Market Value (US$ Million) Analysis by Country, 2018 to 2033 Figure 126: South Asia and Pacific Market Volume (Units) Analysis by Country, 2018 to 2033 Figure 127: South Asia and Pacific Market Value Share (%) and BPS Analysis by Country, 2023 to 2033 Figure 128: South Asia and Pacific Market Y-o-Y Growth (%) Projections by Country, 2023 to 2033 Figure 129: South Asia and Pacific Market Value (US$ Million) Analysis by Material Type, 2018 to 2033 Figure 130: South Asia and Pacific Market Volume (Units) Analysis by Material Type, 2018 to 2033 Figure 131: South Asia and Pacific Market Value Share (%) and BPS Analysis by Material Type, 2023 to 2033 Figure 132: South Asia and Pacific Market Y-o-Y Growth (%) Projections by Material Type, 2023 to 2033 Figure 133: South Asia and Pacific Market Value (US$ Million) Analysis by Product Type, 2018 to 2033 Figure 134: South Asia and Pacific Market Volume (Units) Analysis by Product Type, 2018 to 2033 Figure 135: South Asia and Pacific Market Value Share (%) and BPS Analysis by Product Type, 2023 to 2033 Figure 136: South Asia and Pacific Market Y-o-Y Growth (%) Projections by Product Type, 2023 to 2033 Figure 137: South Asia and Pacific Market Value (US$ Million) Analysis by End Use, 2018 to 2033 Figure 138: South Asia and Pacific Market Volume (Units) Analysis by End Use, 2018 to 2033 Figure 139: South Asia and Pacific Market Value Share (%) and BPS Analysis by End Use, 2023 to 2033 Figure 140: South Asia and Pacific Market Y-o-Y Growth (%) Projections by End Use, 2023 to 2033 Figure 141: South Asia and Pacific Market Attractiveness by Material Type, 2023 to 2033 Figure 142: South Asia and Pacific Market Attractiveness by Product Type, 2023 to 2033 Figure 143: South Asia and Pacific Market Attractiveness by End Use, 2023 to 2033 Figure 144: South Asia and Pacific Market Attractiveness by Country, 2023 to 2033 Figure 145: East Asia Market Value (US$ Million) by Material Type, 2023 to 2033 Figure 146: East Asia Market Value (US$ Million) by Product Type, 2023 to 2033 Figure 147: East Asia Market Value (US$ Million) by End Use, 2023 to 2033 Figure 148: East Asia Market Value (US$ Million) by Country, 2023 to 2033 Figure 149: East Asia Market Value (US$ Million) Analysis by Country, 2018 to 2033 Figure 150: East Asia Market Volume (Units) Analysis by Country, 2018 to 2033 Figure 151: East Asia Market Value Share (%) and BPS Analysis by Country, 2023 to 2033 Figure 152: East Asia Market Y-o-Y Growth (%) Projections by Country, 2023 to 2033 Figure 153: East Asia Market Value (US$ Million) Analysis by Material Type, 2018 to 2033 Figure 154: East Asia Market Volume (Units) Analysis by Material Type, 2018 to 2033 Figure 155: East Asia Market Value Share (%) and BPS Analysis by Material Type, 2023 to 2033 Figure 156: East Asia Market Y-o-Y Growth (%) Projections by Material Type, 2023 to 2033 Figure 157: East Asia Market Value (US$ Million) Analysis by Product Type, 2018 to 2033 Figure 158: East Asia Market Volume (Units) Analysis by Product Type, 2018 to 2033 Figure 159: East Asia Market Value Share (%) and BPS Analysis by Product Type, 2023 to 2033 Figure 160: East Asia Market Y-o-Y Growth (%) Projections by Product Type, 2023 to 2033 Figure 161: East Asia Market Value (US$ Million) Analysis by End Use, 2018 to 2033 Figure 162: East Asia Market Volume (Units) Analysis by End Use, 2018 to 2033 Figure 163: East Asia Market Value Share (%) and BPS Analysis by End Use, 2023 to 2033 Figure 164: East Asia Market Y-o-Y Growth (%) Projections by End Use, 2023 to 2033 Figure 165: East Asia Market Attractiveness by Material Type, 2023 to 2033 Figure 166: East Asia Market Attractiveness by Product Type, 2023 to 2033 Figure 167: East Asia Market Attractiveness by End Use, 2023 to 2033 Figure 168: East Asia Market Attractiveness by Country, 2023 to 2033 Figure 169: Middle East and Africa Market Value (US$ Million) by Material Type, 2023 to 2033 Figure 170: Middle East and Africa Market Value (US$ Million) by Product Type, 2023 to 2033 Figure 171: Middle East and Africa Market Value (US$ Million) by End Use, 2023 to 2033 Figure 172: Middle East and Africa Market Value (US$ Million) by Country, 2023 to 2033 Figure 173: Middle East and Africa Market Value (US$ Million) Analysis by Country, 2018 to 2033 Figure 174: Middle East and Africa Market Volume (Units) Analysis by Country, 2018 to 2033 Figure 175: Middle East and Africa Market Value Share (%) and BPS Analysis by Country, 2023 to 2033 Figure 176: Middle East and Africa Market Y-o-Y Growth (%) Projections by Country, 2023 to 2033 Figure 177: Middle East and Africa Market Value (US$ Million) Analysis by Material Type, 2018 to 2033 Figure 178: Middle East and Africa Market Volume (Units) Analysis by Material Type, 2018 to 2033 Figure 179: Middle East and Africa Market Value Share (%) and BPS Analysis by Material Type, 2023 to 2033 Figure 180: Middle East and Africa Market Y-o-Y Growth (%) Projections by Material Type, 2023 to 2033 Figure 181: Middle East and Africa Market Value (US$ Million) Analysis by Product Type, 2018 to 2033 Figure 182: Middle East and Africa Market Volume (Units) Analysis by Product Type, 2018 to 2033 Figure 183: Middle East and Africa Market Value Share (%) and BPS Analysis by Product Type, 2023 to 2033 Figure 184: Middle East and Africa Market Y-o-Y Growth (%) Projections by Product Type, 2023 to 2033 Figure 185: Middle East and Africa Market Value (US$ Million) Analysis by End Use, 2018 to 2033 Figure 186: Middle East and Africa Market Volume (Units) Analysis by End Use, 2018 to 2033 Figure 187: Middle East and Africa Market Value Share (%) and BPS Analysis by End Use, 2023 to 2033 Figure 188: Middle East and Africa Market Y-o-Y Growth (%) Projections by End Use, 2023 to 2033 Figure 189: Middle East and Africa Market Attractiveness by Material Type, 2023 to 2033 Figure 190: Middle East and Africa Market Attractiveness by Product Type, 2023 to 2033 Figure 191: Middle East and Africa Market Attractiveness by End Use, 2023 to 2033 Figure 192: Middle East and Africa Market Attractiveness by Country, 2023 to 2033
Recommendations
Explore Packaging Insights
View Reports