The global liquid filtration market is likely to reach USD 10.7 billion by 2035, recording an absolute increase of USD 5.7 billion over the forecast period. The market is valued at USD 5.0 billion in 2025 and is set to rise at a CAGR of 7.9% during the assessment period. The overall market size is expected to grow by 2.1 times during the same period, supported by increasing industrial water treatment requirements and stringent environmental regulations worldwide, driving demand for advanced filtration systems and increasing investments in municipal wastewater infrastructure, industrial process optimization, and water quality compliance initiatives globally.
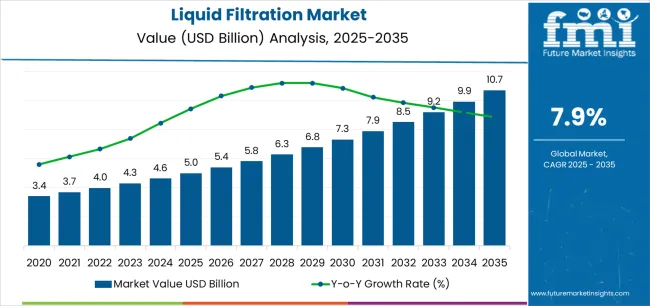
Between 2025 and 2030, the liquid filtration market is projected to expand from USD 5.0 billion to USD 7.4 billion, resulting in a value increase of USD 2.4 billion, which represents 42.1% of the total forecast growth for the decade. This phase of development will be shaped by rising demand for industrial water treatment and municipal wastewater management solutions, product innovation in nonwoven filter media and smart monitoring technologies, as well as expanding integration with IoT-enabled filtration systems and predictive maintenance initiatives. Companies are establishing competitive positions through investment in advanced membrane technologies, high-capacity filter cartridge designs, and strategic market expansion across industrial treatment, municipal infrastructure, and process optimization applications.
From 2030 to 2035, the market is forecast to grow from USD 7.4 billion to USD 10.7 billion, adding another USD 3.3 billion, which constitutes 57.9% of the overall ten-year expansion. This period is expected to be characterized by the expansion of specialized smart filtration systems, including advanced IoT-connected monitoring platforms and predictive maintenance technologies tailored for specific industrial requirements, strategic collaborations between filtration manufacturers and industrial end-users, and an enhanced focus on sustainable water management and circular economy principles. The growing emphasis on zero-liquid-discharge initiatives and smart water infrastructure will drive demand for advanced, high-performance liquid filtration solutions across diverse industrial and municipal applications.
| Metric | Value |
|---|---|
| Market Value (2025) | USD 5.0 billion |
| Market Forecast Value (2035) | USD 10.7 billion |
| Forecast CAGR (2025-2035) | 7.9% |
The liquid filtration market grows by enabling industrial operators, municipal utilities, and facility managers to achieve superior water quality and regulatory compliance while meeting evolving environmental protection and process efficiency demands. Industrial facilities face mounting pressure to minimize water consumption and meet discharge standards, with advanced liquid filtration systems providing 70-80% contaminant removal efficiency compared to conventional settling methods, making sophisticated filtration essential for chemical processing, food & beverage production, and pharmaceutical manufacturing. The water scarcity movement's need for efficient treatment and reuse creates demand for advanced filtration solutions that can enable water recycling, reduce freshwater intake, and ensure consistent process water quality across diverse industrial conditions.
Government initiatives promoting water conservation and pollution control drive adoption in industrial wastewater treatment, municipal water supply, and process industries, where filtration performance has a direct impact on environmental compliance and operational efficiency. The global shift toward zero-liquid-discharge and circular water economy accelerates liquid filtration demand as facilities seek technologies that enable maximum water recovery and minimal environmental impact.
The market is segmented by fabric material, filter media, end use, region, implementation, and application. By fabric material, the market is divided into polymer, metal, and cotton. Based on filter media, the market is categorized into nonwoven, woven, and mesh. By end use, the market includes industrial treatment and municipal treatment. Based on implementation, the market is segmented into retrofit and new construction. Regionally, the market is divided into Asia Pacific, North America, Europe, Latin America, and Middle East & Africa.
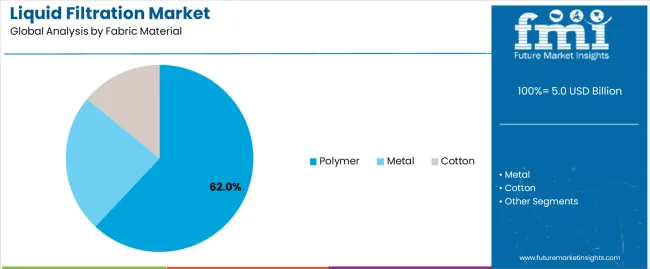
The polymer segment represents the dominant force in the liquid filtration market, capturing approximately 62.0% of total market share in 2025. This advanced category encompasses synthetic materials including polyester, polypropylene, nylon, and advanced fluoropolymers, featuring superior chemical resistance, consistent pore structure, and versatile performance characteristics, delivering comprehensive filtration capabilities with optimal cost-effectiveness and durability. The polymer segment's market leadership stems from its exceptional chemical compatibility across diverse industrial fluids, superior mechanical strength supporting high-pressure applications, and cost-effective manufacturing enabling economical large-scale filtration implementations.
The metal segment maintains a substantial 28.0% market share, serving applications where high-temperature resistance, extreme durability, and cleanability are priorities, particularly in food processing, pharmaceutical manufacturing, and high-pressure industrial systems. Metal filter fabrics including stainless steel and specialty alloys offer advantages in harsh operating environments, providing reusable filtration media with extended service life and autoclave compatibility. The cotton segment accounts for 10.0% market share, featuring natural fiber materials for specific applications requiring biodegradability and traditional filtration methods in food processing and specialty chemical applications.
Key advantages driving the polymer segment include:
The industrial treatment segment represents the leading end-use category in the liquid filtration market, capturing approximately 56.0% of total market share in 2025. This critical segment encompasses chemical processing facilities, food & beverage production, pharmaceutical manufacturing, oil & gas operations, and general manufacturing where liquid filtration delivers essential process fluid clarification, product quality assurance, and wastewater treatment supporting regulatory compliance. The industrial treatment segment's dominance reflects the fundamental role of filtration in manufacturing operations, from raw material processing to final product purification and environmental discharge control.
The municipal treatment segment maintains a substantial 44.0% market share, serving drinking water treatment plants, wastewater treatment facilities, and public utility operations requiring reliable filtration for potable water production and effluent polishing. Municipal applications emphasize large-scale capacity, operational reliability, and long-term cost-effectiveness supporting infrastructure serving residential, commercial, and light industrial water needs. Despite representing a smaller market share, municipal treatment features high-volume consumption and long equipment lifecycles supporting stable market foundation.
Key factors driving industrial treatment segment leadership include:
The retrofit segment represents the leading implementation category in the liquid filtration market, capturing approximately 58.0% of total market share in 2025. This critical implementation mode encompasses filtration system upgrades, capacity expansions, and technology replacements in existing facilities, where modernization investments enable performance improvements, regulatory compliance, and operational efficiency enhancements without complete facility reconstruction. The retrofit segment's dominance reflects the large installed base of industrial and municipal facilities requiring periodic equipment upgrades and the economic advantages of modernizing existing infrastructure compared to greenfield construction.
Retrofit implementations address aging equipment replacement, capacity bottlenecks, regulatory compliance gaps, and performance optimization opportunities across operational facilities. These projects typically feature compressed timelines, space constraints, and integration requirements with existing process infrastructure driving demand for modular filtration systems and minimal-disruption installation methodologies. The new construction segment maintains 42.0% market share, serving greenfield industrial facilities, expanding municipal utilities, and new manufacturing plants where integrated filtration system design enables optimal performance and lifecycle cost efficiency.
Key factors driving retrofit segment leadership include:
The market is driven by three concrete demand factors tied to environmental compliance and water management outcomes. First, stringent EPA and international water quality regulations create increasing requirements for advanced filtration technologies, with industrial discharge standards becoming 30-50% more restrictive over the past decade requiring sophisticated filtration systems to achieve compliance with heavy metal removal, suspended solids reduction, and organic contaminant elimination supporting environmental protection mandates. Second, zero-liquid-discharge initiatives and water scarcity concerns drive industrial investment in filtration-based water recycling, with manufacturing facilities implementing closed-loop water systems achieving 80-95% water recovery through multi-stage filtration processes reducing freshwater consumption and wastewater discharge costs. Third, industrial process optimization and product quality enhancement accelerate filtration adoption, with pharmaceutical, food & beverage, and chemical manufacturers requiring 99.9%+ purity levels necessitating advanced filtration supporting production efficiency, regulatory compliance, and premium product positioning.
Market restraints include high capital costs affecting system accessibility for small manufacturers, with advanced membrane filtration installations requiring USD 500,000 to USD 5 million investments creating financial barriers for independent operators and developing market facilities operating on limited capital budgets. Maintenance complexity and operational expertise requirements pose implementation challenges, as advanced filtration systems require skilled personnel understanding membrane cleaning protocols, backwash optimization, and troubleshooting procedures that may not be readily available in regions with limited technical workforce development. Energy consumption and operating cost considerations create additional pressures, particularly for pressure-driven membrane systems where pumping requirements can account for 40-60% of treatment operating costs impacting total cost of ownership competitiveness versus alternative water treatment approaches.
Key trends indicate accelerated adoption of IoT-enabled smart filtration systems with predictive maintenance capabilities, particularly in industrial applications where connected sensors monitor differential pressure, flow rates, and filtration efficiency enabling data-driven optimization reducing unplanned downtime by 60-80% while extending filter media life. Sustainability and circular economy integration trends toward filtration systems designed for maximum water recovery, minimal chemical consumption, and reduced waste generation are supporting corporate environmental targets and regulatory compliance while improving operational economics. The market thesis could face disruption if emerging technologies such as electrochemical treatment, advanced oxidation processes, or biomimetic purification systems achieve cost-competitive performance with lower energy consumption and simpler operation, potentially reshaping industrial water treatment technology selection and capital investment priorities.
| Country | CAGR (2025-2035) |
|---|---|
| India | 9.1% |
| China | 8.2% |
| Germany | 7.9% |
| USA | 7.8% |
| Japan | 7.6% |
| South Korea | 7.5% |
| UK | 7.4% |
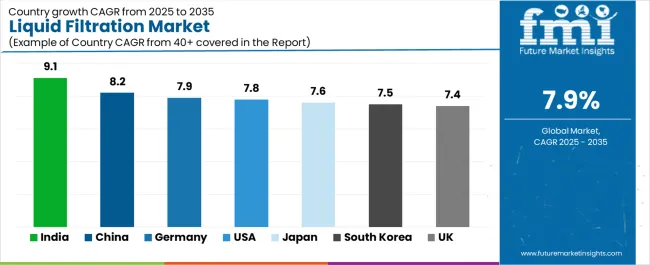
The liquid filtration market is gaining momentum worldwide, with India taking the lead thanks to accelerating urban water programs and zero-liquid-discharge initiatives in chemicals and textiles sectors. Close behind, China benefits from large-scale industrial upgrades and municipal wastewater capacity additions, positioning itself as a strategic growth hub in the Asia-Pacific region. Germany shows strong advancement, where EU directives drive high-specification industrial and pharma-grade filtration upgrades strengthening European manufacturing standards. The USA demonstrates robust growth through tight EPA compliance and rapid adoption of IoT-enabled filtration, signaling continued investment in smart water infrastructure. Meanwhile, Japan stands out for precision manufacturing standards and space-efficient smart filtration retrofits, while South Korea and the UK continue to record consistent progress driven by advanced electronics water management and utility modernization programs. Together, India and China anchor the global expansion story, while established markets build stability and diversity into the market's growth path.
The report covers an in-depth analysis of 40+ countries, Top-performing countries are highlighted below.
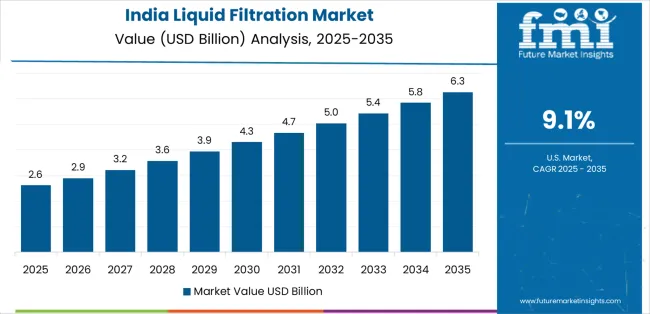
India demonstrates the strongest growth potential in the Liquid Filtration Market with a CAGR of 9.1% through 2035. The country's leadership position stems from comprehensive urban water infrastructure programs, intensive zero-liquid-discharge mandates in industrial sectors, and aggressive environmental compliance initiatives driving adoption of advanced liquid filtration systems. Growth is concentrated in major industrial regions, including Gujarat chemical corridor, Tamil Nadu textile belt, Maharashtra pharmaceutical cluster, and National Capital Region, where chemical processors, textile manufacturers, and pharmaceutical facilities are implementing sophisticated filtration technologies for wastewater treatment and process water recycling. Distribution channels through engineering contractors, water treatment specialists, and direct industrial procurement relationships expand deployment across industrial estates and municipal infrastructure projects. The country's National Water Mission and industrial pollution control regulations provide policy support for water treatment modernization, including financing schemes for effluent treatment facilities and technology adoption incentives.
Key market factors:
In major industrial zones, municipal utilities, and manufacturing corridors, the adoption of liquid filtration systems is accelerating across industrial wastewater treatment, municipal capacity expansions, and process water applications, driven by environmental protection initiatives and water resource management programs. The market demonstrates strong growth momentum with a CAGR of 8.2% through 2035, linked to comprehensive industrial upgrading campaigns and increasing focus on water pollution control enhancement solutions. Chinese facility operators are implementing advanced filtration technologies and smart monitoring platforms to achieve discharge compliance while meeting production requirements in key industrial regions including Yangtze River Delta, Pearl River Delta, Bohai Rim, and Central industrial zones. The country's environmental protection policies and water conservation initiatives create sustained demand for efficient filtration solutions, while increasing emphasis on industrial ecology drives adoption of water recycling systems that enhance resource efficiency.
Germany's expanding industrial sector demonstrates sophisticated implementation of liquid filtration systems, with documented case studies showing 85-95% contaminant removal efficiency in pharmaceutical and chemical facilities through advanced membrane and depth filtration technologies. The country's manufacturing infrastructure in major industrial regions, including North Rhine-Westphalia, Bavaria, Baden-Württemberg, and Lower Saxony, showcases integration of high-specification filtration technologies with existing process control systems, leveraging expertise in precision manufacturing and quality assurance. German facility operators emphasize reliability and compliance certainty, creating demand for premium filtration systems that support stringent pharmaceutical GMP requirements and chemical industry safety standards. The market maintains strong growth through focus on industrial process optimization and environmental excellence, with a CAGR of 7.9% through 2035.
Key development areas:
The USA market demonstrates significant advancement in liquid filtration implementation based on EPA regulatory compliance and smart water infrastructure modernization for enhanced environmental performance. The country shows solid potential with a CAGR of 7.8% through 2035, driven by industrial wastewater regulations and increasing adoption of connected filtration technologies across major industrial regions, including Gulf Coast chemical complex, Midwest manufacturing belt, Northeast pharmaceutical corridor, and Western food processing zones. American facility operators are implementing IoT-enabled filtration systems for real-time compliance monitoring and predictive maintenance, particularly in chemical processing and food & beverage applications requiring documented water quality control. Technology deployment channels through water treatment engineering firms, equipment distributors, and direct industrial procurement programs expand coverage across diverse applications.
Leading market segments:
Japan's liquid filtration market demonstrates sophisticated implementation focused on precision manufacturing requirements and space-efficient system designs, with documented integration achieving exceptional purity levels in electronics manufacturing and pharmaceutical production applications. The country maintains steady growth momentum with a CAGR of 7.6% through 2035, driven by stringent quality standards and operators' emphasis on process excellence principles aligned with lean manufacturing practices. Major industrial regions, including Tokyo-Yokohama corridor, Nagoya manufacturing belt, Osaka-Kobe industrial zone, and Kyushu semiconductor cluster, showcase advanced deployment of compact filtration systems that integrate seamlessly with existing process infrastructure and quality management protocols.
Key market characteristics:
South Korea's liquid filtration market demonstrates sophisticated implementation focused on semiconductor manufacturing and advanced electronics applications, with documented integration achieving ultra-pure water production in cleanroom facilities. The country maintains steady growth momentum with a CAGR of 7.5% through 2035, driven by electronics industry requirements and operators' emphasis on contamination control principles aligned with advanced manufacturing standards. Major industrial and technology regions, including Seoul metropolitan area, Gyeonggi Province, Chungcheong semiconductor zones, and Ulsan petrochemical complex, showcase advanced deployment of multi-stage filtration systems that integrate seamlessly with process water recycling and quality monitoring infrastructure.
Key market characteristics:
The United Kingdom's liquid filtration market demonstrates mature implementation focused on water quality compliance and industrial processing upgrades, with documented integration achieving drinking water standards and industrial discharge requirements. The country maintains steady growth through utility infrastructure investment and food processing modernization, with a CAGR of 7.4% through 2035, driven by water quality mandates and green industry investment supporting sustainable manufacturing. Major industrial regions, including Southeast England, Midlands manufacturing belt, Northwest industrial corridor, and Scotland, showcase advanced filtration deployment where utilities and food processors integrate modern membrane and media filtration with existing treatment infrastructure.
Key market characteristics:
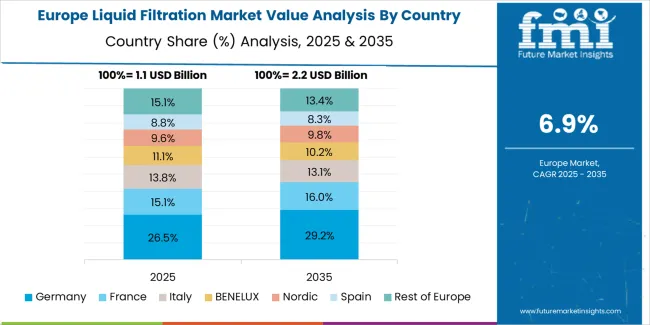
The liquid filtration market in Europe is projected to grow from USD 1.2 billion in 2025 to USD 2.4 billion by 2035, registering a CAGR of 7.2% over the forecast period. Germany leads with a 25.6% market share in 2025, easing slightly to 25.1% by 2035, supported by its advanced pharmaceutical and chemical manufacturing infrastructure requiring high-specification filtration across Bavaria, North Rhine-Westphalia, and Baden-Württemberg regions. France follows with an 18.8% share in 2025, edging to 19.1% by 2035, driven by potable-water treatment modernization and wastewater program investments supporting municipal infrastructure. The United Kingdom holds a 17.2% share in 2025, trending to 17.0% by 2035 as utilities and food & beverage packaging lines modernize filtration systems. Italy accounts for 14.3% in 2025, supported by chemicals processing, dairy manufacturing, and tourism-linked water infrastructure. Spain holds 12.1% in 2025, driven by food processing, beverage production, and coastal tourism water treatment requirements. Rest of Europe rises from 12.0% to 12.7% by 2035 as Nordic countries and Central & Eastern Europe scale membrane and nonwoven-media adoption across industrial and municipal applications supporting EU water quality directives.
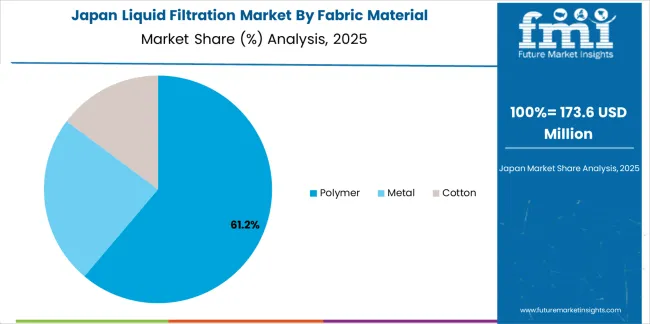
The Japanese liquid filtration market demonstrates a mature and quality-focused landscape, characterized by sophisticated integration of precision membrane systems and ultra-pure water technologies with existing manufacturing infrastructure across semiconductor facilities, pharmaceutical plants, and food processing operations. Japan's emphasis on manufacturing excellence and contamination control drives demand for certified liquid filtration equipment that supports stringent quality requirements and performance expectations in premium domestic manufacturing standards. The market benefits from strong partnerships between international filtration manufacturers and domestic engineering firms including industrial water treatment associations, creating comprehensive service ecosystems that prioritize system reliability and technical support programs. Industrial centers in Tokyo, Osaka, Nagoya, and Kyushu showcase advanced filtration implementations where water treatment programs achieve exceptional purity through multi-stage systems and integrated quality monitoring platforms.
The South Korean liquid filtration market is characterized by growing international technology provider presence, with companies maintaining significant positions through comprehensive technical support and application engineering capabilities for semiconductor manufacturing and advanced electronics applications. The market demonstrates increasing emphasis on ultra-pure water systems and contamination-free filtration technologies, as Korean manufacturers increasingly demand specialized filtration equipment that integrates with domestic quality management systems and sophisticated production control platforms deployed across electronics facilities. Regional engineering contractors are gaining market share through strategic partnerships with international manufacturers, offering specialized services including cleanroom installation support and application-specific system design programs for demanding ultra-pure water applications. The competitive landscape shows increasing collaboration between multinational filtration companies and Korean industrial technology specialists, creating hybrid service models that combine international product development expertise with local application knowledge and precision water treatment requirements.
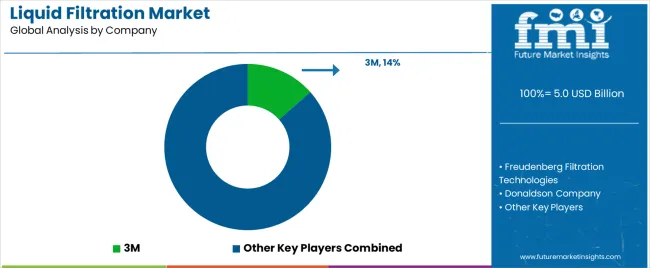
The liquid filtration market features approximately 12-18 meaningful players with moderate concentration, where the top three companies control roughly 25-30% of global market share through established distribution networks and comprehensive product portfolios. Competition centers on filtration efficiency, system reliability, and technical support capabilities rather than price competition alone. 3M leads with approximately 10.5% market share through its comprehensive filtration product portfolio spanning industrial, municipal, and specialty applications.
Market leaders include 3M, Freudenberg Filtration Technologies, and Donaldson Company, which maintain competitive advantages through global manufacturing infrastructure, extensive technical support networks, and deep expertise in filtration media and system design across multiple industrial segments, creating trust and reliability advantages with industrial operators, municipal utilities, and process engineers. These companies leverage research and development capabilities in advanced membrane technologies and ongoing customer support relationships to defend market positions while expanding into smart monitoring and predictive maintenance solutions.
Challengers encompass Pall Corporation (Danaher) and Parker Hannifin, which compete through specialized filtration systems and strong presence in pharmaceutical and process industry markets. Product specialists, including Pentair, Mann+Hummel, and Filtration Group, focus on specific market segments or application niches, offering differentiated capabilities in municipal water, industrial process filtration, and customized system configurations. Global players including Veolia Water Technologies & Solutions and Cummins Filtration create competitive pressure through comprehensive water treatment solutions, engineering expertise, and project execution capabilities, particularly in large-scale municipal and industrial projects where integrated system design provides advantages in performance optimization and lifecycle support.
Liquid filtration systems represent essential industrial and municipal equipment that enables operators to achieve 70-80% contaminant removal efficiency compared to conventional settling methods, delivering superior water quality and regulatory compliance with proven reliability in demanding industrial and municipal applications. With the market projected to grow from USD 5.0 billion in 2025 to USD 10.7 billion by 2035 at a 7.9% CAGR, these critical water treatment systems offer compelling advantages - efficient contaminant removal, process optimization, and environmental compliance - making them essential for industrial treatment (56.0% market share), municipal water systems (44.0% share), and operations requiring advanced liquid purification that conventional methods cannot deliver cost-effectively.
| Item | Value |
|---|---|
| Quantitative Units | USD 5.0 Billion |
| Fabric Material | Polymer, Metal, Cotton |
| Filter Media | Nonwoven, Woven, Mesh |
| End Use | Industrial Treatment, Municipal Treatment |
| Implementation | Retrofit, New Construction |
| Regions Covered | Asia Pacific, North America, Europe, Latin America, Middle East & Africa |
| Country Covered | India, China, Germany, USA, Japan, South Korea, UK, and 40+ countries |
| Key Companies Profiled | 3M, Freudenberg Filtration Technologies, Donaldson Company, Pall Corporation (Danaher), Parker Hannifin, Pentair, Mann+Hummel, Filtration Group, Veolia Water Technologies & Solutions, Cummins Filtration |
| Additional Attributes | Dollar sales by fabric material, filter media, end use, and implementation categories, regional adoption trends across Asia Pacific, North America, and Europe, competitive landscape with filtration manufacturers and engineering service providers, technical specifications and performance requirements, integration with industrial control systems and water quality monitoring platforms, innovations in smart filtration technology and predictive maintenance, and development of specialized liquid filtration systems with enhanced efficiency and environmental compliance capabilities. |
The global liquid filtration market is estimated to be valued at USD 5.0 billion in 2025.
The market size for the liquid filtration market is projected to reach USD 10.7 billion by 2035.
The liquid filtration market is expected to grow at a 7.9% CAGR between 2025 and 2035.
The key product types in liquid filtration market are polymer, metal and cotton.
In terms of , end use segment to command 0.0% share in the liquid filtration market in 2025.


Our Research Products

The "Full Research Suite" delivers actionable market intel, deep dives on markets or technologies, so clients act faster, cut risk, and unlock growth.

The Leaderboard benchmarks and ranks top vendors, classifying them as Established Leaders, Leading Challengers, or Disruptors & Challengers.

Locates where complements amplify value and substitutes erode it, forecasting net impact by horizon

We deliver granular, decision-grade intel: market sizing, 5-year forecasts, pricing, adoption, usage, revenue, and operational KPIs—plus competitor tracking, regulation, and value chains—across 60 countries broadly.

Spot the shifts before they hit your P&L. We track inflection points, adoption curves, pricing moves, and ecosystem plays to show where demand is heading, why it is changing, and what to do next across high-growth markets and disruptive tech

Real-time reads of user behavior. We track shifting priorities, perceptions of today’s and next-gen services, and provider experience, then pace how fast tech moves from trial to adoption, blending buyer, consumer, and channel inputs with social signals (#WhySwitch, #UX).

Partner with our analyst team to build a custom report designed around your business priorities. From analysing market trends to assessing competitors or crafting bespoke datasets, we tailor insights to your needs.
Supplier Intelligence
Discovery & Profiling
Capacity & Footprint
Performance & Risk
Compliance & Governance
Commercial Readiness
Who Supplies Whom
Scorecards & Shortlists
Playbooks & Docs
Category Intelligence
Definition & Scope
Demand & Use Cases
Cost Drivers
Market Structure
Supply Chain Map
Trade & Policy
Operating Norms
Deliverables
Buyer Intelligence
Account Basics
Spend & Scope
Procurement Model
Vendor Requirements
Terms & Policies
Entry Strategy
Pain Points & Triggers
Outputs
Pricing Analysis
Benchmarks
Trends
Should-Cost
Indexation
Landed Cost
Commercial Terms
Deliverables
Brand Analysis
Positioning & Value Prop
Share & Presence
Customer Evidence
Go-to-Market
Digital & Reputation
Compliance & Trust
KPIs & Gaps
Outputs
Full Research Suite comprises of:
Market outlook & trends analysis
Interviews & case studies
Strategic recommendations
Vendor profiles & capabilities analysis
5-year forecasts
8 regions and 60+ country-level data splits
Market segment data splits
12 months of continuous data updates
DELIVERED AS:
PDF EXCEL ONLINE
Liquid Processing Filter Market Size and Share Forecast Outlook 2025 to 2035
Liquid Mandrel Release Agent Market Size and Share Forecast Outlook 2025 to 2035
Liquid Filling Machine Market Size and Share Forecast Outlook 2025 to 2035
Liquid Oxygen Generator Market Size and Share Forecast Outlook 2025 to 2035
Liquid Packaging Bag Market Size and Share Forecast Outlook 2025 to 2035
Liquid Carton Packaging Market Size and Share Forecast Outlook 2025 to 2035
Liquid Desiccant Natural Gas Dehydration Unit Market Size and Share Forecast Outlook 2025 to 2035
Liquid Filled Pressure Gauges Market Size and Share Forecast Outlook 2025 to 2035
Liquid Packaging Board Market Size and Share Forecast Outlook 2025 to 2035
Liquid Filled Capsule Market Size and Share Forecast Outlook 2025 to 2035
Liquid Density Meters Market Size and Share Forecast Outlook 2025 to 2035
Liquid Cold Plates Market Size and Share Forecast Outlook 2025 to 2035
Liquid Crystal Polymers Market Size and Share Forecast Outlook 2025 to 2035
Liquid Embolic Agent Market Size and Share Forecast Outlook 2025 to 2035
Filtration and Separation Equipment Market Size and Share Forecast Outlook 2025 to 2035
Liquid Hydrogen Market Size and Share Forecast Outlook 2025 to 2035
Liquid Cooled Home Standby Gensets Market Size and Share Forecast Outlook 2025 to 2035
Liquid Nitrogen Purge Systems Market Size and Share Forecast Outlook 2025 to 2035
Liquid Chromatography Systems Market Size and Share Forecast Outlook 2025 to 2035
Liquid Armor Materials Market Size and Share Forecast Outlook 2025 to 2035

Thank you!
You will receive an email from our Business Development Manager. Please be sure to check your SPAM/JUNK folder too.
Chat With
MaRIA