Liquid Breakfast Products Market Snapshot (2022 to 2032)

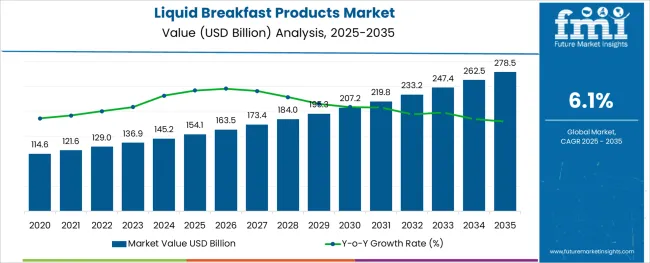
During the projected period, the Liquid Breakfast Products market is expected to grow at a CAGR of 6.1 %. The market value is projected to increase from US$ 1,29,000.0 Million in 2022 to US$2,33,208.1 Million by 2032.

Attribute Details
Market Size Value in 2022 US$ 1,29,000.00 Million
Market Forecast Value in 2032 US$ 2,33,208.06 Million
Global Growth Rate (2022 to 2032) 6.1%
Forecast Period 2022 to 2032

Don't pay for what you don't need

Customize your report by selecting specific countries or regions and save 30%!

Overall market overview for liquid breakfast products

The most profitable liquid breakfast products segment is the spoonable breakfast segment, which will represent more than US$ 72 Billion of the global market in 2021. By the end of 2032, the market will reach US $103 billion with a 6.1 % annual growth rate.

Western Europe was the largest market for liquid breakfast products, likely to reach 26.8% of the global revenue share by 2032.

This segment is estimated to be worth about US$100 Billion by the end of 20232, representing an opportunity of more than US$2.800 Billion in 2021 alone and an incrementally growing opportunity of more than US$45 Million between 2021 and 2032. The liquid breakfast segment is expected to be worth about 45 % by the end of 2032.

Liquid Breakfast Products Market

Developed consumer demand for healthy food items strengthens demand for spoonable breakfast

Young people today are oriented increasingly toward the food that they eat. Consumers demand products that satisfy their taste, are healthy, and are natural, pure, and eco-friendly with the non-GMO label as they like choosing foods featuring specific ingredients without side effects. For example, in response to increasing consumer demand for natural and authentic yogurt, dairy ingredients are focusing on the development of ingredients that are assisting yogurt producers to produce lactose-free and clean-label products.

Another factor that is fuelling the demand for spoonable breakfast that includes yogurt among American consumers is the indulgence aspect. Yogurt has become a bite to eat high in both calories and carbohydrate content as a result of its attractively smooth, creamy texture, and continues to be a mainstay as a breakfast dish due to its versatility, convenience, and high nutrition content. The flavor is the key factor responsible for people's craving for yogurt across the globe.

A significant number of Latin Americans are greatly dependent on the consumption of ready-to-eat brekkie food which is also sometimes discovered to be low in fat. Consumers across this region are usually seen buying the top low-fat foodstuffs available as part of their breakfast meals. This will improve sales of packaged liquid breakfast products, such as spoonable and drinkable yogurt, milk, and cereal-based liquid breakfast drinks, as well as other liquid breakfast product categories throughout the region.

Manufacturers of breakfast drinks that are fluid are targeting markets in the Asia Pacific Area in hopes of maximizing profitability. For this reason, they're likewise leveraging demographic patterns due to the increasing general trend of healthier breakfast drinks.

As an example, in 2015, PepsiCo, Inc., a multinational producer of food and beverage products, invested heavily to expand its presence in the Asia-Pacific region by opening a facility in China. It is with this new line of Quaker products that the company plans to develop and market instant oatmeal, quickly-cooked oatmeal, and Quaker's cereal powder drink to match market demand in the region.

Nandini Roy Choudhury

Principal Consultant

Talk to Analyst

Find your sweet spots for generating winning opportunities in this market.

Global liquid breakfast products market analysis and forecast

Liquid breakfast product sales are predicted to witness robust growth during the upcoming decade, as an increasing number of children have commenced eating solid food. Revenue from the sale of liquid breakfast products in 2012 and 2016 totaled more than US$ 80 Billion and more than US$ 95 Billion, respectively.

By 2027 end, the global liquid breakfast products market is expected to reach a market value of more than US$ 2,33,208.06 Million, expanding at a CAGR of 6.1% over the forecast period 2022 to 2032.

Country-wise Insights

How is the USA Liquid Breakfast Products Market Shaping?

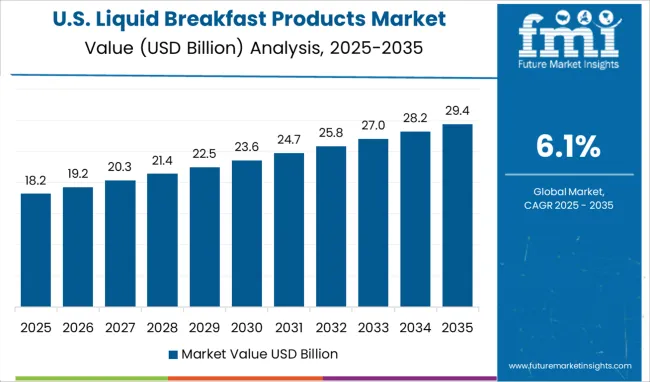
The USA liquid breakfast products market is expected to grow at a CAGR of 5.4% during the forecast period. The market is driven by the health benefits associated with liquid breakfast products, such as improved digestion and weight management. In addition, the growing demand for on-the-go breakfast options is also fueling the growth of the liquid breakfast products market in the United States.

What is the Performance of the Indian Liquid Breakfast Products Market?

The Indian liquid breakfast products market has seen significant growth in the past few years. With the growing health consciousness among people, there has been an increase in the demand for healthy and nutritious breakfast products. Liquid breakfast products are convenient to consume and easily digestible, which makes them a popular choice among people.

How Will Market Players Target the Emerging Market of China for the Liquid Breakfast Products Market?

the Chinese market for liquid breakfast products has grown rapidly. This is due to the rising health consciousness among Chinese consumers and their desire for convenient, healthy, and affordable breakfast options. Market players are now targeting China as a key growth market for liquid breakfast products. To tap into this growing market, companies need to understand the preferences of Chinese consumers. For example, many Chinese prefer breakfast beverages that are high in protein and low in sugar. They also seek out products that are convenient to consume on the go. In addition, price is a key consideration for Chinese consumers when purchasing liquid breakfast products.

How Japan is growing as the fastest Liquid Breakfast Products market?

In Japan, the liquid breakfast products market is growing at the fastest pace. This can be attributed to the changing lifestyles of the Japanese people. They are now more health conscious and are looking for convenient and healthy breakfast options. The liquid breakfast products are a perfect solution for them as they are easy to consume and are packed with nutrients. The Japanese people are also increasingly working long hours and do not have time to cook a proper breakfast. The liquid breakfast products provide them with the energy and nutrition they need to start their day.
Get the data you need at a Fraction of the cost

Personalize your report by choosing insights you need
and save 40%!

Competitive Landscape

The global market for food trays is incredibly fragmented and competitive due to the existence of several local and regional rivals. Key players employ a range of marketing strategies, such as partnerships, expansions, mergers and acquisitions, and collaborations.

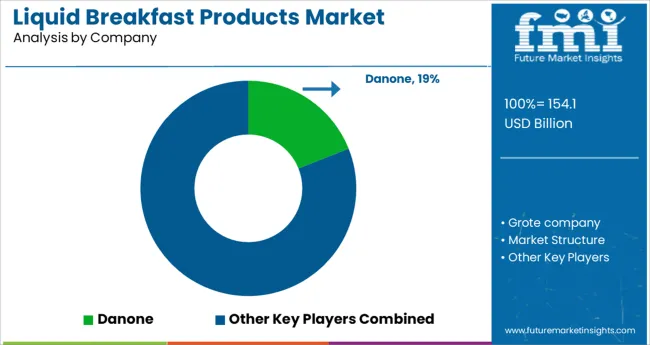
Some of the leading companies operating in the food trays market are Sanitarium Health & Wellbeing, Danone, The Hain Daniels Group Limited, Campbell Soup Company, Tio Gazpacho LLC, Soupologie Limited, Kellogg Co., MOMA Foods, Weetabix Ltd., Nestle S.A., General Mills Inc., Quaker Oats Company, Müller UK & Ireland, Chobani, LLC, The Kraft Heinz Company, The Billington Group.

Liquid Breakfast Products Market Report Scope

Attribute Details
Forecast Period 2022 to 2032
Historical Data Available for 2017 to 2022
Market Analysis USD Million for Value and Units for Volume
Key Regions Covered
  • North America
  • Latin America
  • Europe
  • Asia Pacific
  • Oceania
  • Middle East and Africa
Key Countries Covered
  • United States of America
  • Canada
  • Mexico
  • Germany
  • United Kingdom
  • France
  • Italy
  • Spain
  • China
  • Japan
  • India
  • South Korea
  • Australia
  • Brazil
  • Argentina
  • South Africa
  • UAE
Key Segments Covered
  • Product Type
  • Packaging Type
  • Distribution Channel
  • Region
Key Companies Profiled
  • Grote company
  • Market Structure
  • Sanitarium Health & Wellbeing
  • Danone
  • The Hain Daniels Group Limited
  • Campbell Soup Company
  • Tio Gazpacho LLC
  • Soupologie Limited
  • Kellogg Co.
  • MOMA Foods
  • Weetabix Ltd.
  • Nestle S.A.
  • General Mills Inc.
  • Quaker Oats Company
  • Müller UK & Ireland
  • Chobani, LLC
  • The Kraft Heinz Company
  • The Billington Group
Report Coverage Market Forecast, Company Share Analysis, Competitive Landscape, Drivers, Restraints, Opportunities and Threats Analysis, Market Dynamics and Challenges, and Strategic Growth Initiatives
Customization & Pricing Available upon Request

Liquid Breakfast Products Market by Category

By Product Type, Liquid Breakfast Products Market is Segmented as:

  • Liquid Breakfast
    • Milk and Cereal Based Breakfast
    • Drinkable Yogurt
    • Vegetable Liquid Soup
    • Chilled Soup
  • Spoonable Breakfast

By Region, Liquid Breakfast Products Market is Segmented as:

  • North America
  • Latin America
  • Eastern Europe
  • Western Europe
  • Asia Pacific Excluding Japan
  • Japan
  • Middle East & Africa

By Packaging Type, Liquid Breakfast Products Market is Segmented as:

  • Pouches
  • Cups & Tubs
  • Bottles
  • Carton Packaging
  • Cans

By Distribution Channel, Liquid Breakfast Products Market is Segmented as:

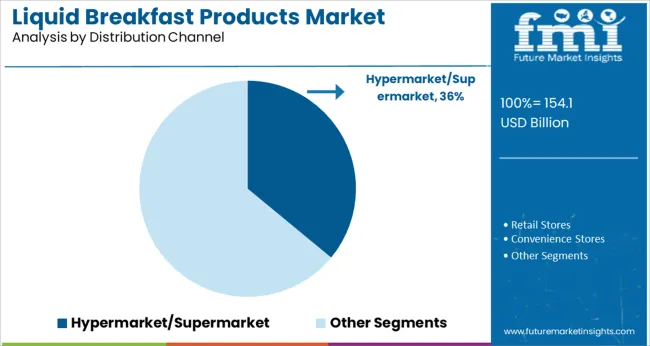
  • Hypermarket/Supermarket
  • Retail Stores
  • Convenience Stores
  • Online Selling
  • Other Retail Formats

Frequently Asked Questions

How big is the Liquid Breakfast Products Market?

The Liquid Breakfast Products Market size is assessed to be USD 1,29,000.00 Million currently.

At What Rate is Liquid Breakfast Products Market expected to rise?

The Liquid Breakfast Products Market is expected to rise at a CAGR of 6.1%.

What is the North America, Liquid Breakfast Products Market Outlook?

The North American Liquid Breakfast Products market is expected to register a 3.8% CAGR between 2022 and 2032.

Which are the major countries driving demand for Liquid Breakfast Products Market?

The United States of America, China, Canada, Germany, Mexico are the major countries driving demand for Liquid Breakfast Products Market.

At what rate will the China Liquid Breakfast Products Market grow?

China Liquid Breakfast Products market is projected to grow at a CAGR of around 4.2% over the next ten years.

At what rate will the Germany Liquid Breakfast Products Market grow?

Germany Liquid Breakfast Products market is projected to grow at a CAGR of around 9.2% over the next ten years.

At What Rate will, Liquid Breakfast Products Market Demand Grow in Europe?

The demand for Liquid Breakfast Products market in Europe is expected to grow at 5.9% CAGR between 2022 and 2032.

Who are the top 5 players operating in the market?

Sanitarium Health & Wellbeing, The Hain Daniels Group Limited, Tio Gazpacho LLC, MOMA Foods, Nestle S.A., General Mills Inc., Quaker Oats Company, and the Billington Group. are expected to be the top players driving the market growth.

At what rate will the Mexico Liquid Breakfast Products Market grow?

Mexico Liquid Breakfast Products market is projected to grow at a CAGR of around 3.2% over the next ten years.

What is the demand outlook forecast for the Liquid Breakfast Products market?

The global Liquid Breakfast Products market is forecasted to surpass US$ 2,33,208.1 Million by the end of 2032.

Table of Content
1. Executive Summary | Liquid Breakfast Products Market

    1.1. Global Market Outlook

    1.2. Demand-side Trends

    1.3. Supply-side Trends

    1.4. Technology Roadmap Analysis

    1.5. Analysis and Recommendations

2. Market Overview

    2.1. Market Coverage / Taxonomy

    2.2. Market Definition / Scope / Limitations

3. Market Background

    3.1. Market Dynamics

        3.1.1. Drivers

        3.1.2. Restraints

        3.1.3. Opportunity

        3.1.4. Trends

    3.2. Scenario Forecast

        3.2.1. Demand in Optimistic Scenario

        3.2.2. Demand in Likely Scenario

        3.2.3. Demand in Conservative Scenario

    3.3. Product launches & Recent Developments

    3.4. Product Life Cycle Analysis

    3.5. Value Chain Analysis

        3.5.1. Supply Side Participants and their Roles

            3.5.1.1. Producers

            3.5.1.2. Mid-Level Participants (Traders/ Agents/ Brokers)

            3.5.1.3. Wholesalers and Distributors

        3.5.2. % of Operating Margin Analysis

        3.5.3. List of Raw Material Suppliers

        3.5.4. List of Existing and Potential Buyers

    3.6. Global - Pricing Analysis

        3.6.1. Price Point Assessment by Region

        3.6.2. Price Point Assessment by Product Type

        3.6.3. Price Forecast till 2032

        3.6.4. Factors affecting pricing

    3.7. Forecast Factors - Relevance & Impact

    3.8. PESTLE and Porter’s Analysis

    3.9. Regulatory Landscape

        3.9.1. Packaging & Labelling Regulations

        3.9.2. Certifications and Certifying Agency Overview

        3.9.3. Import/Export Policies

    3.10. Regional Parent Market Outlook

    3.11. Production and Consumption Statistics

    3.12. Import and Export Statistics

    3.13. Consumers Survey Analysis

    3.14. Macro-Economic Factors

    3.15. Product Claims & Nutritional Information scanned by Buyers

4. Global Analysis 2017 to 2021 and Forecast, 2022 to 2032

    4.1. Historical Market Size Value (US$ Million) & Volume (MT) Analysis, 2017 to 2021

    4.2. Current and Future Market Size Value (US$ Million) & Volume (MT) Projections, 2022 to 2032

        4.2.1. Y-o-Y Growth Trend Analysis

        4.2.2. Absolute $ Opportunity Analysis

5. Global Analysis 2017 to 2021 and Forecast 2022 to 2032, By Product Type

    5.1. Introduction / Key Findings

    5.2. Historical Market Size Value (US$ Million) & Volume (MT) Analysis By Product Type, 2017 to 2021

    5.3. Current and Future Market Size Value (US$ Million) & Volume (MT) Analysis and Forecast By Product Type, 2022 to 2032

        5.3.1. Liquid Breakfast

            5.3.1.1. Milk and Cereal-Based Breakfast

            5.3.1.2. Drinkable Yogurt

            5.3.1.3. Vegetable Liquid Soup

            5.3.1.4. Chilled Soup

        5.3.2. Spoonable Breakfast

    5.4. Y-o-Y Growth Trend Analysis By Product Type, 2017 to 2021

    5.5. Absolute $ Opportunity Analysis By Product Type, 2022 to 2032

6. Global Analysis 2017 to 2021 and Forecast 2022 to 2032, By End User

    6.1. Introduction / Key Findings

    6.2. Historical Market Size Value (US$ Million) & Volume (MT) Analysis By End User, 2017 to 2021

    6.3. Current and Future Market Size Value (US$ Million) & Volume (MT) Analysis and Forecast By End User, 2022 to 2032

        6.3.1. Other Facilities

    6.4. Y-o-Y Growth Trend Analysis By End User, 2017 to 2021

    6.5. Absolute $ Opportunity Analysis By End User, 2022 to 2032

7. Global Analysis 2017 to 2021 and Forecast 2022 to 2032, By Packaging Type

    7.1. Introduction / Key Findings

    7.2. Historical Market Size Value (US$ Million) & Volume (MT) Analysis By Packaging Type, 2017 to 2021

    7.3. Current and Future Market Size Value (US$ Million) & Volume (MT) Analysis and Forecast By Packaging Type, 2022 to 2032

        7.3.1. Pouches

        7.3.2. Cups & Tubs

        7.3.3. Bottles

        7.3.4. Carton Packaging

        7.3.5. Cans

    7.4. Y-o-Y Growth Trend Analysis By Packaging Type, 2017 to 2021

    7.5. Absolute $ Opportunity Analysis By Packaging Type, 2022 to 2032

8. Global Analysis 2017 to 2021 and Forecast 2022 to 2032, By Region

    8.1. Introduction

    8.2. Historical Market Size Value (US$ Million) & Volume (MT) Analysis By Region, 2017 to 2021

    8.3. Current Market Size Value (US$ Million) & Volume (MT) Analysis and Forecast By Region, 2022 to 2032

        8.3.1. North America

        8.3.2. Latin America

        8.3.3. Europe

        8.3.4. East Asia

        8.3.5. South Asia

        8.3.6. Oceania

        8.3.7. Middle East and Africa

    8.4. Market Attractiveness Analysis By Region

9. North America Analysis 2017 to 2021 and Forecast 2022 to 2032, By Country

    9.1. Historical Market Size Value (US$ Million) & Volume (MT) Trend Analysis By Market Taxonomy, 2017 to 2021

    9.2. Market Size Value (US$ Million) & Volume (MT) Forecast By Market Taxonomy, 2022 to 2032

        9.2.1. By Country

            9.2.1.1. United States of America

            9.2.1.2. Canada

        9.2.2. By Product Type

        9.2.3. By End User

        9.2.4. By Packaging Type

    9.3. Market Attractiveness Analysis

        9.3.1. By Country

        9.3.2. By Product Type

        9.3.3. By End User

        9.3.4. By Packaging Type

    9.4. Key Takeaways

10. Latin America Analysis 2017 to 2021 and Forecast 2022 to 2032, By Country

    10.1. Historical Market Size Value (US$ Million) & Volume (MT) Trend Analysis By Market Taxonomy, 2017 to 2021

    10.2. Market Size Value (US$ Million) & Volume (MT) Forecast By Market Taxonomy, 2022 to 2032

        10.2.1. By Country

            10.2.1.1. Brazil

            10.2.1.2. Mexico

            10.2.1.3. Argentina

            10.2.1.4. Chile

            10.2.1.5. Peru

            10.2.1.6. Rest of Latin America

        10.2.2. By Product Type

        10.2.3. By End User

        10.2.4. By Packaging Type

    10.3. Market Attractiveness Analysis

        10.3.1. By Country

        10.3.2. By Product Type

        10.3.3. By End User

        10.3.4. By Packaging Type

    10.4. Key Takeaways

11. Europe Analysis 2017 to 2021 and Forecast 2022 to 2032, By Country

    11.1. Historical Market Size Value (US$ Million) & Volume (MT) Trend Analysis By Market Taxonomy, 2017 to 2021

    11.2. Market Size Value (US$ Million) & Volume (MT) Forecast By Market Taxonomy, 2022 to 2032

        11.2.1. By Country

            11.2.1.1. Germany

            11.2.1.2. Italy

            11.2.1.3. France

            11.2.1.4. United Kingdom

            11.2.1.5. Spain

            11.2.1.6. Russia

            11.2.1.7. BENELUX

            11.2.1.8. Poland

            11.2.1.9. Nordic Countries

            11.2.1.10. Rest of Europe

        11.2.2. By Product Type

        11.2.3. By End User

        11.2.4. By Packaging Type

    11.3. Market Attractiveness Analysis

        11.3.1. By Country

        11.3.2. By Product Type

        11.3.3. By End User

        11.3.4. By Packaging Type

    11.4. Key Takeaways

12. East Asia Analysis 2017 to 2021 and Forecast 2022 to 2032, By Country

    12.1. Historical Market Size Value (US$ Million) & Volume (MT) Trend Analysis By Market Taxonomy, 2017 to 2021

    12.2. Market Size Value (US$ Million) & Volume (MT) Forecast By Market Taxonomy, 2022 to 2032

        12.2.1. By Country

            12.2.1.1. China

            12.2.1.2. Japan

            12.2.1.3. South Korea

        12.2.2. By Product Type

        12.2.3. By End User

        12.2.4. By Packaging Type

    12.3. Market Attractiveness Analysis

        12.3.1. By Country

        12.3.2. By Product Type

        12.3.3. By End User

        12.3.4. By Packaging Type

    12.4. Key Takeaways

13. South Asia Analysis 2017 to 2021 and Forecast 2022 to 2032, By Country

    13.1. Historical Market Size Value (US$ Million) & Volume (MT) Trend Analysis By Market Taxonomy, 2017 to 2021

    13.2. Market Size Value (US$ Million) & Volume (MT) Forecast By Market Taxonomy, 2022 to 2032

        13.2.1. By Country

            13.2.1.1. India

            13.2.1.2. Thailand

            13.2.1.3. Malaysia

            13.2.1.4. Indonesia

            13.2.1.5. Singapore

            13.2.1.6. Rest of South Asia

        13.2.2. By Product Type

        13.2.3. By End User

        13.2.4. By Packaging Type

    13.3. Market Attractiveness Analysis

        13.3.1. By Country

        13.3.2. By Product Type

        13.3.3. By End User

        13.3.4. By Packaging Type

    13.4. Key Takeaways

14. Oceania Analysis 2017 to 2021 and Forecast 2022 to 2032, By Country

    14.1. Historical Market Size Value (US$ Million) & Volume (MT) Trend Analysis By Market Taxonomy, 2017 to 2021

    14.2. Market Size Value (US$ Million) & Volume (MT) Forecast By Market Taxonomy, 2022 to 2032

        14.2.1. By Country

            14.2.1.1. Australia

            14.2.1.2. New Zealand

        14.2.2. By Product Type

        14.2.3. By End User

        14.2.4. By Packaging Type

    14.3. Market Attractiveness Analysis

        14.3.1. By Country

        14.3.2. By Product Type

        14.3.3. By End User

        14.3.4. By Packaging Type

    14.4. Key Takeaways

15. Middle East and Africa Analysis 2017 to 2021 and Forecast 2022 to 2032, By Country

    15.1. Historical Market Size Value (US$ Million) & Volume (MT) Trend Analysis By Market Taxonomy, 2017 to 2021

    15.2. Market Size Value (US$ Million) & Volume (MT) Forecast By Market Taxonomy, 2022 to 2032

        15.2.1. By Country

            15.2.1.1. GCC Countries

            15.2.1.2. South Africa

            15.2.1.3. Central Africa

            15.2.1.4. North Africa

        15.2.2. By Product Type

        15.2.3. By End User

        15.2.4. By Packaging Type

    15.3. Market Attractiveness Analysis

        15.3.1. By Country

        15.3.2. By Product Type

        15.3.3. By End User

        15.3.4. By Packaging Type

    15.4. Key Takeaways

16. Key Countries Analysis

    16.1. United States of America

        16.1.1. Pricing Analysis

        16.1.2. Market Share Analysis, 2021

            16.1.2.1. By Product Type

            16.1.2.2. By End User

            16.1.2.3. By Packaging Type

    16.2. Canada

        16.2.1. Pricing Analysis

        16.2.2. Market Share Analysis, 2021

            16.2.2.1. By Product Type

            16.2.2.2. By End User

            16.2.2.3. By Packaging Type

    16.3. Brazil

        16.3.1. Pricing Analysis

        16.3.2. Market Share Analysis, 2021

            16.3.2.1. By Product Type

            16.3.2.2. By End User

            16.3.2.3. By Packaging Type

    16.4. Mexico

        16.4.1. Pricing Analysis

        16.4.2. Market Share Analysis, 2021

            16.4.2.1. By Product Type

            16.4.2.2. By End User

            16.4.2.3. By Packaging Type

    16.5. Argentina

        16.5.1. Pricing Analysis

        16.5.2. Market Share Analysis, 2021

            16.5.2.1. By Product Type

            16.5.2.2. By End User

            16.5.2.3. By Packaging Type

    16.6. Chile

        16.6.1. Pricing Analysis

        16.6.2. Market Share Analysis, 2021

            16.6.2.1. By Product Type

            16.6.2.2. By End User

            16.6.2.3. By Packaging Type

    16.7. Peru

        16.7.1. Pricing Analysis

        16.7.2. Market Share Analysis, 2021

            16.7.2.1. By Product Type

            16.7.2.2. By End User

            16.7.2.3. By Packaging Type

    16.8. Germany

        16.8.1. Pricing Analysis

        16.8.2. Market Share Analysis, 2021

            16.8.2.1. By Product Type

            16.8.2.2. By End User

            16.8.2.3. By Packaging Type

    16.9. Italy

        16.9.1. Pricing Analysis

        16.9.2. Market Share Analysis, 2021

            16.9.2.1. By Product Type

            16.9.2.2. By End User

            16.9.2.3. By Packaging Type

    16.10. France

        16.10.1. Pricing Analysis

        16.10.2. Market Share Analysis, 2021

            16.10.2.1. By Product Type

            16.10.2.2. By End User

            16.10.2.3. By Packaging Type

    16.11. Spain

        16.11.1. Pricing Analysis

        16.11.2. Market Share Analysis, 2021

            16.11.2.1. By Product Type

            16.11.2.2. By End User

            16.11.2.3. By Packaging Type

    16.12. United Kingdom

        16.12.1. Pricing Analysis

        16.12.2. Market Share Analysis, 2021

            16.12.2.1. By Product Type

            16.12.2.2. By End User

            16.12.2.3. By Packaging Type

    16.13. Russia

        16.13.1. Pricing Analysis

        16.13.2. Market Share Analysis, 2021

            16.13.2.1. By Product Type

            16.13.2.2. By End User

            16.13.2.3. By Packaging Type

    16.14. Poland

        16.14.1. Pricing Analysis

        16.14.2. Market Share Analysis, 2021

            16.14.2.1. By Product Type

            16.14.2.2. By End User

            16.14.2.3. By Packaging Type

    16.15. BENELUX

        16.15.1. Pricing Analysis

        16.15.2. Market Share Analysis, 2021

            16.15.2.1. By Product Type

            16.15.2.2. By End User

            16.15.2.3. By Packaging Type

    16.16. Nordic Countries

        16.16.1. Pricing Analysis

        16.16.2. Market Share Analysis, 2021

            16.16.2.1. By Product Type

            16.16.2.2. By End User

            16.16.2.3. By Packaging Type

    16.17. China

        16.17.1. Pricing Analysis

        16.17.2. Market Share Analysis, 2021

            16.17.2.1. By Product Type

            16.17.2.2. By End User

            16.17.2.3. By Packaging Type

    16.18. Japan

        16.18.1. Pricing Analysis

        16.18.2. Market Share Analysis, 2021

            16.18.2.1. By Product Type

            16.18.2.2. By End User

            16.18.2.3. By Packaging Type

    16.19. South Korea

        16.19.1. Pricing Analysis

        16.19.2. Market Share Analysis, 2021

            16.19.2.1. By Product Type

            16.19.2.2. By End User

            16.19.2.3. By Packaging Type

    16.20. India

        16.20.1. Pricing Analysis

        16.20.2. Market Share Analysis, 2021

            16.20.2.1. By Product Type

            16.20.2.2. By End User

            16.20.2.3. By Packaging Type

    16.21. Thailand

        16.21.1. Pricing Analysis

        16.21.2. Market Share Analysis, 2021

            16.21.2.1. By Product Type

            16.21.2.2. By End User

            16.21.2.3. By Packaging Type

    16.22. Indonesia

        16.22.1. Pricing Analysis

        16.22.2. Market Share Analysis, 2021

            16.22.2.1. By Product Type

            16.22.2.2. By End User

            16.22.2.3. By Packaging Type

    16.23. Malaysia

        16.23.1. Pricing Analysis

        16.23.2. Market Share Analysis, 2021

            16.23.2.1. By Product Type

            16.23.2.2. By End User

            16.23.2.3. By Packaging Type

    16.24. Singapore

        16.24.1. Pricing Analysis

        16.24.2. Market Share Analysis, 2021

            16.24.2.1. By Product Type

            16.24.2.2. By End User

            16.24.2.3. By Packaging Type

    16.25. Australia

        16.25.1. Pricing Analysis

        16.25.2. Market Share Analysis, 2021

            16.25.2.1. By Product Type

            16.25.2.2. By End User

            16.25.2.3. By Packaging Type

    16.26. New Zealand

        16.26.1. Pricing Analysis

        16.26.2. Market Share Analysis, 2021

            16.26.2.1. By Product Type

            16.26.2.2. By End User

            16.26.2.3. By Packaging Type

    16.27. GCC Countries

        16.27.1. Pricing Analysis

        16.27.2. Market Share Analysis, 2021

            16.27.2.1. By Product Type

            16.27.2.2. By End User

            16.27.2.3. By Packaging Type

    16.28. South Africa

        16.28.1. Pricing Analysis

        16.28.2. Market Share Analysis, 2021

            16.28.2.1. By Product Type

            16.28.2.2. By End User

            16.28.2.3. By Packaging Type

    16.29. North Africa

        16.29.1. Pricing Analysis

        16.29.2. Market Share Analysis, 2021

            16.29.2.1. By Product Type

            16.29.2.2. By End User

            16.29.2.3. By Packaging Type

    16.30. Central Africa

        16.30.1. Pricing Analysis

        16.30.2. Market Share Analysis, 2021

            16.30.2.1. By Product Type

            16.30.2.2. By End User

            16.30.2.3. By Packaging Type

17. Market Structure Analysis

    17.1. Competition Dashboard

    17.2. Competition Benchmarking

    17.3. Market Share Analysis of Top Players

        17.3.1. By Regional

        17.3.2. By Product Type

        17.3.3. By End User

        17.3.4. By Packaging Type

18. Competition Analysis

    18.1. Competition Deep Dive

        18.1.1. Grote company

            18.1.1.1. Overview

            18.1.1.2. Product Portfolio

            18.1.1.3. Profitability by Market Segments (Product Type/ Packaging Type /Region)

            18.1.1.4. Sales Footprint

            18.1.1.5. Strategy Overview

                18.1.1.5.1. Marketing Strategy

                18.1.1.5.2. Product Strategy

                18.1.1.5.3. Channel Strategy

        18.1.2. Market Structure

            18.1.2.1. Overview

            18.1.2.2. Product Portfolio

            18.1.2.3. Profitability by Market Segments (Product Type/ Packaging Type /Region)

            18.1.2.4. Sales Footprint

            18.1.2.5. Strategy Overview

                18.1.2.5.1. Marketing Strategy

                18.1.2.5.2. Product Strategy

                18.1.2.5.3. Channel Strategy

        18.1.3. Sanitarium Health & Wellbeing

            18.1.3.1. Overview

            18.1.3.2. Product Portfolio

            18.1.3.3. Profitability by Market Segments (Product Type/ Packaging Type /Region)

            18.1.3.4. Sales Footprint

            18.1.3.5. Strategy Overview

                18.1.3.5.1. Marketing Strategy

                18.1.3.5.2. Product Strategy

                18.1.3.5.3. Channel Strategy

        18.1.4. Danone

            18.1.4.1. Overview

            18.1.4.2. Product Portfolio

            18.1.4.3. Profitability by Market Segments (Product Type/ Packaging Type /Region)

            18.1.4.4. Sales Footprint

            18.1.4.5. Strategy Overview

                18.1.4.5.1. Marketing Strategy

                18.1.4.5.2. Product Strategy

                18.1.4.5.3. Channel Strategy

        18.1.5. The Hain Daniels Group Limited

            18.1.5.1. Overview

            18.1.5.2. Product Portfolio

            18.1.5.3. Profitability by Market Segments (Product Type/ Packaging Type /Region)

            18.1.5.4. Sales Footprint

            18.1.5.5. Strategy Overview

                18.1.5.5.1. Marketing Strategy

                18.1.5.5.2. Product Strategy

                18.1.5.5.3. Channel Strategy

        18.1.6. Campbell Soup Company

            18.1.6.1. Overview

            18.1.6.2. Product Portfolio

            18.1.6.3. Profitability by Market Segments (Product Type/ Packaging Type /Region)

            18.1.6.4. Sales Footprint

            18.1.6.5. Strategy Overview

                18.1.6.5.1. Marketing Strategy

                18.1.6.5.2. Product Strategy

                18.1.6.5.3. Channel Strategy

        18.1.7. Tio Gazpacho LLC

            18.1.7.1. Overview

            18.1.7.2. Product Portfolio

            18.1.7.3. Profitability by Market Segments (Product Type/ Packaging Type /Region)

            18.1.7.4. Sales Footprint

            18.1.7.5. Strategy Overview

                18.1.7.5.1. Marketing Strategy

                18.1.7.5.2. Product Strategy

                18.1.7.5.3. Channel Strategy

        18.1.8. Soupologie Limited

            18.1.8.1. Overview

            18.1.8.2. Product Portfolio

            18.1.8.3. Profitability by Market Segments (Product Type/ Packaging Type /Region)

            18.1.8.4. Sales Footprint

            18.1.8.5. Strategy Overview

                18.1.8.5.1. Marketing Strategy

                18.1.8.5.2. Product Strategy

                18.1.8.5.3. Channel Strategy

        18.1.9. Kellogg Co.

            18.1.9.1. Overview

            18.1.9.2. Product Portfolio

            18.1.9.3. Profitability by Market Segments (Product Type/ Packaging Type /Region)

            18.1.9.4. Sales Footprint

            18.1.9.5. Strategy Overview

                18.1.9.5.1. Marketing Strategy

                18.1.9.5.2. Product Strategy

                18.1.9.5.3. Channel Strategy

        18.1.10. MOMA Foods

            18.1.10.1. Overview

            18.1.10.2. Product Portfolio

            18.1.10.3. Profitability by Market Segments (Product Type/ Packaging Type /Region)

            18.1.10.4. Sales Footprint

            18.1.10.5. Strategy Overview

                18.1.10.5.1. Marketing Strategy

                18.1.10.5.2. Product Strategy

                18.1.10.5.3. Channel Strategy

        18.1.11. Weetabix Ltd.

            18.1.11.1. Overview

            18.1.11.2. Product Portfolio

            18.1.11.3. Profitability by Market Segments (Product Type/ Packaging Type /Region)

            18.1.11.4. Sales Footprint

            18.1.11.5. Strategy Overview

                18.1.11.5.1. Marketing Strategy

                18.1.11.5.2. Product Strategy

                18.1.11.5.3. Channel Strategy

        18.1.12. Nestle S.A.

            18.1.12.1. Overview

            18.1.12.2. Product Portfolio

            18.1.12.3. Profitability by Market Segments (Product Type/ Packaging Type /Region)

            18.1.12.4. Sales Footprint

            18.1.12.5. Strategy Overview

                18.1.12.5.1. Marketing Strategy

                18.1.12.5.2. Product Strategy

                18.1.12.5.3. Channel Strategy

        18.1.13. General Mills Inc.

            18.1.13.1. Overview

            18.1.13.2. Product Portfolio

            18.1.13.3. Profitability by Market Segments (Product Type/ Packaging Type /Region)

            18.1.13.4. Sales Footprint

            18.1.13.5. Strategy Overview

                18.1.13.5.1. Marketing Strategy

                18.1.13.5.2. Product Strategy

                18.1.13.5.3. Channel Strategy

        18.1.14. Quaker Oats Company

            18.1.14.1. Overview

            18.1.14.2. Product Portfolio

            18.1.14.3. Profitability by Market Segments (Product Type/ Packaging Type /Region)

            18.1.14.4. Sales Footprint

            18.1.14.5. Strategy Overview

                18.1.14.5.1. Marketing Strategy

                18.1.14.5.2. Product Strategy

                18.1.14.5.3. Channel Strategy

        18.1.15. Müller UK & Ireland

            18.1.15.1. Overview

            18.1.15.2. Product Portfolio

            18.1.15.3. Profitability by Market Segments (Product Type/ Packaging Type /Region)

            18.1.15.4. Sales Footprint

            18.1.15.5. Strategy Overview

                18.1.15.5.1. Marketing Strategy

                18.1.15.5.2. Product Strategy

                18.1.15.5.3. Channel Strategy

        18.1.16. Chobani, LLC

            18.1.16.1. Overview

            18.1.16.2. Product Portfolio

            18.1.16.3. Profitability by Market Segments (Product Type/ Packaging Type /Region)

            18.1.16.4. Sales Footprint

            18.1.16.5. Strategy Overview

                18.1.16.5.1. Marketing Strategy

                18.1.16.5.2. Product Strategy

                18.1.16.5.3. Channel Strategy

        18.1.17. The Kraft Heinz Company

            18.1.17.1. Overview

            18.1.17.2. Product Portfolio

            18.1.17.3. Profitability by Market Segments (Product Type/ Packaging Type /Region)

            18.1.17.4. Sales Footprint

            18.1.17.5. Strategy Overview

                18.1.17.5.1. Marketing Strategy

                18.1.17.5.2. Product Strategy

                18.1.17.5.3. Channel Strategy

        18.1.18. The Billington Group

            18.1.18.1. Overview

            18.1.18.2. Product Portfolio

            18.1.18.3. Profitability by Market Segments (Product Type/ Packaging Type /Region)

            18.1.18.4. Sales Footprint

            18.1.18.5. Strategy Overview

                18.1.18.5.1. Marketing Strategy

                18.1.18.5.2. Product Strategy

                18.1.18.5.3. Channel Strategy

19. Assumptions & Acronyms Used

20. Research Methodology

Explore Food and Beverage Insights

View Reports
Future Market Insights

Liquid Breakfast Products Market