The global liquid packaging board market is valued at USD 18.3 billion in 2025 and is set to reach USD 37.7 billion by 2035, recording an absolute increase of USD 19.3 billion over the forecast period. This translates into a total growth of 105.5%, with the market forecast to expand at a compound annual growth rate (CAGR) of 7.50% between 2025 and 2035. As reported in Future Market Insights (FMI)’s verified packaging intelligence series, covering sustainability and material lifecycle trends, the overall market size is expected to grow by approximately 2.1X during the same period, supported by increasing demand for convenient beverage packaging solutions, growing adoption of recyclable carton materials, and rising requirements for barrier-protected containers across juice, milk, plant-based beverages, and ready-to-drink product categories.
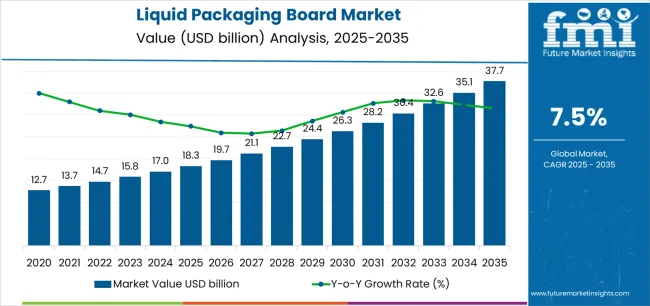
Between 2025 and 2030, the liquid packaging board market is projected to expand from USD 18.3 billion to USD 26.7 billion, resulting in a value increase of USD 8.4 billion, which represents 43.5% of the total forecast growth for the decade. This phase of development will be shaped by increasing demand for shelf-stable beverage formats, rising consumption of packaged dairy alternatives enabling extended distribution reach, and growing availability of advanced coating technologies across commercial carton manufacturing operations and specialty board production facilities.
Between 2030 and 2035, the market is forecast to grow from USD 26.7 billion to USD 37.7 billion, adding another USD 10.9 billion, which constitutes 56.5% of the overall ten-year expansion. This period is expected to be characterized by the advancement of high-barrier multilayer structures, the integration of fiber-based innovation for material optimization, and the development of premium opening systems across diverse beverage categories. The growing emphasis on circular economy principles and renewable material sourcing will drive demand for advanced board varieties with enhanced moisture resistance properties, improved environmental credentials, and superior functional characteristics.
Between 2020 and 2024, the liquid packaging board market experienced robust growth, driven by increasing consumer demand for convenient single-serve formats and growing recognition of carton packaging effectiveness in supporting safe product preservation across beverage and liquid food sectors. The market developed as businesses recognized the potential for liquid packaging board to deliver lightweight construction while meeting modern requirements for oxygen barrier properties and cost-effective production patterns. Technological advancement in extrusion coating and lamination practices began emphasizing the critical importance of maintaining package integrity while enhancing manufacturing efficiency and improving material utilization.
| Metric | Value |
|---|---|
| Estimated Value in (2025E) | USD 18.3 billion |
| Forecast Value in (2035F) | USD 37.7 billion |
| Forecast CAGR (2025 to 2035) | 7.50% |
From 2030 to 2035, the market is forecast to grow from USD 26.7 billion to USD 37.7 billion, adding another USD 10.9 billion, which constitutes 56.5% of the overall ten-year expansion. This period is expected to be characterized by the advancement of integrated pouring spout designs, the integration of tamper-evident closure systems for consumer safety, and the development of specialized barrier films for extended ambient storage applications. The growing emphasis on package convenience and manufacturing precision will drive demand for premium varieties with enhanced puncture resistance credentials, improved stackability options, and superior performance characteristics.
Between 2020 and 2024, the liquid packaging board market experienced significant growth, driven by increasing awareness of renewable packaging benefits and growing recognition of carton systems effectiveness in supporting efficient cold chain operations across retail segments and foodservice applications. The market developed as users recognized the potential for liquid packaging board to deliver economic advantages while meeting modern requirements for leak resistance and reliable sealing practices. Technological advancement in printing processes and quality control systems began emphasizing the critical importance of maintaining graphic quality while extending product shelf life capabilities and improving customer satisfaction across diverse beverage categories.
Market expansion is being supported by the increasing global demand for hygienic beverage packaging solutions and the corresponding shift toward renewable fiber-based containers that can provide superior barrier characteristics while meeting user requirements for product freshness and material-efficient production processes. Modern businesses are increasingly focused on incorporating packaging formats that can enhance brand visibility while satisfying demands for consistent, reliably performing containers and optimized distribution practices. Liquid packaging board proven ability to deliver structural rigidity, moisture protection, and diverse application possibilities makes them essential packaging for beverage manufacturers and quality-conscious brand owners.
The growing emphasis on cost-effective carton systems and production scalability is driving demand for high-performance liquid packaging board solutions that can support distinctive product positioning and comprehensive brand differentiation across dairy beverages, fruit juices, and plant-based milk categories. User preference for containers that combine functional excellence with manufacturing flexibility is creating opportunities for innovative implementations in both traditional and emerging packaging applications. The rising influence of organized retail formats and modern cold chain infrastructure is also contributing to increased adoption of liquid packaging board that can provide authentic performance benefits and reliable supply characteristics.
The market is segmented by board type, coating material, capacity, end-use application, and region. By board type, the market is divided into aseptic carton board, fresh carton board, polyethylene coated board, and uncoated board. Based on coating material, the market is categorized into polyethylene coating, aluminum foil lamination, biopolymer coating, and other coatings. By capacity, the market includes below 250ml, 250ml-500ml, 500ml-1L, and above 1L. By end-use application, the market encompasses dairy products, fruit juices & nectars, plant-based beverages, liquid foods, and other applications. Regionally, the market is divided into North America, Europe, Asia Pacific, Latin America, Middle East & Africa, and other regions.
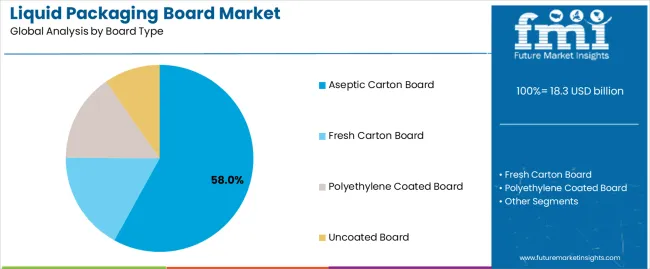
The aseptic carton board segment is projected to account for 58% of the liquid packaging board market in 2025, reaffirming its position as the leading material category. Businesses and beverage manufacturers increasingly utilize aseptic carton board for their superior shelf stability characteristics, established sterilization compatibility, and essential functionality in ambient distribution applications across multiple product categories. Aseptic carton board standardized barrier characteristics and proven long-life performance directly address user requirements for reliable product protection and optimal packaging value in commercial applications.
This material segment forms the foundation of modern liquid packaging board adoption patterns, as it represents the format with the greatest distribution flexibility potential and established compatibility across multiple filling technologies. Business investments in aseptic processing equipment and barrier optimization continue to strengthen adoption among efficiency-conscious manufacturers. With users prioritizing extended shelf life and ambient storage capability, aseptic carton board aligns with both economic objectives and performance requirements, making them the central component of comprehensive beverage packaging strategies.
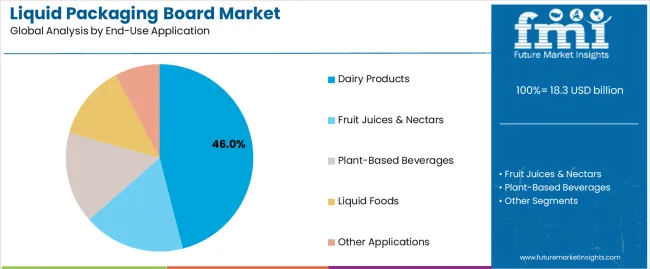
Dairy products segment is projected to represent 46% of the liquid packaging board market in 2025, underscoring its critical role as the primary application for quality-focused businesses seeking superior product preservation benefits and enhanced consumer convenience credentials. Commercial users and dairy brands prefer dairy applications for their established consumption patterns, proven market acceptance, and ability to maintain exceptional hygiene profiles while supporting versatile product offerings during diverse retail experiences. Positioned as essential applications for discerning manufacturers, dairy offerings provide both market penetration excellence and brand positioning advantages.
The segment is supported by continuous improvement in barrier enhancement technology and the widespread availability of established food safety frameworks that enable regulatory compliance and premium positioning at the consumer level. Additionally, dairy companies are optimizing carton designs to support market differentiation and accessible pricing strategies. As packaging technology continues to advance and consumers seek convenient consumption formats, dairy applications will continue to drive market growth while supporting brand recognition and consumer loyalty strategies.
The liquid packaging board market is advancing rapidly due to increasing packaging efficiency consciousness and growing need for renewable container choices that emphasize superior barrier performance outcomes across beverage segments and liquid food applications. However, the market faces challenges, including competition from plastic bottles, concerns about moisture sensitivity, and raw material price volatility affecting production economics. Innovation in fiber sourcing practices and advanced coating systems continues to influence market development and expansion patterns.
The growing adoption of liquid packaging board in plant-based milk alternatives and non-dairy beverage packaging is enabling businesses to develop distribution patterns that provide distinctive product positioning benefits while commanding consumer acceptance positioning and enhanced convenience characteristics. Plant-based beverage applications provide superior ambient storage properties while allowing more sophisticated graphic design features across various product categories. Users are increasingly recognizing the functional advantages of liquid packaging board positioning for premium product protection and efficiency-conscious distribution integration.
Modern liquid packaging board manufacturers are incorporating advanced fiber sourcing technologies, renewable material certification, and responsible forestry management systems to enhance environmental credentials, improve resource efficiency outcomes, and meet commercial demands for transparent packaging solutions. These systems improve material effectiveness while enabling new applications, including chain-of-custody certification and traceability programs. Advanced fiber integration also allows manufacturers to support environmental leadership positioning and regulatory compliance beyond traditional packaging operations.
| Country | CAGR (2025-2035) |
|---|---|
| USA | 6.9% |
| Germany | 6.4% |
| UK | 6.2% |
| China | 9.2% |
| Japan | 5.8% |
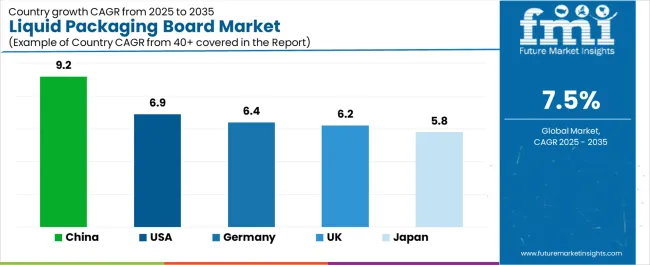
The liquid packaging board market is experiencing robust growth globally, with China leading at a 9.2% CAGR through 2035, driven by the expanding beverage industry, growing dairy consumption, and increasing adoption of packaged liquid products. The USA follows at 6.9%, supported by rising convenience packaging trends, expanding cold chain infrastructure, and growing acceptance of carton-based container solutions. Germany shows growth at 6.4%, emphasizing established paper manufacturing capabilities and comprehensive packaging development. The UK records 6.2%, focusing on premium beverage goods and distribution expansion. Japan demonstrates 5.8% growth, prioritizing quality packaging solutions and technological advancement.
The report covers an in-depth analysis of 40+ countries, the top-performing countries are highlighted below.
Revenue from liquid packaging board consumption and sales in the USA is projected to exhibit exceptional growth with a CAGR of 6.9% through 2035, driven by the country's rapidly expanding ready-to-drink beverage sector, favorable consumer attitudes toward convenient packaging, and initiatives promoting renewable material optimization across major production regions. The USA's position as a leading beverage market and increasing focus on fiber-based packaging development are creating substantial demand for high-quality liquid packaging board in both commercial and specialty markets. Major beverage brands and dairy producers are establishing comprehensive carton capabilities to serve growing demand and emerging market opportunities.
Revenue from liquid packaging board products in Germany is expanding at a CAGR of 6.4%, supported by rising packaging sophistication, growing beverage industry requirements, and expanding carton manufacturing infrastructure. The country's developing paper industry capabilities and increasing commercial investment in advanced coating technologies are driving demand for liquid packaging board across both imported and domestically produced applications. International packaging companies and domestic carton manufacturers are establishing comprehensive operational networks to address growing market demand for quality liquid packaging board and efficient container solutions.
Revenue from liquid packaging board products in the UK is projected to grow at a CAGR of 6.2% through 2035, supported by the country's mature beverage market, established distribution culture, and leadership in packaging standards. Britain's sophisticated supply chain infrastructure and strong support for renewable materials are creating steady demand for both traditional and innovative liquid packaging board varieties. Leading beverage brands and specialty dairy producers are establishing comprehensive operational strategies to serve both domestic markets and growing export opportunities.
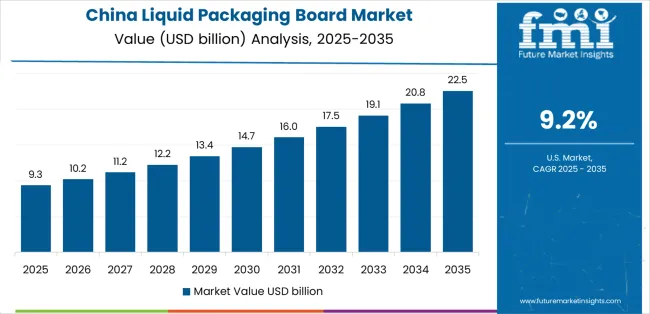
Revenue from liquid packaging board products in China is projected to grow at a CAGR of 9.2% through 2035, driven by the country's emphasis on beverage expansion, manufacturing leadership, and sophisticated production capabilities for containers requiring specialized material varieties. Chinese manufacturers and distributors consistently seek commercial-grade packaging that enhances product differentiation and supports retail operations for both traditional and innovative beverage applications. The country's position as an Asian manufacturing leader continues to drive innovation in specialty liquid packaging board applications and commercial production standards.
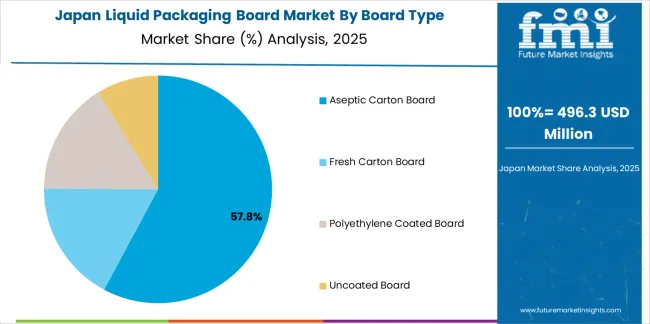
Revenue from liquid packaging board products in Japan is projected to grow at a CAGR of 5.8% through 2035, supported by the country's emphasis on quality manufacturing, packaging standards, and advanced technology integration requiring efficient container solutions. Japanese businesses and beverage brands prioritize material performance and manufacturing precision, making liquid packaging board essential packaging for both traditional and modern product applications. The country's comprehensive quality excellence and advancing packaging patterns support continued market expansion.
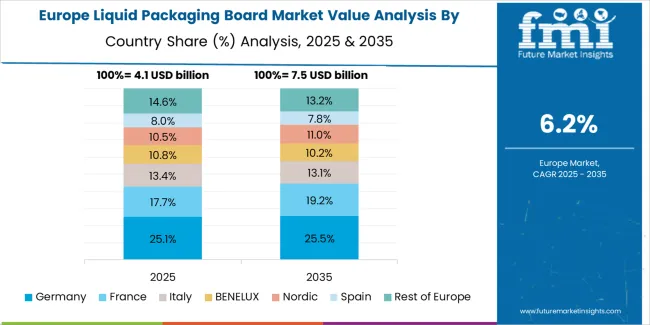
The Europe liquid packaging board market is projected to grow from USD 5.9 billion in 2025 to USD 11.6 billion by 2035, recording a CAGR of 7.0% over the forecast period. Germany leads the region with a 35.0% share in 2025, moderating slightly to 34.5% by 2035, supported by its strong paper manufacturing base and demand for premium, technically advanced carton products. The United Kingdom follows with 20.0% in 2025, easing to 19.5% by 2035, driven by a sophisticated beverage market and emphasis on renewable material and efficiency standards. France accounts for 17.5% in 2025, rising to 18.0% by 2035, reflecting steady adoption of aseptic packaging solutions and distribution optimization. Italy holds 13.0% in 2025, expanding to 13.8% by 2035 as dairy innovation and specialty beverage applications grow. Spain contributes 8.5% in 2025, growing to 9.0% by 2035, supported by expanding juice sector and packaged liquid handling. The Nordic countries rise from 4.5% in 2025 to 4.7% by 2035 on the back of strong renewable material adoption and advanced barrier technologies. BENELUX remains at 1.5% share across both 2025 and 2035, reflecting mature, efficiency-focused markets.
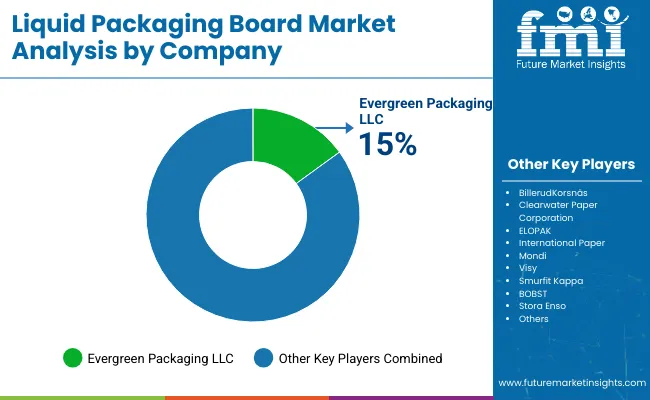
The liquid packaging board market is characterized by competition among established paper manufacturers, specialized carton producers, and integrated packaging solution companies. Companies are investing in coating technologies, advanced fiber formulation systems, product innovation capabilities, and comprehensive distribution networks to deliver consistent, high-quality, and reliable liquid packaging board systems. Innovation in barrier enhancement, moisture resistance methods, and application-specific product development is central to strengthening market position and customer satisfaction.
Tetra Pak International S.A. leads the market with a strong focus on aseptic packaging innovation and comprehensive liquid packaging board solutions, offering commercial carton systems with emphasis on manufacturing excellence and technological heritage. Evergreen Packaging LLC provides specialized gable-top carton capabilities with a focus on fresh dairy applications and material engineering networks. SIG Combibloc Group AG delivers integrated aseptic packaging solutions with a focus on beverage positioning and operational efficiency. Elopak AS specializes in comprehensive pure-pak carton manufacturing with an emphasis on renewable material applications. Stora Enso Oyj focuses on comprehensive fiber-based board production with advanced coating and premium positioning capabilities.
The success of liquid packaging board in meeting commercial packaging demands, consumer-driven convenience requirements, and performance integration will not only enhance product protection outcomes but also strengthen global packaging manufacturing capabilities. It will consolidate emerging regions' positions as hubs for efficient carton production and align advanced economies with commercial packaging systems. This calls for a concerted effort by all stakeholders -- governments, industry bodies, manufacturers, distributors, and investors. Each can be a crucial enabler in preparing the market for its next phase of growth.
How Governments Could Spur Local Production and Adoption?
How Industry Bodies Could Support Market Development?
How Distributors and Beverage Industry Players Could Strengthen the Ecosystem?
How Manufacturers Could Navigate the Shift?
| Items | Values |
|---|---|
| Quantitative Units (2025) | USD 18.3 billion |
| Board Type | Aseptic Carton Board, Fresh Carton Board, Polyethylene Coated Board, Uncoated Board |
| Coating Material | Polyethylene Coating, Aluminum Foil Lamination, Biopolymer Coating, Other Coatings |
| Capacity | Below 250ml, 250ml-500ml, 500ml-1L, Above 1L |
| End-Use Application | Dairy Products, Fruit Juices & Nectars, Plant-Based Beverages, Liquid Foods, Other Applications |
| Regions Covered | North America, Europe, Asia Pacific, Latin America, Middle East & Africa, Other Regions |
| Countries Covered | United States, Germany, United Kingdom, China, Japan, and 40+ countries |
| Key Companies Profiled | Tetra Pak International S.A., Evergreen Packaging LLC, SIG Combibloc Group AG, Elopak AS, Stora Enso Oyj, and other leading liquid packaging board companies |
| Additional Attributes | Dollar sales by board type, coating material, capacity, end-use application, and region; regional demand trends, competitive landscape, technological advancements in barrier coating engineering, fiber optimization initiatives, moisture resistance enhancement programs, and premium product development strategies |
The global liquid packaging board market is estimated to be valued at USD 18.3 billion in 2025.
The market size for the liquid packaging board market is projected to reach USD 37.7 billion by 2035.
The liquid packaging board market is expected to grow at a 7.5% CAGR between 2025 and 2035.
The key product types in liquid packaging board market are aseptic carton board, fresh carton board, polyethylene coated board and uncoated board.
In terms of end-use application, dairy products segment to command 46.0% share in the liquid packaging board market in 2025.


Full Research Suite comprises of:
Market outlook & trends analysis
Interviews & case studies
Strategic recommendations
Vendor profiles & capabilities analysis
5-year forecasts
8 regions and 60+ country-level data splits
Market segment data splits
12 months of continuous data updates
DELIVERED AS:
PDF EXCEL ONLINE
Market Share Breakdown of Liquid Packaging Board Manufacturers
Liquid Oxygen Generator Market Size and Share Forecast Outlook 2025 to 2035
Liquid Desiccant Natural Gas Dehydration Unit Market Size and Share Forecast Outlook 2025 to 2035
Liquid Filled Pressure Gauges Market Size and Share Forecast Outlook 2025 to 2035
Liquid Filtration Market Size and Share Forecast Outlook 2025 to 2035
Liquid Filled Capsule Market Size and Share Forecast Outlook 2025 to 2035
Liquid Density Meters Market Size and Share Forecast Outlook 2025 to 2035
Liquid Cold Plates Market Size and Share Forecast Outlook 2025 to 2035
Liquid Crystal Polymers Market Size and Share Forecast Outlook 2025 to 2035
Liquid Embolic Agent Market Size and Share Forecast Outlook 2025 to 2035
Liquid Hydrogen Market Size and Share Forecast Outlook 2025 to 2035
Liquid Cooled Home Standby Gensets Market Size and Share Forecast Outlook 2025 to 2035
Liquid Nitrogen Purge Systems Market Size and Share Forecast Outlook 2025 to 2035
Liquid Chromatography Systems Market Size and Share Forecast Outlook 2025 to 2035
Liquid Armor Materials Market Size and Share Forecast Outlook 2025 to 2035
Liquid Synthetic Rubber Market Size and Share Forecast Outlook 2025 to 2035
Liquid Crystal Polymer (LCP) Market Size and Share Forecast Outlook 2025 to 2035
Liquid Smoke Market Analysis - Size, Share, and Forecast Outlook 2025 to 2035
Liquid-Tight Flexible Non-Metallic Conduit Market Size and Share Forecast Outlook 2025 to 2035
Liquid Hand Soap Market Size and Share Forecast Outlook 2025 to 2035

Thank you!
You will receive an email from our Business Development Manager. Please be sure to check your SPAM/JUNK folder too.
Chat With
MaRIA