Liquid Filled Capsule Market Size and Share Forecast Outlook (2024 to 2034)

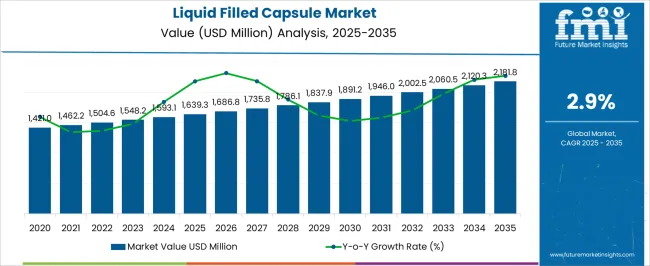
The global liquid filled capsule market is expected to rise at a CAGR of 2.9% in the forecast period 2024 to 2034. The market value is projected to increase from USD 1,587.1 million in 2024 to USD 2,113.9 million in 2034. The liquid filled capsule market was valued at USD 1,548.2 million in 2023.

Attributes Key Insights
Base Value, 2023 USD 1,548.2 million
Estimated Global Liquid Filled Capsule Market Size (2024E) USD 1,587.1 million
Projected Liquid Filled Capsule Market Value (2034F) USD 2,113.9 million
Value-based CAGR (2024 to 2034) 2.9%

Growing consumer attention on health & wellness and general awareness of the benefits of dietary supplements and healthier lifestyles are propelling the market. Liquid capsule formulations are easier to swallow and absorb more quickly in the body than tablet formulations. Hence, liquid-filled capsules are becoming increasingly popular as dietary supplements in the nutraceutical industry.

The production of liquid-filled capsules is now consistent and efficient due to advancements in precision and automation in modern encapsulation machines. This guarantees consistent dosage and quality of capsules.

The market for liquid capsule-filling machines is further expected to surge due to rising healthcare costs, population growth, and adoption of liquid filled capsules. The machines' low maintenance requirements and rising disposable income are anticipated to help fuel the market value.

Other factors influencing liquid-filled capsule market expansion include the growing requirement for product standardization, the need for acceptable hygiene, and the increasing use of automated & sophisticated technology. Furthermore, the market for liquid capsule-filled capsules is projected to rise due to ongoing technological advancements.

Sales Analysis of Liquid Filled Capsule Market (2019 to 2023) vs Forecast (2024 to 2034)

The global liquid-filled capsule market recorded a historical CAGR of 2.5% from 2019 to 2023. In 2023, the market attained a valuation of USD 1,548.2 million.

The market for liquid-filled capsules has grown as a result of the expansion of the nutraceutical industry. Vitamins, minerals, and other nutritional supplements are frequently delivered in liquid-filled capsule form, which is in line with the rising consumer interest in health & wellness.

Improvements in encapsulation techniques and quality control procedures, among other advancements in capsule manufacturing technology, have increased the productivity and dependability of creating liquid-filled capsules. By achieving quality requirements and enhancing production capacities, this has helped the market to flourish.

Liquid-filled capsules have become widely used due to the requirement for specific drug delivery methods and the movement toward personalized medicine. These capsules provide customization in terms of dosages, combinations, and release profiles to cater to the specific needs of each patient.

Higher-quality liquid-filled capsules have resulted from improvements in the accuracy and efficiency of the encapsulation process brought about by advancements in capsule manufacturing technologies. The use of substitute materials for capsule shells has increased, particularly to satisfy the needs of vegetarian and vegan customers. Alternatives to conventional gelatin, such as plant-based gelatin, are gaining traction in the market.

Lucrative Opportunities Driving Growth in the Liquid Filled Capsule Industry

  • To boost sales, producers of liquid-filled capsules are broadening their product offerings, such as vegan liquid-filled capsules, with improved features like faster disintegration and greater resistance to stomach acids.
  • Companies are manufacturing diverse types of vegetarian liquid-filled capsules, such as pullulan, starch, and HPMC capsules. This is projected to result in greater product personalization in the nutraceutical, pharmaceutical, and cosmeceutical industries, which is estimated to be a lucrative opportunity for manufacturers.
  • Several companies are limiting their product portfolio to hard and soft gelatin capsules. They are set to expect incremental growth opportunities if these companies expand their product portfolio with liquid-filled capsules, vegetarian capsules, and other plant-sourced gelatin capsules.

Top Market Trends in the Liquid Filled Capsule Sector

  • The need for novel drug delivery systems, such as liquid-filled capsules, has been fueled by the expansion of the pharmaceutical and nutraceutical industries.
  • For medications and supplements where bioavailability is a crucial component, liquid-filled capsules are preferred by consumers.
  • Personalized medicine is becoming very popular, and liquid-filled capsules offer a practical and adaptable means of delivering particular medication dosages or combinations.
  • The formulation of liquid-filled capsules has been influenced by consumer preferences for natural and plant-based products, focusing on employing sustainable and natural components.
  • Specialized liquid-filled capsules with controlled release characteristics, stability, and extended shelf life have been made possible by improvements in capsule production technology and formulations.

Key Restraints Impacting the Liquid Filled Capsule Industry

  • The price of raw materials is set to affect the final cost of producing liquid-filled capsules, particularly if they are specialized or alternative capsule materials.
  • Compared to conventional solid dosage forms, producing liquid-filled capsules is estimated to be more complex, which is set to provide manufacturing difficulties.
  • Getting new formulations approved and meeting strict regulatory criteria is anticipated to take time, which is anticipated to delay the release of liquid-filled capsule products.
  • Liquid formulations are set to be more prone to problems with stability, like the deterioration of active components over time. Stimulating the stability and long shelf life of liquid-filled capsules is projected to be difficult.

Analysis of Top Countries Manufacturing, Certifying, and Operating Liquid Filled Capsules

The table below shows the estimated growth rates of the top five countries. Japan, China, and India are set to record high CAGRs of 7.4%, 7.0%, and 5.7%, respectively, through 2034.

Countries Value CAGR
United States 3.7%
China 7.0%
India 5.7%
Japan 7.4%
Germany 4.8%

Favorable Regulatory Environment Attracting Manufacturers in the United States

The United States dominated the global market with a 33.3% share in 2023. The regulatory environment in the United States significantly impacts the liquid-filled capsule market.

The Food and Drug Administration (FDA) of the United States established stringent regulatory standards for pharmaceuticals and healthcare products. The regulatory framework ensures that drugs and dosage forms, including liquid-filled capsules, are safe, effective, and high quality.

Consumers and healthcare professionals have confidence in the safety and quality of pharmaceutical products because of the FDA's rigorous approval process and adherence to Good Manufacturing Practices (GMP). The United States' reputation for manufacturing high-quality pharmaceuticals is attributed to its strong regulatory framework, which draws domestic and foreign pharmaceutical companies to invest in and support the market.

Rising demand has been witnessed in the United States nutraceutical market, driven by product innovation and less stringent regulatory hurdles than those mandated for the pharmaceutical industry in other Western economies. Hence, the growing demand in the nutraceutical space is expected to drive the market for liquid filled capsules in the forecast period.

Growing Demand for Pharmaceutical Products in China to Gain Traction

China has implemented extensive healthcare reforms to increase the quality of medical care, easy access to healthcare services, and foster innovation in the pharmaceutical industry. The demand for pharmaceutical products, particularly innovative drug delivery systems like liquid-filled capsules, is rising.

It is due to the expansion of healthcare coverage and focus on preventative care. Pharmaceutical firms in China are launching novel dosage forms to address the changing demands of the populace regarding healthcare.

Rising Investment in Research and Development to Propel the Market in India

In India, the cost-effectiveness of manufacturing pharmaceutical products, including liquid-filled capsules, is a key factor influencing the market. India is renowned for its ability to produce innovative capsule delivery systems and generic medications at a low cost of production.

The cost benefits in the market result from cheaper labor, accessible raw materials, and effective production methods. India-based pharmaceutical companies are making significant research and development investments to expand their product lines and provide cutting-edge dosage forms, such as liquid-filled capsules, at competitive pricing.

Increasing Pharmaceutical Regulations in Japan to Play a Key Role in the Market

Japan’s pharmaceutical industry increasingly uses cutting-edge drug delivery techniques to improve patient compliance and medication efficacy. For certain formulations, liquid-filled capsules are estimated to be the better option.

Pharmaceutical regulations in Japan are quite stringent. Companies involved in the liquid-filled capsule business must abide by these rules.

Consumers typically prioritize safe and high-quality products in Japan. To achieve consumer expectations, manufacturers in the liquid-filled capsule market must guarantee product quality, stability, and adherence to safety regulations.

Growing Use of Cutting-edge Technology in Germany to Spur Market by 2034

Germany’s liquid filled capsule market is positively influenced by cutting-edge technologies in capsule manufacturing. Manufacturers are enhancing encapsulation procedures and quality control techniques to guarantee product quality and consistency of their product in the market.

Sustainability of the environment is a key priority among companies in Germany. Companies in the liquid-filled capsule market are directing toward eco-friendly packaging solutions and materials to comply with the nation's environmental objectives.

Liquid Filled Capsule Industry Analysis by Top Investment Segments

The below section shows the softgel capsule segment dominating by product type. It is expected to surge at a CAGR of 2.7% by 2034. Based on raw material, the gelatin segment is anticipated to hold the dominant share through 2024. It is projected to rise at a CAGR of 2.6% through 2034.

Segment Value CAGR
Gelatin (Raw Material) 2.6%
Pharmaceutical Companies (End-user) 2.1%
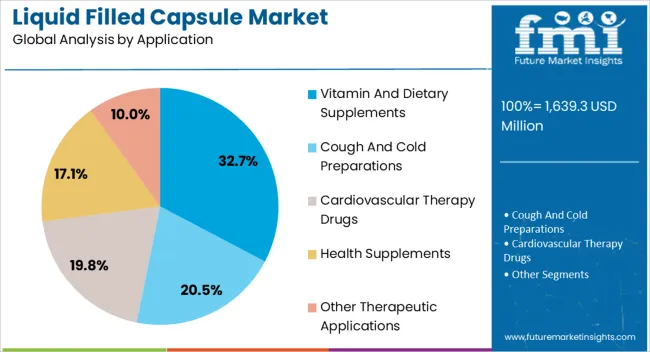
Vitamin and Dietary Supplements (Application) 2.1%
Softgel Capsules (Products) 2.7%

Softgel Capsules to Hold Prominent Market Share Through 2034

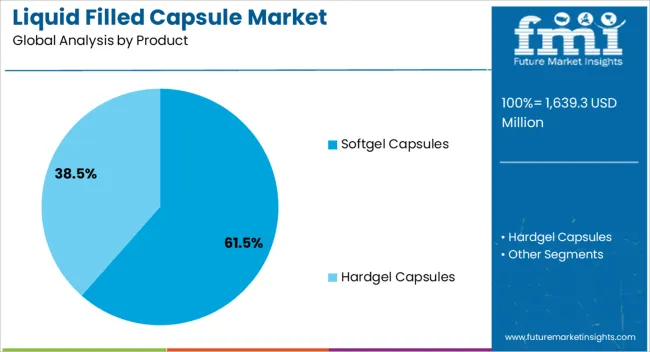
Softgel capsules dominated the global market with a 67.6% market share in 2023. Softgel capsules provide improved bioavailability, ease of swallowing, and compatibility with several formulations. Consumers favor softgel capsules due to their smooth texture and perceived effectiveness, which makes them a popular option for pharmaceutical, nutraceutical, and cosmetic products.

Softgel capsules also offer efficient packaging that shields the contents from outside influences like moisture and light. This enhances the encapsulated product's stability and shelf life. Consumers are expected to find softgel capsules simpler to swallow than tablets or hard capsules, which is anticipated to drive softgel capsule sales.

Gelatin Segment to Lead the Raw Material Category in the Market

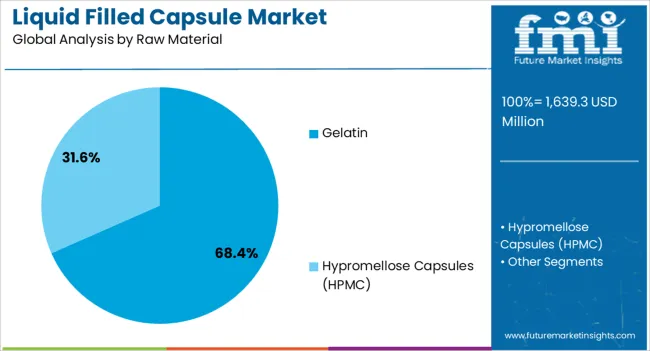
Gelatin dominated the global market with a 73.4% market share in 2023. The segment is projected to continue experiencing high growth throughout the forecast period.

The key ingredient used in producing liquid filled capsules is gelatin made from animal collagen. Gelatin contributes to the liquid-filled capsules' stability and longer shelf life by acting as an efficient barrier to shield the encapsulated substance from external influences.

With the rise of vegan trend, consumers are looking for vegan alternatives to liquid filled capsules made from gelatin. Manufacturers are adopting alternatives such as hydroxypropyl methylcellulose (HPMC) to accommodate consumers' dietary requirements.
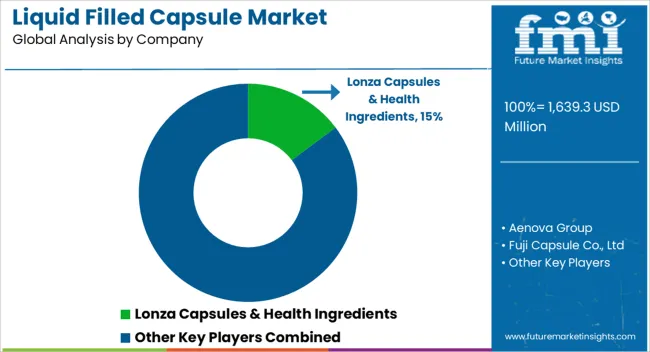
Competitive Landscape of the Liquid Filled Capsule Market

The market for liquid filled capsules is quite fragmented with several leading competitors. Key players are directed toward growth strategies such as partnerships, collaborations, product launches, acquisitions, and mergers to satisfy customer demand and grow their clientele.

For instance,

  • In April 2022, Aenova constructed a new capsule/structure for highly potent active substances at Regensburg.
  • In March 2021, Scholle IPN acquired Bossar Packaging Pvt. Ltd, a United States-based manufacturer of bag-in-box packaging products.

Scope and Coverage of the Liquid Filled Capsule Market Report

Attribute Details
Estimated Value (2024) USD 1,587.1 million
Projected Value (2034) USD 2,113.9 million
Anticipated Growth Rate (2024 to 2034) 2.9%
Forecast Period 2024 to 2034
Historical Data Available for 2019 to 2023
Market Analysis USD million for Value
Key Regions Covered North America; Latin America; South Asia and Pacific; East Asia; Western Europe; Eastern Europe; Middle East and Africa
Key Countries Covered United States, Canada, Mexico, Brazil, Chile, China, Japan, South Korea, India, Association of Southeast Asian Nations, Australia and New Zealand, Germany, Italy, France, United Kingdom, Spain, BENELUX, Nordic Countries, Russia, Hungary, Poland, Saudi Arabia, Türkiye, South Africa, Other African Union.
Key Market Segments Covered Product, Raw Material, Application, End-user, and Region
Key Companies Profiled Lonza Capsules & Health Ingredients; Aenova Group; Fuji Capsule Co., Ltd; Catalent, Inc.; EuroCaps Ltd; Guangdong Yichao Biotechnology Co., Ltd.; Captek Softgel International Inc.; Soft Gel Technologies Inc.; Thermo Fisher Scientific Inc. (Patheon); Delpharm Evreux; Curtis Health Caps; CapsCanada; Altasciences; Fermentis Life Sciences; ACG; Sunil Healthcare Limited; Ascendia Pharmaceuticals; LIQUIDCAPSULE MANUFACTURING LLC; SMPNutra.com
Report Coverage Market Forecast, Competition Intelligence, Drivers, Restraints, Opportunities, Trends Analysis, Market Dynamics and Challenges, Strategic Growth Initiatives

Top Segments Studied in the Liquid Filled Capsule Market

By Product:

  • Hardgel Capsules
  • Softgel Capsules

By Raw Material:

  • Gelatin
  • Hypromellose Capsules (HPMC)

By Application:

  • Cough and Cold Preparations
  • Cardiovascular Therapy Drugs
  • Health Supplements
  • Vitamin and Dietary Supplements
  • Other Therapeutic Applications

By End-user:

  • Pharmaceutical Companies
  • Nutraceutical Companies
  • Cosmeceutical Companies
  • Contract Manufacturing Organizations

By Region:

  • North America
  • Latin America
  • East Asia
  • South Asia and Pacific
  • Western Europe
  • Eastern Europe
  • Middle East and Africa

Table of Content

  • 1. Executive Summary
  • 2. Market Overview
  • 3. Key Market Trends
  • 4. Value Added Insights
  • 5. Market Background
  • 6. Global Market Demand (in Value or Size in USD million) Analysis 2019 to 2023 and Forecast, 2024 to 2034
  • 7. Global Market Analysis 2019 to 2023 and Forecast 2024 to 2034, By Product
    • 7.1. Hardgel Capsules
    • 7.2. Softgel Capsules
  • 8. Global Market Analysis 2019 to 2023 and Forecast 2024 to 2034, By Raw Material
    • 8.1. Gelatin
    • 8.2. Hypromellose Capsules (HPMC)
  • 9. Global Market Analysis 2019 to 2023 and Forecast 2024 to 2034, By Application
    • 9.1. Cough and Cold Preparations
    • 9.2. Cardiovascular Therapy Drugs
    • 9.3. Health Supplements
    • 9.4. Vitamin and Dietary Supplements
    • 9.5. Other Therapeutic Applications
  • 10. Global Market Analysis 2019 to 2023 and Forecast 2024 to 2034, By End-user
    • 10.1. Pharmaceutical Companies
    • 10.2. Nutraceutical Companies
    • 10.3. Cosmeceutical Companies
    • 10.4. Contract Manufacturing Organizations
  • 11. Global Market Analysis 2019 to 2023 and Forecast 2024 to 2034, By Region
    • 11.1. North America
    • 11.2. Latin America
    • 11.3. East Asia
    • 11.4. South Asia and Pacific
    • 11.5. Western Europe
    • 11.6. Eastern Europe
    • 11.7. Middle East and Africa
  • 12. North America Market Analysis 2019 to 2023 and Forecast 2024 to 2034
  • 13. Latin America Market Analysis 2019 to 2023 and Forecast 2024 to 2034
  • 14. East Asia Market Analysis 2019 to 2023 and Forecast 2024 to 2034
  • 15. South Asia and Pacific Market Analysis 2019 to 2023 and Forecast 2024 to 2034
  • 16. Western Europe Market Analysis 2019 to 2023 and Forecast 2024 to 2034
  • 17. Eastern Europe Market Analysis 2019 to 2023 and Forecast 2024 to 2034
  • 18. Middle East and Africa Market Analysis 2019 to 2023 and Forecast 2024 to 2034
  • 19. Market Structure Analysis
  • 20. Competition Analysis
    • 20.1. Lonza Capsules & Health Ingredients
    • 20.2. Aenova Group
    • 20.3. Fuji Capsule Co., Ltd
    • 20.4. Catalent, Inc
    • 20.5. EuroCaps Ltd
    • 20.6. Guangdong Yichao Biotechnology Co., Ltd.
    • 20.7. Captek Softgel International Inc.
    • 20.8. Soft Gel Technologies Inc.
    • 20.9. Thermo Fisher Scientific Inc. (Patheon)
    • 20.10. Delpharm Evreux
    • 20.11. Curtis Health Caps
    • 20.12. CapsCanada
    • 20.13. Altasciences
    • 20.14. Fermentis Life Sciences
    • 20.15. ACG
    • 20.16. Sunil Healthcare Limited
    • 20.17. Ascendia Pharmaceuticals
    • 20.18. LIQUIDCAPSULE MANUFACTURING LLC
    • 20.19. SMPNutra.com
  • 21. Assumptions and Acronyms Used
  • 22. Research Methodology

List of Tables

Table 01: Global Market Value (US$ million) Analysis and Forecast 2019 to 2034, by Product

Table 02: Global Market Value (US$ million) Analysis and Forecast 2019 to 2034, by Raw Material

Table 03: Global Market Value (US$ million) Analysis and Forecast 2019 to 2034, by Application

Table 04: Global Market Value (US$ million) Analysis and Forecast 2019 to 2034, by End-user

Table 05: North America Market Value (US$ million) Analysis 2019 to 2023 and Forecast 2024 to 2034, by Country

Table 06: North America Market Value (US$ million) Analysis and Forecast 2019 to 2034, by Product

Table 07: North America Market Value (US$ million) Analysis and Forecast 2019 to 2034, by Raw Material

Table 08: North America Market Value (US$ million) Analysis and Forecast 2019 to 2034, by Application

Table 09: North America Market Value (US$ million) Analysis and Forecast 2019 to 2034, by End-user

Table 10: Latin America Market Value (US$ million) Analysis 2019 to 2023 and Forecast 2024 to 2034, by Country

Table 11: Latin America Market Value (US$ million) Analysis and Forecast 2019 to 2034, by Product

Table 12: Latin America Market Value (US$ million) Analysis and Forecast 2019 to 2034, by Raw Material

Table 13: Latin America Market Value (US$ million) Analysis and Forecast 2019 to 2034, by Application

Table 14: Latin America Market Value (US$ million) Analysis and Forecast 2019 to 2034, by End-user

Table 15: East Asia Market Value (US$ million) Analysis 2019 to 2023 and Forecast 2024 to 2034, by Country

Table 16: East Asia Market Value (US$ million) Analysis and Forecast 2019 to 2034, by Product

Table 17: East Asia Market Value (US$ million) Analysis and Forecast 2019 to 2034, by Raw Material

Table 18: East Asia Market Value (US$ million) Analysis and Forecast 2019 to 2034, by Application

Table 19: East Asia Market Value (US$ million) Analysis and Forecast 2019 to 2034, by End-user

Table 20: South Asia and Pacific Market Value (US$ million) Analysis 2019 to 2023 and Forecast 2024 to 2034, by Country

Table 21: South Asia and Pacific Market Value (US$ million) Analysis and Forecast 2019 to 2034, by Product

Table 22: South Asia and Pacific Market Value (US$ million) Analysis and Forecast 2019 to 2034, by Raw Material

Table 23: South Asia and Pacific Market Value (US$ million) Analysis and Forecast 2019 to 2034, by Application

Table 24: South Asia and Pacific Market Value (US$ million) Analysis and Forecast 2019 to 2034, by End-user

Table 25: Western Europe Market Value (US$ million) Analysis 2019 to 2023 and Forecast 2024 to 2034, by Country

Table 26: Western Europe Market Value (US$ million) Analysis and Forecast 2019 to 2034, by Product

Table 27: Western Europe Market Value (US$ million) Analysis and Forecast 2019 to 2034, by Raw Material

Table 28: Western Europe Market Value (US$ million) Analysis and Forecast 2019 to 2034, by Application

Table 29: Western Europe Market Value (US$ million) Analysis and Forecast 2019 to 2034, by End-user

Table 30: Eastern Europe Market Value (US$ million) Analysis 2019 to 2023 and Forecast 2024 to 2034, by Country

Table 31: Eastern Europe Market Value (US$ million) Analysis and Forecast 2019 to 2034, by Product

Table 32: Eastern Europe Market Value (US$ million) Analysis and Forecast 2019 to 2034, by Raw Material

Table 33: Eastern Europe Market Value (US$ million) Analysis and Forecast 2019 to 2034, by Application

Table 34: Eastern Europe Market Value (US$ million) Analysis and Forecast 2019 to 2034, by End-user

Table 35: Middle East and Africa Market Value (US$ million) Analysis 2019 to 2023 and Forecast 2024 to 2034, by Country

Table 36: Middle East and Africa Market Value (US$ million) Analysis and Forecast 2019 to 2034, by Product

Table 37: Middle East and Africa Market Value (US$ million) Analysis and Forecast 2019 to 2034, by Raw Material

Table 38: Middle East and Africa Market Value (US$ million) Analysis and Forecast 2019 to 2034, by Application

Table 39: Middle East and Africa Market Value (US$ million) Analysis and Forecast 2019 to 2034, by End-user

List of Figures

Figure 1: Global Market Value (US$ million) Analysis, 2019 to 2023

Figure 2: Global Market Forecast and Y-o-Y Growth, 2024 to 2034

Figure 3: Global Market Absolute $ Opportunity (US$ million) Analysis, 2023 to 2034

Figure 4: Global Market Value Share (%) Analysis 2023 to 2034, by Product

Figure 5: Global Market Y-o-Y Growth (%) Analysis 2024 to 2034, by Product

Figure 6: Global Market Attractiveness Analysis 2024 to 2034, by Product

Figure 7: Global Market Value Share (%) Analysis 2023 to 2034, by Raw Material

Figure 8: Global Market Y-o-Y Growth (%) Analysis 2024 to 2034, by Raw Material

Figure 9: Global Market Attractiveness Analysis 2024 to 2034, by Raw Material

Figure 10: Global Market Value Share (%) Analysis 2023 to 2034, by Application

Figure 11: Global Market Y-o-Y Growth (%) Analysis 2024 to 2034, by Application

Figure 12: Global Market Attractiveness Analysis 2024 to 2034, by Application

Figure 13: Global Market Value Share (%) Analysis 2023 to 2034, by End-user

Figure 14: Global Market Y-o-Y Growth (%) Analysis 2024 to 2034, by End-user

Figure 15: Global Market Attractiveness Analysis 2024 to 2034, by End-user

Figure 16: Global Market Value Share (%) Analysis 2023 to 2034, by Region

Figure 17: Global Market Y-o-Y Growth (%) Analysis 2024 to 2034, by Region

Figure 18: Global Market Attractiveness Analysis 2024 to 2034, by Region

Figure 19: North America Market Value (US$ million) Analysis, 2019 to 2023

Figure 20: North America Market Value (US$ million) Forecast, 2024 to 2034

Figure 21: North America Market Value Share, by Product (2024 E)

Figure 22: North America Market Value Share, by Raw Material (2024 E)

Figure 23: North America Market Value Share, by Application (2024 E)

Figure 24: North America Market Value Share, by End-user (2024 E)

Figure 25: North America Market Value Share, by Country (2024 E)

Figure 26: North America Market Attractiveness Analysis by Product, 2024 to 2034

Figure 27: North America Market Attractiveness Analysis by Raw Material, 2024 to 2034

Figure 28: North America Market Attractiveness Analysis by Application, 2024 to 2034

Figure 29: North America Market Attractiveness Analysis by End-user, 2024 to 2034

Figure 30: North America Market Attractiveness Analysis by Country, 2024 to 2034

Figure 31: United States Market Value Proportion Analysis, 2023

Figure 32: Global Vs. United States Growth Comparison, 2024 to 2034

Figure 33: United States Market Share Analysis (%) by Product, 2024 to 2034

Figure 34: United States Market Share Analysis (%) by Raw Material, 2024 to 2034

Figure 35: United States Market Share Analysis (%) by Application, 2024 to 2034

Figure 36: United States Market Share Analysis (%) by End-user, 2024 to 2034

Figure 37: Canada Market Value Proportion Analysis, 2023

Figure 38: Global Vs. Canada. Growth Comparison, 2024 to 2034

Figure 39: Canada Market Share Analysis (%) by Product, 2024 to 2034

Figure 40: Canada Market Share Analysis (%) by Raw Material, 2024 to 2034

Figure 41: Canada Market Share Analysis (%) by Application, 2024 to 2034

Figure 42: Canada Market Share Analysis (%) by End-user, 2024 to 2034

Figure 43: Mexico Market Value Proportion Analysis, 2023

Figure 44: Global Vs. Mexico Growth Comparison, 2024 to 2034

Figure 45: Mexico Market Share Analysis (%) by Product, 2024 to 2034

Figure 46: Mexico Market Share Analysis (%) by Raw Material, 2024 to 2034

Figure 47: Mexico Market Share Analysis (%) by Application, 2024 to 2034

Figure 48: Mexico Market Share Analysis (%) by End-user, 2024 to 2034

Figure 49: Latin America Market Value (US$ million) Analysis, 2019 to 2023

Figure 50: Latin America Market Value (US$ million) Forecast, 2024 to 2034

Figure 51: Latin America Market Value Share, by Product (2024 E)

Figure 52: Latin America Market Value Share, by Raw Material (2024 E)

Figure 53: Latin America Market Value Share, by Application (2024 E)

Figure 54: Latin America Market Value Share, by End-user (2024 E)

Figure 55: Latin America Market Value Share, by Country (2024 E)

Figure 56: Latin America Market Attractiveness Analysis by Product, 2024 to 2034

Figure 57: Latin America Market Attractiveness Analysis by Raw Material, 2024 to 2034

Figure 58: Latin America Market Attractiveness Analysis by Application, 2024 to 2034

Figure 59: Latin America Market Attractiveness Analysis by End-user, 2024 to 2034

Figure 60: Latin America Market Attractiveness Analysis by Country, 2024 to 2034

Figure 61: Brazil Market Value Proportion Analysis, 2023

Figure 62: Global Vs. Brazil. Growth Comparison, 2024 to 2034

Figure 63: Brazil Market Share Analysis (%) by Product, 2024 to 2034

Figure 64: Brazil Market Share Analysis (%) by Raw Material, 2024 to 2034

Figure 65: Brazil Market Share Analysis (%) by Application, 2024 to 2034

Figure 66: Brazil Market Share Analysis (%) by End-user, 2024 to 2034

Figure 67: Chile Market Value Proportion Analysis, 2023

Figure 68: Global Vs. Chile Growth Comparison, 2024 to 2034

Figure 69: Chile Market Share Analysis (%) by Product, 2024 to 2034

Figure 70: Chile Market Share Analysis (%) by Raw Material, 2024 to 2034

Figure 71: Chile Market Share Analysis (%) by Application, 2024 to 2034

Figure 72: Chile Market Share Analysis (%) by End-user, 2024 to 2034

Figure 73: East Asia Market Value (US$ million) Analysis, 2019 to 2023

Figure 74: East Asia Market Value (US$ million) Forecast, 2024 to 2034

Figure 75: East Asia Market Value Share, by Product (2024 E)

Figure 76: East Asia Market Value Share, by Raw Material (2024 E)

Figure 77: East Asia Market Value Share, by Application (2024 E)

Figure 78: East Asia Market Value Share, by End-user (2024 E)

Figure 79: East Asia Market Value Share, by Country (2024 E)

Figure 80: East Asia Market Attractiveness Analysis by Product, 2024 to 2034

Figure 81: East Asia Market Attractiveness Analysis by Raw Material, 2024 to 2034

Figure 82: East Asia Market Attractiveness Analysis by Application, 2024 to 2034

Figure 83: East Asia Market Attractiveness Analysis by End-user, 2024 to 2034

Figure 84: East Asia Market Attractiveness Analysis by Country, 2024 to 2034

Figure 85: China Market Value Proportion Analysis, 2023

Figure 86: Global Vs. China Growth Comparison, 2024 to 2034

Figure 87: China Market Share Analysis (%) by Product, 2024 to 2034

Figure 88: China Market Share Analysis (%) by Raw Material, 2024 to 2034

Figure 89: China Market Share Analysis (%) by Application, 2024 to 2034

Figure 90: China Market Share Analysis (%) by End-user, 2024 to 2034

Figure 91: Japan Market Value Proportion Analysis, 2023

Figure 92: Global Vs. Japan Growth Comparison, 2024 to 2034

Figure 93: Japan Market Share Analysis (%) by Product, 2024 to 2034

Figure 94: Japan Market Share Analysis (%) by Raw Material, 2024 to 2034

Figure 95: Japan Market Share Analysis (%) by Application, 2024 to 2034

Figure 96: Japan Market Share Analysis (%) by End-user, 2024 to 2034

Figure 97: South Korea Market Value Proportion Analysis, 2023

Figure 98: Global Vs South Korea Growth Comparison, 2024 to 2034

Figure 99: South Korea Market Share Analysis (%) by Product, 2024 to 2034

Figure 100: South Korea Market Share Analysis (%) by Raw Material, 2024 to 2034

Figure 101: South Korea Market Share Analysis (%) by Application, 2024 to 2034

Figure 102: South Korea Market Share Analysis (%) by End-user, 2024 to 2034

Figure 103: South Asia and Pacific Market Value (US$ million) Analysis, 2019 to 2023

Figure 104: South Asia and Pacific Market Value (US$ million) Forecast, 2024 to 2034

Figure 105: South Asia and Pacific Market Value Share, by Product (2024 E)

Figure 106: South Asia and Pacific Market Value Share, by Raw Material (2024 E)

Figure 107: South Asia and Pacific Market Value Share, by Application (2024 E)

Figure 108: South Asia and Pacific Market Value Share, by End-user (2024 E)

Figure 109: South Asia and Pacific Market Value Share, by Country (2024 E)

Figure 110: South Asia and Pacific Market Attractiveness Analysis by Product, 2024 to 2034

Figure 111: South Asia and Pacific Market Attractiveness Analysis by Raw Material, 2024 to 2034

Figure 112: South Asia and Pacific Market Attractiveness Analysis by Application, 2024 to 2034

Figure 113: South Asia and Pacific Market Attractiveness Analysis by End-user, 2024 to 2034

Figure 114: South Asia and Pacific Market Attractiveness Analysis by Country, 2024 to 2034

Figure 115: India Market Value Proportion Analysis, 2023

Figure 116: Global Vs. India Growth Comparison, 2024 to 2034

Figure 117: India Market Share Analysis (%) by Product, 2024 to 2034

Figure 118: India Market Share Analysis (%) by Raw Material, 2024 to 2034

Figure 119: India Market Share Analysis (%) by Application, 2024 to 2034

Figure 120: India Market Share Analysis (%) by End-user, 2024 to 2034

Figure 121: ASEAN Countries Market Value Proportion Analysis, 2023

Figure 122: Global Vs. ASEAN Countries Growth Comparison, 2024 to 2034

Figure 123: ASEAN Countries Market Share Analysis (%) by Product, 2024 to 2034

Figure 124: ASEAN Countries Market Share Analysis (%) by Raw Material, 2024 to 2034

Figure 125: ASEAN Countries Market Share Analysis (%) by Application, 2024 to 2034

Figure 126: ASEAN Countries Market Share Analysis (%) by End-user, 2024 to 2034

Figure 127: Australia and New Zealand Market Value Proportion Analysis, 2023

Figure 128: Global Vs. Australia and New Zealand Growth Comparison, 2024 to 2034

Figure 129: Australia and New Zealand Market Share Analysis (%) by Product, 2024 to 2034

Figure 130: Australia and New Zealand Market Share Analysis (%) by Raw Material, 2024 to 2034

Figure 131: Australia and New Zealand Market Share Analysis (%) by Application, 2024 to 2034

Figure 132: Australia and New Zealand Market Share Analysis (%) by End-user, 2024 to 2034

Figure 133: Western Europe Market Value (US$ million) Analysis, 2019 to 2023

Figure 134: Western Europe Market Value (US$ million) Forecast, 2024 to 2034

Figure 135: Western Europe Market Value Share, by Product (2024 E)

Figure 136: Western Europe Market Value Share, by Raw Material (2024 E)

Figure 137: Western Europe Market Value Share, by Application (2024 E)

Figure 138: Western Europe Market Value Share, by End-user (2024 E)

Figure 139: Western Europe Market Value Share, by Country (2024 E)

Figure 140: Western Europe Market Attractiveness Analysis by Product, 2024 to 2034

Figure 141: Western Europe Market Attractiveness Analysis by Raw Material, 2024 to 2034

Figure 142: Western Europe Market Attractiveness Analysis by Application, 2024 to 2034

Figure 143: Western Europe Market Attractiveness Analysis by End-user, 2024 to 2034

Figure 144: Western Europe Market Attractiveness Analysis by Country, 2024 to 2034

Figure 145: United Kingdom Market Value Proportion Analysis, 2023

Figure 146: Global Vs. United Kingdom Growth Comparison, 2024 to 2034

Figure 147: United Kingdom Market Share Analysis (%) by Product, 2024 to 2034

Figure 148: United Kingdom Market Share Analysis (%) by Raw Material, 2024 to 2034

Figure 149: United Kingdom Market Share Analysis (%) by Application, 2024 to 2034

Figure 150: United Kingdom Market Share Analysis (%) by End-user, 2024 to 2034

Figure 151: Germany Market Value Proportion Analysis, 2023

Figure 152: Global Vs. Germany Growth Comparison, 2024 to 2034

Figure 153: Germany Market Share Analysis (%) by Product, 2024 to 2034

Figure 154: Germany Market Share Analysis (%) by Raw Material, 2024 to 2034

Figure 155: Germany Market Share Analysis (%) by Application, 2024 to 2034

Figure 156: Germany Market Share Analysis (%) by End-user, 2024 to 2034

Figure 157: Italy Market Value Proportion Analysis, 2023

Figure 158: Global Vs. Italy Growth Comparison, 2024 to 2034

Figure 159: Italy Market Share Analysis (%) by Product, 2024 to 2034

Figure 160: Italy Market Share Analysis (%) by Raw Material, 2024 to 2034

Figure 161: Italy Market Share Analysis (%) by Application, 2024 to 2034

Figure 162: Italy Market Share Analysis (%) by End-user, 2024 to 2034

Figure 163: France Market Value Proportion Analysis, 2023

Figure 164: Global Vs France Growth Comparison, 2024 to 2034

Figure 165: France Market Share Analysis (%) by Product, 2024 to 2034

Figure 166: France Market Share Analysis (%) by Raw Material, 2024 to 2034

Figure 167: France Market Share Analysis (%) by Application, 2024 to 2034

Figure 168: France Market Share Analysis (%) by End-user, 2024 to 2034

Figure 169: Spain Market Value Proportion Analysis, 2023

Figure 170: Global Vs Spain Growth Comparison, 2024 to 2034

Figure 171: Spain Market Share Analysis (%) by Product, 2024 to 2034

Figure 172: Spain Market Share Analysis (%) by Raw Material, 2024 to 2034

Figure 173: Spain Market Share Analysis (%) by Application, 2024 to 2034

Figure 174: Spain Market Share Analysis (%) by End-user, 2024 to 2034

Figure 175: Nordic Countries Market Value Proportion Analysis, 2023

Figure 176: Global Vs Nordic Countries Growth Comparison, 2024 to 2034

Figure 177: Nordic Countries Market Share Analysis (%) by Product, 2024 to 2034

Figure 178: Nordic Countries Market Share Analysis (%) by Raw Material, 2024 to 2034

Figure 179: Nordic Countries Market Share Analysis (%) by Application, 2024 to 2034

Figure 180: Nordic Countries Market Share Analysis (%) by End-user, 2024 to 2034

Figure 181: BENELUX Market Value Proportion Analysis, 2023

Figure 182: Global Vs BENELUX Growth Comparison, 2024 to 2034

Figure 183: BENELUX Market Share Analysis (%) by Product, 2024 to 2034

Figure 184: BENELUX Market Share Analysis (%) by Raw Material, 2024 to 2034

Figure 185: BENELUX Market Share Analysis (%) by Application, 2024 to 2034

Figure 186: BENELUX Market Share Analysis (%) by End-user, 2024 to 2034

Figure 187: Eastern Europe Market Value (US$ million) Analysis, 2019 to 2023

Figure 188: Eastern Europe Market Value (US$ million) Forecast, 2024 to 2034

Figure 189: Eastern Europe Market Value Share, by Product (2024 E)

Figure 190: Eastern Europe Market Value Share, by Raw Material (2024 E)

Figure 191: Eastern Europe Market Value Share, by Application (2024 E)

Figure 192: Eastern Europe Market Value Share, by End-user (2024 E)

Figure 193: Eastern Europe Market Value Share, by Country (2024 E)

Figure 194: Eastern Europe Market Attractiveness Analysis by Product, 2024 to 2034

Figure 195: Eastern Europe Market Attractiveness Analysis by Raw Material, 2024 to 2034

Figure 196: Eastern Europe Market Attractiveness Analysis by Application, 2024 to 2034

Figure 197: Eastern Europe Market Attractiveness Analysis by End-user, 2024 to 2034

Figure 198: Eastern Europe Market Attractiveness Analysis by Country, 2024 to 2034

Figure 199: Russia Market Value Proportion Analysis, 2023

Figure 200: Global Vs. Russia Growth Comparison, 2024 to 2034

Figure 201: Russia Market Share Analysis (%) by Product, 2024 to 2034

Figure 202: Russia Market Share Analysis (%) by Raw Material, 2024 to 2034

Figure 203: Russia Market Share Analysis (%) by Application, 2024 to 2034

Figure 204: Russia Market Share Analysis (%) by End-user, 2024 to 2034

Figure 205: Hungary Market Value Proportion Analysis, 2023

Figure 206: Global Vs Hungary Growth Comparison, 2024 to 2034

Figure 207: Hungary Market Share Analysis (%) by Product, 2024 to 2034

Figure 208: Hungary Market Share Analysis (%) by Raw Material, 2024 to 2034

Figure 209: Hungary Market Share Analysis (%) by Application, 2024 to 2034

Figure 210: Hungary Market Share Analysis (%) by End-user, 2024 to 2034

Figure 211: Poland Market Value Proportion Analysis, 2023

Figure 212: Global Vs Poland Growth Comparison, 2024 to 2034

Figure 213: Poland Market Share Analysis (%) by Product, 2024 to 2034

Figure 214: Poland Market Share Analysis (%) by Raw Material, 2024 to 2034

Figure 215: Poland Market Share Analysis (%) by Application, 2024 to 2034

Figure 216: Poland Market Share Analysis (%) by End-user, 2024 to 2034

Figure 217: Middle East and Africa Market Value (US$ million) Analysis, 2019 to 2023

Figure 218: Middle East and Africa Market Value (US$ million) Forecast, 2024 to 2034

Figure 219: Middle East and Africa Market Value Share, by Product (2024 E)

Figure 220: Middle East and Africa Market Value Share, by Raw Material (2024 E)

Figure 221: Middle East and Africa Market Value Share, by Application (2024 E)

Figure 222: Middle East and Africa Market Value Share, by End-user (2024 E)

Figure 223: Middle East and Africa Market Value Share, by Country (2024 E)

Figure 224: Middle East and Africa Market Attractiveness Analysis by Product, 2024 to 2034

Figure 225: Middle East and Africa Market Attractiveness Analysis by Raw Material, 2024 to 2034

Figure 226: Middle East and Africa Market Attractiveness Analysis by Application, 2024 to 2034

Figure 227: Middle East and Africa Market Attractiveness Analysis by End-user, 2024 to 2034

Figure 228: Middle East and Africa Market Attractiveness Analysis by Country, 2024 to 2034

Figure 229: Saudi Arabia Market Value Proportion Analysis, 2023

Figure 230: Global Vs Saudi Arabia Growth Comparison, 2024 to 2034

Figure 231: Saudi Arabia Market Share Analysis (%) by Product, 2024 to 2034

Figure 232: Saudi Arabia Market Share Analysis (%) by Raw Material, 2024 to 2034

Figure 233: Saudi Arabia Market Share Analysis (%) by Application, 2024 to 2034

Figure 234: Saudi Arabia Market Share Analysis (%) by End-user, 2024 to 2034

Figure 235: Türkiye Market Value Proportion Analysis, 2023

Figure 236: Global Vs. Türkiye Growth Comparison, 2024 to 2034

Figure 237: Türkiye Market Share Analysis (%) by Product, 2024 to 2034

Figure 238: Türkiye Market Share Analysis (%) by Raw Material, 2024 to 2034

Figure 239: Türkiye Market Share Analysis (%) by Application, 2024 to 2034

Figure 240: Türkiye Market Share Analysis (%) by End-user, 2024 to 2034

Figure 241: South Africa Market Value Proportion Analysis, 2023

Figure 242: Global Vs. South Africa Growth Comparison, 2024 to 2034

Figure 243: South Africa Market Share Analysis (%) by Product, 2024 to 2034

Figure 244: South Africa Market Share Analysis (%) by Raw Material, 2024 to 2034

Figure 245: South Africa Market Share Analysis (%) by Application, 2024 to 2034

Figure 246: South Africa Market Share Analysis (%) by End-user, 2024 to 2034

Figure 247: Other African Union Market Value Proportion Analysis, 2023

Figure 248: Global Vs Other African Union Growth Comparison, 2024 to 2034

Figure 249: Other African Union Market Share Analysis (%) by Product, 2024 to 2034

Figure 250: Other African Union Market Share Analysis (%) by Raw Material, 2024 to 2034

Figure 251: Other African Union Market Share Analysis (%) by Application, 2024 to 2034

Figure 252: Other African Union Market Share Analysis (%) by End-user, 2024 to 2034

Frequently Asked Questions

How big was the global market in 2023?

The market was valued at USD 1,548.2 million in 2023.

What is the global market’s projected value for 2034?

The global market is set to reach a valuation of USD 2,113.9 million in 2034.

Which product segment contributes more to the liquid filled capsule market?

The softgel capsules segment held 67.6% share of the global market in 2022.

What was the last 8 years’ CAGR for the global market?

Demand in the global market increased at a 2.5% CAGR from 2019 to 2023.

What value is the global market estimated to reach by 2024?

The global market is estimated to reach around USD 1,587.1 million by 2024.

What is the United States market outlook?

The United States accounted for a 33.3% share of the global market in 2023.

Explore Similar Insights

Future Market Insights

Liquid Filled Capsule Market