Liquid Filled Pressure Gauges Market Forecast and Outlook (2025-2035)

The global liquid filled pressure gauges market is valued at USD 564.1 million in 2025 and is projected to reach USD 901.6 million by 2035, recording an absolute increase of USD 337.5 million. This reflects a total growth of 59.8%, with expansion at a CAGR of 4.8% during the assessment period, taking the market nearly 1.6X higher. Growth patterns are expected to vary regionally, shaped by industrial base, infrastructure modernization, and regulatory compliance for pressure monitoring systems across diverse industries.

In North America, demand will be sustained by a strong industrial automation ecosystem, particularly in chemical processing, oil refining, and pharmaceuticals. The United States will continue to lead adoption, supported by stringent safety standards, refinery expansions, and higher precision requirements in advanced manufacturing. Replacement of conventional gauges with liquid-filled variants offering enhanced vibration resistance and extended service life will also reinforce market uptake.

Europe is expected to contribute significantly through modernization of manufacturing facilities, rising compliance with ISO and EU safety standards, and broader use of process instrumentation in petrochemical and metallurgy applications. Germany, France, and the UK will drive regional growth, while ongoing investment in renewable energy and hydrogen-based infrastructure creates new opportunities for specialized gauges in high-pressure environments.

Asia-Pacific will remain the most dynamic growth hub, driven by large-scale industrial expansion in China, India, and Southeast Asia. The surge in chemical plants, steel production units, and pharmaceuticals manufacturing facilities will ensure sustained demand. Additionally, the region’s push toward export-oriented industries requires compliance with global safety benchmarks, further strengthening adoption of reliable and vibration-resistant gauges. The rapid buildout of infrastructure projects also adds to installation needs.

Latin America and the Middle East & Africa will witness incremental but steady growth, fueled by oil & gas sector projects, mining activities, and downstream processing investments. Brazil, Mexico, and GCC countries will anchor demand, particularly where petroleum refining and heavy industrial facilities necessitate durable pressure monitoring solutions.

Quick Stats for Liquid Filled Pressure Gauges Market

  • Liquid Filled Pressure Gauges Market Value (2025): USD 564.1 million
  • Liquid Filled Pressure Gauges Market Forecast Value (2035): USD 901.6 million
  • Liquid Filled Pressure Gauges Market Forecast CAGR: 4.80%
  • Leading Product Category in Liquid Filled Pressure Gauges Market: Glycerin Filled (42.3%)
  • Key Growth Regions in Liquid Filled Pressure Gauges Market: Asia Pacific, North America, Europe
  • Key Players in Liquid Filled Pressure Gauges Market: WIKA, Yokogawa, S.M. Gauge Company Ltd, McDaniel Controls, General Instruments

Between 2025 and 2030, the liquid filled pressure gauges market is projected to expand from USD 564.1 million to USD 720.4 million, resulting in a value increase of USD 156.3 million, which represents 46.3% of the total forecast growth for the decade. This phase of development will be shaped by increasing demand for precision measurement instrumentation, rising industrial process automation enabling advanced monitoring techniques, and growing availability of specialized filling liquids across chemical processing operations and petroleum refining facilities.

Between 2030 and 2035, the liquid filled pressure gauges market is forecast to grow from USD 720.4 million to USD 901.6 million, adding another USD 181.2 million, which constitutes 53.7% of the overall ten-year expansion. This period is expected to be characterized by the advancement of digital integration capabilities, the incorporation of IoT connectivity for remote monitoring, and the development of premium corrosion-resistant varieties across diverse industrial applications. The growing emphasis on process optimization and measurement accuracy will drive demand for advanced gauge varieties with enhanced durability characteristics, improved temperature stability, and superior performance profiles.

Between 2020 and 2024, the liquid filled pressure gauges market experienced steady growth, driven by increasing industrial automation requirements and growing recognition of liquid-filled technology's effectiveness in delivering stable pressure readings across harsh industrial environments and high-vibration applications. The liquid filled pressure gauges market developed as manufacturers recognized the potential for advanced filling solutions to deliver measurement precision while meeting modern requirements for equipment reliability and long-term operational performance. Technological advancement in filling liquid formulations and gauge construction design began emphasizing the critical importance of maintaining measurement accuracy while enhancing vibration damping and improving instrument longevity.

Liquid Filled Pressure Gauges Market Key Takeaways

Metric Value
Estimated Value in (2025E) USD 564.1 million
Forecast Value in (2035F) USD 901.6 million
Forecast CAGR (2025 to 2035) 4.80%

From 2030 to 2035, the liquid filled pressure gauges market is forecast to grow from USD 720.4 million to USD 901.6 million, adding another USD 181.2 million, which constitutes 53.7% of the overall ten-year expansion. This period is expected to be characterized by the advancement of digital pressure monitoring integration, the incorporation of smart calibration systems for measurement precision, and the development of specialized filling formulations for enhanced temperature compensation. The growing emphasis on measurement reliability and operational efficiency will drive demand for premium varieties with enhanced chemical compatibility credentials, improved pressure range options, and superior accuracy characteristics.

Between 2020 and 2024, the liquid filled pressure gauges market experienced robust growth, driven by increasing awareness of measurement stability benefits and growing recognition of liquid-filled systems' effectiveness in supporting reliable monitoring operations across industrial facilities and process control applications. The liquid filled pressure gauges market developed as users recognized the potential for specialized filling liquids to deliver performance advantages while meeting modern requirements for consistent pressure indication and dependable instrument operation. Technological advancement in filling liquid chemistry and sealing technology began emphasizing the critical importance of maintaining measurement stability while extending instrument service life and improving customer satisfaction across diverse industrial applications.

Why is the Liquid Filled Pressure Gauges Market Growing?

Market expansion is being supported by the increasing global demand for accurate pressure measurement solutions and the corresponding shift toward high-performance instrumentation that can provide superior operational characteristics while meeting user requirements for measurement reliability and cost-effective maintenance processes. Modern industrial operators are increasingly focused on incorporating gauge systems that can enhance process control while satisfying demands for consistent, precisely calibrated pressure readings and optimized equipment monitoring practices. Liquid filled pressure gauges' proven ability to deliver measurement accuracy, vibration dampening, and diverse application possibilities makes them essential components for process engineers and quality-conscious industrial professionals.

The growing emphasis on process automation and equipment optimization is driving demand for high-performance measurement systems that can support distinctive monitoring outcomes and comprehensive process protection across chemical processing, petroleum refining, pharmaceutical manufacturing, and metallurgical applications. User preference for gauges that combine functional excellence with operational durability is creating opportunities for innovative implementations in both traditional and emerging industrial applications. The rising influence of automated process control and advanced monitoring technologies is also contributing to increased adoption of specialized gauges that can provide authentic performance benefits and reliable measurement characteristics.

Segmental Analysis

The liquid filled pressure gauges market is segmented by product type, application, filling liquid type, pressure range, accuracy class, and region. By product type, the liquid filled pressure gauges market is divided into glycerin-filled, silicone oil-filled, water-filled, synthetic oil-filled, and others. Based on application, the liquid filled pressure gauges market is categorized into the chemicals industry, the petroleum industry, the pharmaceuticals industry, the metallurgy industry, the food & beverage industry, and others. By filling liquid type, the liquid filled pressure gauges market includes glycerin-based liquids, silicone-based liquids, mineral oil-based liquids, and specialty synthetic liquids. By pressure range, the liquid filled pressure gauges market encompasses low pressure (0-100 PSI), medium pressure (100-1000 PSI), high pressure (1000-5000 PSI), and ultra-high pressure (above 5000 PSI). By accuracy class, the market includes Class 1.0, Class 1.6, Class 2.5, and specialty precision grades. Regionally, the market is divided into North America, Europe, Asia Pacific, Latin America, the Middle East & Africa, and other regions.
By Product Type, the Glycerin Filled Segment Accounts for 42.3% Market Share

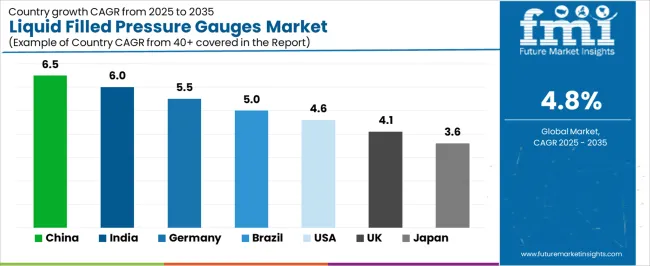
Liquid Filled Pressure Gauges Market Cagr Analysis By Country

The glycerin filled segment is projected to account for 42.3% of the liquid filled pressure gauges market in 2025, reaffirming its position as the leading product category. Industrial operators and process engineers increasingly utilize glycerin filled gauges for their superior vibration dampening characteristics, established temperature stability, and essential functionality in diverse industrial applications across multiple process environments. Glycerin filled gauges' proven performance characteristics and established cost-effectiveness directly address user requirements for reliable pressure measurement and optimal process monitoring in industrial applications.

This product segment forms the foundation of modern pressure measurement patterns, as it represents the filling solution with the greatest application versatility and established compatibility across multiple industrial systems. Business investments in advanced glycerin formulation technology and performance optimization continue to strengthen adoption among precision-conscious operators. With users prioritizing measurement stability and equipment longevity, glycerin filled gauges align with both accuracy objectives and reliability requirements, making them the central component of comprehensive process monitoring strategies.
By Application, Chemicals Industry Segment Shows Strong Market Dominance

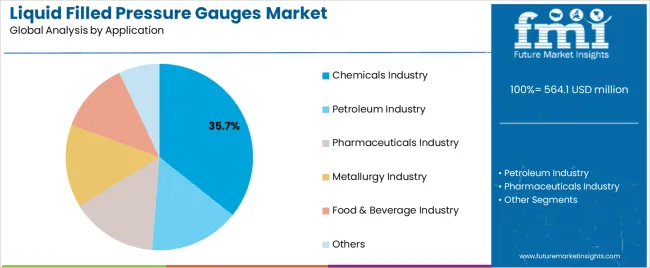
Liquid Filled Pressure Gauges Market Analysis By Application

Chemicals industry is projected to represent 35.7% of the liquid filled pressure gauges market in 2025, underscoring its critical role as the primary application for quality-focused manufacturers seeking superior measurement reliability benefits and enhanced process control credentials. Chemical processors and industrial professionals prefer chemical applications for their established process requirements, proven measurement demand, and ability to maintain exceptional accuracy while supporting versatile monitoring requirements during diverse chemical operations. Positioned as essential applications for performance-conscious operators, chemical offerings provide both operational excellence and process optimization advantages.

The segment is supported by continuous improvement in pressure measurement technology and the widespread availability of established process standards that enable quality assurance and premium positioning at the industrial level. Chemical companies are optimizing gauge selections to support process differentiation and operational efficiency strategies. As measurement technology continues to advance and operators seek reliable monitoring methods, chemical applications will continue to drive market growth while supporting process development and operational excellence strategies.

What are the Drivers, Restraints, and Key Trends of the Liquid Filled Pressure Gauges Market?

The liquid filled pressure gauges market is advancing rapidly due to increasing process control consciousness and growing need for precision measurement solutions that emphasize superior performance outcomes across industrial segments and manufacturing applications. The liquid filled pressure gauges market faces challenges, including competition from digital measurement technologies, filling liquid maintenance complexities, and component cost pressures affecting operational economics. Innovation in smart sensor integration and advanced filling materials continues to influence market development and expansion patterns.

Expansion of Industrial Automation and Process Control Applications

The growing adoption of liquid filled pressure gauges in automated processes and advanced control systems is enabling operators to develop monitoring strategies that provide distinctive accuracy benefits while commanding competitive positioning and enhanced process optimization characteristics. Industrial applications provide superior measurement consistency while allowing more sophisticated control features across various process categories. Users are increasingly recognizing the operational advantages of liquid-filled positioning for premium monitoring outcomes and efficiency-conscious process integration.

Integration of Digital Monitoring and Smart Measurement Systems

Modern liquid filled pressure gauge manufacturers are incorporating advanced sensor technologies, digital output systems, and automated calibration tracking to enhance measurement precision, improve equipment reliability, and meet industrial demands for intelligent monitoring solutions. These systems improve operational effectiveness while enabling new applications, including predictive maintenance programs and process optimization protocols. Advanced sensor integration also allows operators to support performance leadership positioning and quality assurance beyond traditional pressure measurement operations.

Analysis of the Liquid Filled Pressure Gauges Market by Key Country

Liquid Filled Pressure Gauges Market Cagr Analysis By Country

Country CAGR (2025-2035)
China 6.5%
India 6%
Germany 5.5%
Brazil 5%
USA 4.6%
UK 4.1%
Japan 3.6%

The liquid filled pressure gauges market is experiencing robust growth globally, with China leading at a 6.5% CAGR through 2035, driven by the expanding manufacturing sector, growing industrial automation requirements, and increasing adoption of precision measurement systems. India follows at 6%, supported by rising industrial development, expanding chemical processing sector, and growing acceptance of advanced monitoring solutions. Germany shows growth at 5.5%, emphasizing established engineering capabilities and comprehensive measurement technology development. Brazil records 5%, focusing on industrial expansion and process automation growth. The USA demonstrates 4.6% growth, prioritizing advanced measurement technologies and process optimization.

The report covers an in-depth analysis of 40+ countries, top-performing countries are highlighted below.

China Leads Global Market Growth with Industrial Expansion

Revenue from liquid filled pressure gauges consumption and sales in China is projected to exhibit exceptional growth with a CAGR of 6.5% through 2035, driven by the country's rapidly expanding manufacturing sector, favorable government policies toward industrial modernization, and initiatives promoting advanced measurement technologies across major industrial regions. China's position as a leading manufacturing hub and increasing focus on automated process control systems are creating substantial demand for high-quality liquid filled pressure gauges in both domestic and export markets. Major industrial companies and equipment manufacturers are establishing comprehensive measurement capabilities to serve growing demand and emerging market opportunities.

  • Established industrial development culture and expanding manufacturing practices are driving demand for liquid filled pressure gauges across chemical plants, petroleum facilities, and comprehensive process systems throughout Chinese industrial markets.
  • Strong manufacturing infrastructure and technology adoption initiatives are supporting the rapid adoption of premium liquid filled pressure gauges among quality-conscious operators seeking to meet evolving performance standards and accuracy requirements.

India Demonstrates Strong Market Potential with Manufacturing Focus

Revenue from liquid filled pressure gauges products in India is expanding at a CAGR of 6%, supported by rising industrial investment, growing manufacturing development, and expanding process control capabilities. The country's developing chemical sector and increasing industrial investment in advanced measurement technologies are driving demand for liquid filled pressure gauges across both traditional and modern industrial applications. International equipment companies and domestic manufacturers are establishing comprehensive operational networks to address growing market demand for quality gauges and reliable measurement solutions.

  • Rising industrial investment and expanding manufacturing activity are creating opportunities for liquid filled pressure gauge adoption across chemical operations, modern industrial projects, and manufacturing companies throughout major Indian industrial regions.
  • Growing infrastructure development initiatives and measurement technology advancement are driving the adoption of gauge products and services among domestic operators seeking to enhance their process capabilities and meet increasing accuracy demand.

Germany Maintains Market Leadership with Engineering Excellence

Revenue from liquid filled pressure gauges products in Germany is projected to grow at a CAGR of 5.5% through 2035, supported by the country's mature industrial sector, established measurement standards, and leadership in instrumentation technology. Germany's sophisticated manufacturing infrastructure and strong support for advanced process control systems are creating steady demand for both traditional and innovative gauge varieties. Leading equipment manufacturers and specialty suppliers are establishing comprehensive operational strategies to serve both domestic markets and growing export opportunities.

  • Advanced manufacturing capabilities and established industrial markets are driving demand for premium liquid filled pressure gauges across automotive facilities, chemical processors, and comprehensive industrial companies seeking superior functionality profiles and technical innovation.
  • Strong engineering excellence culture and industrial leadership are supporting the adoption of innovative gauges among users prioritizing measurement reliability and operational precision in process applications.

Brazil Strengthens Position with Industrial Growth

Revenue from liquid filled pressure gauges products in Brazil is projected to grow at a CAGR of 5% through 2035, driven by the country's emphasis on industrial expansion, manufacturing development, and growing process control capabilities. Brazilian manufacturers and industrial companies consistently seek commercial-grade gauges that enhance process efficiency and support operational excellence for both traditional and modern measurement applications. The country's position as a Latin American industrial leader continues to drive innovation in specialized gauge applications and commercial equipment standards.

  • Expanding industrial culture and growing manufacturing markets are driving demand for commercial liquid filled pressure gauges across chemical processors, petroleum facilities, and manufacturing-focused outlets seeking superior performance and distinctive measurement profiles.
  • Increasing focus on process efficiency and industrial measurement systems is supporting the adoption of specialty gauge varieties among manufacturers and distributors seeking authentic Brazilian industrial products in regional markets with established quality expertise.

USA Anchors Growth with Technology Integration

Revenue from liquid filled pressure gauges products in the USA is projected to grow at a CAGR of 4.6% through 2035, supported by the country's emphasis on measurement technology advancement, process optimization, and advanced automation integration requiring efficient gauge solutions. American manufacturers and industrial users prioritize performance reliability and measurement precision, making specialized gauges essential components for both traditional and modern process applications. The country's comprehensive technology leadership and advancing industrial patterns support continued market expansion.

  • Advanced technology capabilities and growing precision measurement are driving demand for liquid filled pressure gauges across specialty applications, modern industrial formats, and technology-integrated process programs serving domestic markets with increasing functionality requirements.
  • Strong focus on operational optimization and measurement excellence is encouraging manufacturers and distributors to adopt gauge solutions that support efficiency objectives and meet American quality standards for process applications.

UK Maintains Steady Growth with Quality Focus

Revenue from liquid filled pressure gauges products in the UK is projected to grow at a CAGR of 4.1% through 2035, supported by established measurement standards, mature industrial markets, and emphasis on equipment reliability across manufacturing and process sectors. British manufacturers and industrial professionals prioritize quality performance and operational consistency, creating steady demand for premium gauge solutions. The country's comprehensive market maturity and established industrial practices support continued development in specialized applications.
  • Established industrial markets and mature manufacturing industry are driving demand for quality liquid filled pressure gauges across process facilities, maintenance operations, and professional industrial companies throughout British manufacturing regions.
  • Strong emphasis on quality standards and operational reliability is supporting the adoption of premium gauge varieties among manufacturers seeking proven performance and established quality credentials in measurement applications.

Japan Demonstrates Precision-Focused Growth

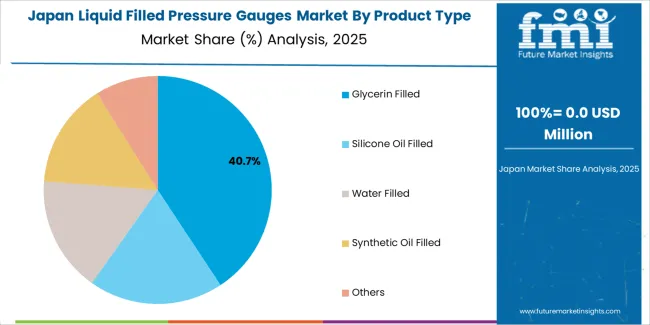
Liquid Filled Pressure Gauges Market Japan Market Share Analysis By Product Type

Revenue from liquid filled pressure gauges products in Japan is projected to grow at a CAGR of 3.6% through 2035, supported by the country's emphasis on precision manufacturing, quality excellence, and advanced technology integration requiring efficient gauge solutions. Japanese businesses and industrial users prioritize technical performance and manufacturing precision, making specialized gauges essential components for both traditional and modern process applications. The country's comprehensive quality leadership and advancing industrial patterns support continued market expansion.

  • Advanced manufacturing technology capabilities and growing precision measurement applications are driving demand for liquid filled pressure gauges across specialty industrial applications, modern production formats, and technology-integrated process programs serving domestic markets with increasing quality requirements.
  • Strong focus on technical precision and manufacturing excellence is encouraging businesses and distributors to adopt gauge solutions that support quality objectives and meet Japanese precision standards for measurement applications.

Europe Market Split by Country

The Europe liquid filled pressure gauges market is projected to grow from USD 185.2 million in 2025 to USD 287.5 million by 2035, recording a CAGR of 4.5% over the forecast period. Germany leads the region with a 36.4% share in 2025, moderating slightly to 35.9% by 2035, supported by its strong industrial base and demand for premium, technically advanced measurement instrumentation. The United Kingdom follows with 23.8% in 2025, easing to 23.4% by 2035, driven by a mature manufacturing sector and emphasis on equipment reliability and measurement precision. France accounts for 15.7% in 2025, rising to 16.2% by 2035, reflecting steady adoption of automated process control solutions and operational efficiency enhancement. Italy holds 11.9% in 2025, expanding to 12.5% by 2035 as chemical processing and industrial automation applications grow. Spain contributes 6.9% in 2025, growing to 7.2% by 2035, supported by expanding manufacturing sector and equipment modernization. The Nordic countries rise from 3.8% in 2025 to 4% by 2035 on the back of strong technology adoption and advanced measurement methodologies. BENELUX remains at 1.5% share across both 2025 and 2035, reflecting mature, precision-focused industrial markets.
Competitive Landscape of the Liquid Filled Pressure Gauges Market

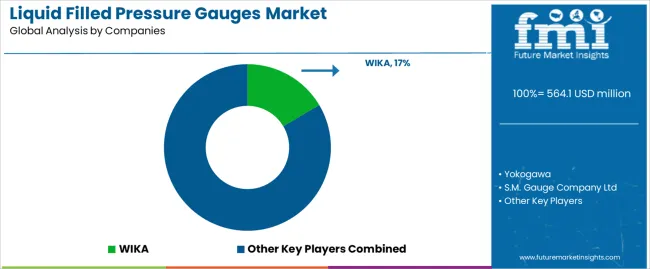
Liquid Filled Pressure Gauges Market Analysis By Company

The liquid filled pressure gauges market is characterized by competition among established instrumentation manufacturers, specialized measurement device producers, and integrated industrial solution companies. Companies are investing in precision manufacturing technologies, advanced filling liquid development systems, product innovation capabilities, and comprehensive distribution networks to deliver consistent, high-quality, and reliable liquid filled pressure gauge systems. Innovation in accuracy enhancement, temperature compensation, and application-specific product development is central to strengthening market position and customer satisfaction.

WIKA leads the liquid filled pressure gauges market with a strong focus on measurement instrumentation innovation and comprehensive liquid filled pressure gauge solutions, offering industrial measurement systems with emphasis on manufacturing excellence and technological heritage. Yokogawa provides specialized process measurement instruments with a focus on industrial automation applications and precision engineering networks. S.M. Gauge Company Ltd delivers integrated measurement solutions with a focus on industrial positioning and operational reliability. McDaniel Controls specializes in comprehensive process control instrumentation with an emphasis on accuracy applications. General Instruments focuses on comprehensive industrial measurement devices with advanced design and premium positioning capabilities.

Global Liquid Filled Pressure Gauges Market -- Stakeholder Contribution Framework

The success of liquid filled pressure gauges in meeting industrial measurement demands, operator-driven accuracy requirements, and process integration will not only enhance monitoring quality outcomes but also strengthen global instrumentation manufacturing capabilities. It will consolidate emerging regions' positions as hubs for efficient measurement device production and align advanced economies with industrial process control systems. This calls for a concerted effort by all stakeholders -- governments, industry bodies, manufacturers, distributors, and investors. Each can be a crucial enabler in preparing the liquid filled pressure gauges market for its next phase of growth.

How Governments Could Spur Local Production and Adoption?

  • Targeted Incentives: Introduce manufacturing modernization subsidies for companies adopting advanced liquid filled pressure gauge production technologies in instrumentation manufacturing and industrial regions, and production-linked incentives for facilities producing gauges for domestic consumption and export markets.
  • Trade Agreements: Accelerate export growth through bilateral and multilateral agreements that classify liquid filled pressure gauges under "precision measurement equipment," easing cross-border regulatory approvals and technical certifications.
  • Facilitate Innovation: Establish Centers of Excellence for measurement technology innovation and instrumentation engineering. Fund R&D into efficient manufacturing systems, filling liquid optimization, and quality-standard integration for industrial measurement operations.

How Industry Bodies Could Support Market Development?

  • Foster Connectivity: Constitute a global liquid filled pressure gauges consortium linking instrumentation manufacturers, equipment suppliers, operators, and policymakers to align production targets with quality and performance commitments.
  • Promote Exports: Work with export councils to brand liquid filled pressure gauges as premium, technically engineered measurement solutions. Facilitate trade fairs to connect instrumentation innovators with global buyers in chemicals, petroleum, pharmaceuticals, and metallurgy sectors.
  • Upskilling Programs: Develop curricula on advanced instrumentation manufacturing, filling liquid selection, quality control processes, and performance optimization to prepare manufacturers and operators for premium market opportunities.

How Distributors and Equipment Industry Players Could Strengthen the Ecosystem?

  • Drive Integration: Bundle liquid filled pressure gauges with performance-focused marketing and accuracy messaging systems. Position precision instruments as part of holistic "process optimization solutions."
  • Forge Partnerships: Collaborate with instrumentation manufacturers and technology providers for joint R&D on gauge applications, performance enhancement initiatives, and global quality assurance for premium markets.

How Manufacturers Could Navigate the Shift?

  • Capture Premium Markets: Leverage government incentives and rising accuracy demand to offer liquid filled pressure gauges into growth markets where alternative measurement devices face performance and reliability challenges.
  • Invest in Technology: Partner with technology providers to advance efficient manufacturing workflows, industrial-grade quality, and advanced production practices.
  • Build Capabilities: Train technical staff and quality specialists to demonstrate liquid filled pressure gauges' performance advantages, repositioning industrial relationships toward long-term supply partnerships.

Key Players in the Liquid Filled Pressure Gauges Market

  • WIKA
  • Yokogawa
  • S.M. Gauge Company Ltd
  • McDaniel Controls
  • General Instruments
  • Avlok
  • SKON
  • Qyasat
  • Camel Precision Co., Ltd.
  • BCST Group
  • Winters
  • Nuova Fima
  • FGB Manufacturing Co.
  • Ashcroft
  • Dwyer Instruments

Scope of the Report

Items Values
Quantitative Units (2025) USD 564.1 million
Product Type Glycerin Filled, silicone Oil Filled, Water Filled, Synthetic Oil Filled, Others
Application Chemicals Industry, Petroleum Industry, Pharmaceuticals Industry, Metallurgy Industry, Food & Beverage Industry, Others
Filling Liquid Type Glycerin-Based Liquids, silicone-Based Liquids, Mineral Oil-Based Liquids, Specialty Synthetic Liquids
Pressure Range Low Pressure (0-100 PSI), Medium Pressure (100-1000 PSI), High Pressure (1000-5000 PSI), Ultra-High Pressure (Above 5000 PSI)
Accuracy Class Class 1.0, Class 1.6, Class 2.5, Specialty Precision Grades
Regions Covered North America, Europe, Asia Pacific, Latin America, Middle East & Africa, Other Regions
Countries Covered China, India, Germany, Brazil, United States, United Kingdom, Japan, and 40+ countries
Key Companies Profiled WIKA, Yokogawa, S.M. Gauge Company Ltd, McDaniel Controls, General Instruments, and other leading liquid filled pressure gauge companies
Additional Attributes Dollar sales by product type, application, filling liquid type, pressure range, accuracy class, and region; regional demand trends, competitive landscape, technological advancements in instrumentation engineering, precision manufacturing initiatives, accuracy enhancement programs, and premium product development strategies

Liquid Filled Pressure Gauges Market by Segments

Product Type:

  • Glycerin Filled
  • silicone Oil Filled
  • Water Filled
  • Synthetic Oil Filled
  • Others

Application:

  • Chemicals Industry
  • Petroleum Industry
  • Pharmaceuticals Industry
  • Metallurgy Industry
  • Food & Beverage Industry
  • Others

Filling Liquid Type:

  • Glycerin-Based Liquids
  • silicone-Based Liquids
  • Mineral Oil-Based Liquids
  • Specialty Synthetic Liquids

Pressure Range:

  • Low Pressure (0-100 PSI)
  • Medium Pressure (100-1000 PSI)
  • High Pressure (1000-5000 PSI)
  • Ultra-High Pressure (Above 5000 PSI)

Accuracy Class:

  • Class 1.0
  • Class 1.6
  • Class 2.5
  • Specialty Precision Grades

Region:

  • North America
    • United States
    • Canada
    • Mexico
  • Europe
    • Germany
    • United Kingdom
    • France
    • Italy
    • Spain
    • Nordic Countries
    • BENELUX
    • Rest of Europe
  • Asia Pacific
    • China
    • Japan
    • South Korea
    • India
    • Australia
    • Rest of Asia Pacific
  • Latin America
    • Brazil
    • Argentina
    • Rest of Latin America
  • Middle East & Africa
    • Kingdom of Saudi Arabia
    • United Arab Emirates
    • South Africa
    • Rest of Middle East & Africa
  • Other Regions
    • Oceania
    • Central Asia
    • Other Markets

Frequently Asked Questions

How big is the liquid filled pressure gauges market in 2025?

The global liquid filled pressure gauges market is estimated to be valued at USD 564.1 million in 2025.

What will be the size of liquid filled pressure gauges market in 2035?

The market size for the liquid filled pressure gauges market is projected to reach USD 901.6 million by 2035.

How much will be the liquid filled pressure gauges market growth between 2025 and 2035?

The liquid filled pressure gauges market is expected to grow at a 4.8% CAGR between 2025 and 2035.

What are the key product types in the liquid filled pressure gauges market?

The key product types in liquid filled pressure gauges market are glycerin filled, silicone oil filled, water filled, synthetic oil filled and others.

Which application segment to contribute significant share in the liquid filled pressure gauges market in 2025?

In terms of application, chemicals industry segment to command 35.7% share in the liquid filled pressure gauges market in 2025.

Table of Content

  1. Executive Summary
    • Global Market Outlook
    • Demand to side Trends
    • Supply to side Trends
    • Technology Roadmap Analysis
    • Analysis and Recommendations
  2. Market Overview
    • Market Coverage / Taxonomy
    • Market Definition / Scope / Limitations
  3. Market Background
    • Market Dynamics
      • Drivers
      • Restraints
      • Opportunity
      • Trends
    • Scenario Forecast
      • Demand in Optimistic Scenario
      • Demand in Likely Scenario
      • Demand in Conservative Scenario
    • Opportunity Map Analysis
    • Product Life Cycle Analysis
    • Supply Chain Analysis
    • Investment Feasibility Matrix
    • Value Chain Analysis
    • PESTLE and Porter’s Analysis
    • Regulatory Landscape
    • Regional Parent Market Outlook
    • Production and Consumption Statistics
    • Import and Export Statistics
  4. Global Market Analysis 2020 to 2024 and Forecast, 2025 to 2035
    • Historical Market size Value (USD Million) Analysis, 2020 to 2024
    • Current and Future Market size Value (USD Million) Projections, 2025 to 2035
      • Y to o to Y Growth Trend Analysis
      • Absolute $ Opportunity Analysis
  5. Global Market Pricing Analysis 2020 to 2024 and Forecast 2025 to 2035
  6. Global Market Analysis 2020 to 2024 and Forecast 2025 to 2035, By Product Type
    • Introduction / Key Findings
    • Historical Market size Value (USD Million) Analysis By Product Type , 2020 to 2024
    • Current and Future Market size Value (USD Million) Analysis and Forecast By Product Type , 2025 to 2035
      • Glycerin Filled
      • silicone Oil Filled
      • Water Filled
      • Synthetic Oil Filled
      • Others
    • Y to o to Y Growth Trend Analysis By Product Type , 2020 to 2024
    • Absolute $ Opportunity Analysis By Product Type , 2025 to 2035
  7. Global Market Analysis 2020 to 2024 and Forecast 2025 to 2035, By Application
    • Introduction / Key Findings
    • Historical Market size Value (USD Million) Analysis By Application, 2020 to 2024
    • Current and Future Market size Value (USD Million) Analysis and Forecast By Application, 2025 to 2035
      • Chemicals Industry
      • Petroleum Industry
      • Pharmaceuticals Industry
      • Metallurgy Industry
      • Food & Beverage Industry
      • Others
    • Y to o to Y Growth Trend Analysis By Application, 2020 to 2024
    • Absolute $ Opportunity Analysis By Application, 2025 to 2035
  8. Global Market Analysis 2020 to 2024 and Forecast 2025 to 2035, By Region
    • Introduction
    • Historical Market size Value (USD Million) Analysis By Region, 2020 to 2024
    • Current Market size Value (USD Million) Analysis and Forecast By Region, 2025 to 2035
      • North America
      • Latin America
      • Western Europe
      • Eastern Europe
      • East Asia
      • South Asia and Pacific
      • Middle East & Africa
    • Market Attractiveness Analysis By Region
  9. North America Market Analysis 2020 to 2024 and Forecast 2025 to 2035, By Country
    • Historical Market size Value (USD Million) Trend Analysis By Market Taxonomy, 2020 to 2024
    • Market size Value (USD Million) Forecast By Market Taxonomy, 2025 to 2035
      • By Country
        • USA
        • Canada
        • Mexico
      • By Product Type
      • By Application
    • Market Attractiveness Analysis
      • By Country
      • By Product Type
      • By Application
    • Key Takeaways
  10. Latin America Market Analysis 2020 to 2024 and Forecast 2025 to 2035, By Country
    • Historical Market size Value (USD Million) Trend Analysis By Market Taxonomy, 2020 to 2024
    • Market size Value (USD Million) Forecast By Market Taxonomy, 2025 to 2035
      • By Country
        • Brazil
        • Chile
        • Rest of Latin America
      • By Product Type
      • By Application
    • Market Attractiveness Analysis
      • By Country
      • By Product Type
      • By Application
    • Key Takeaways
  11. Western Europe Market Analysis 2020 to 2024 and Forecast 2025 to 2035, By Country
    • Historical Market size Value (USD Million) Trend Analysis By Market Taxonomy, 2020 to 2024
    • Market size Value (USD Million) Forecast By Market Taxonomy, 2025 to 2035
      • By Country
        • Germany
        • UK
        • Italy
        • Spain
        • France
        • Nordic
        • BENELUX
        • Rest of Western Europe
      • By Product Type
      • By Application
    • Market Attractiveness Analysis
      • By Country
      • By Product Type
      • By Application
    • Key Takeaways
  12. Eastern Europe Market Analysis 2020 to 2024 and Forecast 2025 to 2035, By Country
    • Historical Market size Value (USD Million) Trend Analysis By Market Taxonomy, 2020 to 2024
    • Market size Value (USD Million) Forecast By Market Taxonomy, 2025 to 2035
      • By Country
        • Russia
        • Poland
        • Hungary
        • Balkan & Baltic
        • Rest of Eastern Europe
      • By Product Type
      • By Application
    • Market Attractiveness Analysis
      • By Country
      • By Product Type
      • By Application
    • Key Takeaways
  13. East Asia Market Analysis 2020 to 2024 and Forecast 2025 to 2035, By Country
    • Historical Market size Value (USD Million) Trend Analysis By Market Taxonomy, 2020 to 2024
    • Market size Value (USD Million) Forecast By Market Taxonomy, 2025 to 2035
      • By Country
        • China
        • Japan
        • South Korea
      • By Product Type
      • By Application
    • Market Attractiveness Analysis
      • By Country
      • By Product Type
      • By Application
    • Key Takeaways
  14. South Asia and Pacific Market Analysis 2020 to 2024 and Forecast 2025 to 2035, By Country
    • Historical Market size Value (USD Million) Trend Analysis By Market Taxonomy, 2020 to 2024
    • Market size Value (USD Million) Forecast By Market Taxonomy, 2025 to 2035
      • By Country
        • India
        • ASEAN
        • Australia & New Zealand
        • Rest of South Asia and Pacific
      • By Product Type
      • By Application
    • Market Attractiveness Analysis
      • By Country
      • By Product Type
      • By Application
    • Key Takeaways
  15. Middle East & Africa Market Analysis 2020 to 2024 and Forecast 2025 to 2035, By Country
    • Historical Market size Value (USD Million) Trend Analysis By Market Taxonomy, 2020 to 2024
    • Market size Value (USD Million) Forecast By Market Taxonomy, 2025 to 2035
      • By Country
        • Kingdom of Saudi Arabia
        • Other GCC Countries
        • Turkiye
        • South Africa
        • Other African Union
        • Rest of Middle East & Africa
      • By Product Type
      • By Application
    • Market Attractiveness Analysis
      • By Country
      • By Product Type
      • By Application
    • Key Takeaways
  16. Key Countries Market Analysis
    • USA
      • Pricing Analysis
      • Market Share Analysis, 2024
        • By Product Type
        • By Application
    • Canada
      • Pricing Analysis
      • Market Share Analysis, 2024
        • By Product Type
        • By Application
    • Mexico
      • Pricing Analysis
      • Market Share Analysis, 2024
        • By Product Type
        • By Application
    • Brazil
      • Pricing Analysis
      • Market Share Analysis, 2024
        • By Product Type
        • By Application
    • Chile
      • Pricing Analysis
      • Market Share Analysis, 2024
        • By Product Type
        • By Application
    • Germany
      • Pricing Analysis
      • Market Share Analysis, 2024
        • By Product Type
        • By Application
    • UK
      • Pricing Analysis
      • Market Share Analysis, 2024
        • By Product Type
        • By Application
    • Italy
      • Pricing Analysis
      • Market Share Analysis, 2024
        • By Product Type
        • By Application
    • Spain
      • Pricing Analysis
      • Market Share Analysis, 2024
        • By Product Type
        • By Application
    • France
      • Pricing Analysis
      • Market Share Analysis, 2024
        • By Product Type
        • By Application
    • India
      • Pricing Analysis
      • Market Share Analysis, 2024
        • By Product Type
        • By Application
    • ASEAN
      • Pricing Analysis
      • Market Share Analysis, 2024
        • By Product Type
        • By Application
    • Australia & New Zealand
      • Pricing Analysis
      • Market Share Analysis, 2024
        • By Product Type
        • By Application
    • China
      • Pricing Analysis
      • Market Share Analysis, 2024
        • By Product Type
        • By Application
    • Japan
      • Pricing Analysis
      • Market Share Analysis, 2024
        • By Product Type
        • By Application
    • South Korea
      • Pricing Analysis
      • Market Share Analysis, 2024
        • By Product Type
        • By Application
    • Russia
      • Pricing Analysis
      • Market Share Analysis, 2024
        • By Product Type
        • By Application
    • Poland
      • Pricing Analysis
      • Market Share Analysis, 2024
        • By Product Type
        • By Application
    • Hungary
      • Pricing Analysis
      • Market Share Analysis, 2024
        • By Product Type
        • By Application
    • Kingdom of Saudi Arabia
      • Pricing Analysis
      • Market Share Analysis, 2024
        • By Product Type
        • By Application
    • Turkiye
      • Pricing Analysis
      • Market Share Analysis, 2024
        • By Product Type
        • By Application
    • South Africa
      • Pricing Analysis
      • Market Share Analysis, 2024
        • By Product Type
        • By Application
  17. Market Structure Analysis
    • Competition Dashboard
    • Competition Benchmarking
    • Market Share Analysis of Top Players
      • By Regional
      • By Product Type
      • By Application
  18. Competition Analysis
    • Competition Deep Dive
      • WIKA
        • Overview
        • Product Portfolio
        • Profitability by Market Segments (Product/Age /Sales Channel/Region)
        • Sales Footprint
        • Strategy Overview
          • Marketing Strategy
          • Product Strategy
          • Channel Strategy
      • Yokogawa
      • S.M. Gauge Company Ltd
      • McDaniel Controls
      • General Instruments
      • Avlok
      • SKON
      • Qyasat
      • Camel Precision Co., Ltd.
      • BCST Group
      • Winters
      • Nuova Fima
      • FGB Manufacturing Co.
      • Ashcroft
      • Dwyer Instruments
  19. Assumptions & Acronyms Used
  20. Research Methodology

List of Tables

  • Table 1: Global Market Value (USD Million) Forecast by Region, 2020 to 2035
  • Table 2: Global Market Value (USD Million) Forecast by Product Type , 2020 to 2035
  • Table 3: Global Market Value (USD Million) Forecast by Application, 2020 to 2035
  • Table 4: North America Market Value (USD Million) Forecast by Country, 2020 to 2035
  • Table 5: North America Market Value (USD Million) Forecast by Product Type , 2020 to 2035
  • Table 6: North America Market Value (USD Million) Forecast by Application, 2020 to 2035
  • Table 7: Latin America Market Value (USD Million) Forecast by Country, 2020 to 2035
  • Table 8: Latin America Market Value (USD Million) Forecast by Product Type , 2020 to 2035
  • Table 9: Latin America Market Value (USD Million) Forecast by Application, 2020 to 2035
  • Table 10: Western Europe Market Value (USD Million) Forecast by Country, 2020 to 2035
  • Table 11: Western Europe Market Value (USD Million) Forecast by Product Type , 2020 to 2035
  • Table 12: Western Europe Market Value (USD Million) Forecast by Application, 2020 to 2035
  • Table 13: Eastern Europe Market Value (USD Million) Forecast by Country, 2020 to 2035
  • Table 14: Eastern Europe Market Value (USD Million) Forecast by Product Type , 2020 to 2035
  • Table 15: Eastern Europe Market Value (USD Million) Forecast by Application, 2020 to 2035
  • Table 16: East Asia Market Value (USD Million) Forecast by Country, 2020 to 2035
  • Table 17: East Asia Market Value (USD Million) Forecast by Product Type , 2020 to 2035
  • Table 18: East Asia Market Value (USD Million) Forecast by Application, 2020 to 2035
  • Table 19: South Asia and Pacific Market Value (USD Million) Forecast by Country, 2020 to 2035
  • Table 20: South Asia and Pacific Market Value (USD Million) Forecast by Product Type , 2020 to 2035
  • Table 21: South Asia and Pacific Market Value (USD Million) Forecast by Application, 2020 to 2035
  • Table 22: Middle East & Africa Market Value (USD Million) Forecast by Country, 2020 to 2035
  • Table 23: Middle East & Africa Market Value (USD Million) Forecast by Product Type , 2020 to 2035
  • Table 24: Middle East & Africa Market Value (USD Million) Forecast by Application, 2020 to 2035

List of Figures

  • Figure 1: Global Market Pricing Analysis
  • Figure 2: Global Market Value (USD Million) Forecast 2020-2035
  • Figure 3: Global Market Value Share and BPS Analysis by Product Type , 2025 and 2035
  • Figure 4: Global Market Y to o to Y Growth Comparison by Product Type , 2025-2035
  • Figure 5: Global Market Attractiveness Analysis by Product Type
  • Figure 6: Global Market Value Share and BPS Analysis by Application, 2025 and 2035
  • Figure 7: Global Market Y to o to Y Growth Comparison by Application, 2025-2035
  • Figure 8: Global Market Attractiveness Analysis by Application
  • Figure 9: Global Market Value (USD Million) Share and BPS Analysis by Region, 2025 and 2035
  • Figure 10: Global Market Y to o to Y Growth Comparison by Region, 2025-2035
  • Figure 11: Global Market Attractiveness Analysis by Region
  • Figure 12: North America Market Incremental Dollar Opportunity, 2025-2035
  • Figure 13: Latin America Market Incremental Dollar Opportunity, 2025-2035
  • Figure 14: Western Europe Market Incremental Dollar Opportunity, 2025-2035
  • Figure 15: Eastern Europe Market Incremental Dollar Opportunity, 2025-2035
  • Figure 16: East Asia Market Incremental Dollar Opportunity, 2025-2035
  • Figure 17: South Asia and Pacific Market Incremental Dollar Opportunity, 2025-2035
  • Figure 18: Middle East & Africa Market Incremental Dollar Opportunity, 2025-2035
  • Figure 19: North America Market Value Share and BPS Analysis by Country, 2025 and 2035
  • Figure 20: North America Market Value Share and BPS Analysis by Product Type , 2025 and 2035
  • Figure 21: North America Market Y to o to Y Growth Comparison by Product Type , 2025-2035
  • Figure 22: North America Market Attractiveness Analysis by Product Type
  • Figure 23: North America Market Value Share and BPS Analysis by Application, 2025 and 2035
  • Figure 24: North America Market Y to o to Y Growth Comparison by Application, 2025-2035
  • Figure 25: North America Market Attractiveness Analysis by Application
  • Figure 26: Latin America Market Value Share and BPS Analysis by Country, 2025 and 2035
  • Figure 27: Latin America Market Value Share and BPS Analysis by Product Type , 2025 and 2035
  • Figure 28: Latin America Market Y to o to Y Growth Comparison by Product Type , 2025-2035
  • Figure 29: Latin America Market Attractiveness Analysis by Product Type
  • Figure 30: Latin America Market Value Share and BPS Analysis by Application, 2025 and 2035
  • Figure 31: Latin America Market Y to o to Y Growth Comparison by Application, 2025-2035
  • Figure 32: Latin America Market Attractiveness Analysis by Application
  • Figure 33: Western Europe Market Value Share and BPS Analysis by Country, 2025 and 2035
  • Figure 34: Western Europe Market Value Share and BPS Analysis by Product Type , 2025 and 2035
  • Figure 35: Western Europe Market Y to o to Y Growth Comparison by Product Type , 2025-2035
  • Figure 36: Western Europe Market Attractiveness Analysis by Product Type
  • Figure 37: Western Europe Market Value Share and BPS Analysis by Application, 2025 and 2035
  • Figure 38: Western Europe Market Y to o to Y Growth Comparison by Application, 2025-2035
  • Figure 39: Western Europe Market Attractiveness Analysis by Application
  • Figure 40: Eastern Europe Market Value Share and BPS Analysis by Country, 2025 and 2035
  • Figure 41: Eastern Europe Market Value Share and BPS Analysis by Product Type , 2025 and 2035
  • Figure 42: Eastern Europe Market Y to o to Y Growth Comparison by Product Type , 2025-2035
  • Figure 43: Eastern Europe Market Attractiveness Analysis by Product Type
  • Figure 44: Eastern Europe Market Value Share and BPS Analysis by Application, 2025 and 2035
  • Figure 45: Eastern Europe Market Y to o to Y Growth Comparison by Application, 2025-2035
  • Figure 46: Eastern Europe Market Attractiveness Analysis by Application
  • Figure 47: East Asia Market Value Share and BPS Analysis by Country, 2025 and 2035
  • Figure 48: East Asia Market Value Share and BPS Analysis by Product Type , 2025 and 2035
  • Figure 49: East Asia Market Y to o to Y Growth Comparison by Product Type , 2025-2035
  • Figure 50: East Asia Market Attractiveness Analysis by Product Type
  • Figure 51: East Asia Market Value Share and BPS Analysis by Application, 2025 and 2035
  • Figure 52: East Asia Market Y to o to Y Growth Comparison by Application, 2025-2035
  • Figure 53: East Asia Market Attractiveness Analysis by Application
  • Figure 54: South Asia and Pacific Market Value Share and BPS Analysis by Country, 2025 and 2035
  • Figure 55: South Asia and Pacific Market Value Share and BPS Analysis by Product Type , 2025 and 2035
  • Figure 56: South Asia and Pacific Market Y to o to Y Growth Comparison by Product Type , 2025-2035
  • Figure 57: South Asia and Pacific Market Attractiveness Analysis by Product Type
  • Figure 58: South Asia and Pacific Market Value Share and BPS Analysis by Application, 2025 and 2035
  • Figure 59: South Asia and Pacific Market Y to o to Y Growth Comparison by Application, 2025-2035
  • Figure 60: South Asia and Pacific Market Attractiveness Analysis by Application
  • Figure 61: Middle East & Africa Market Value Share and BPS Analysis by Country, 2025 and 2035
  • Figure 62: Middle East & Africa Market Value Share and BPS Analysis by Product Type , 2025 and 2035
  • Figure 63: Middle East & Africa Market Y to o to Y Growth Comparison by Product Type , 2025-2035
  • Figure 64: Middle East & Africa Market Attractiveness Analysis by Product Type
  • Figure 65: Middle East & Africa Market Value Share and BPS Analysis by Application, 2025 and 2035
  • Figure 66: Middle East & Africa Market Y to o to Y Growth Comparison by Application, 2025-2035
  • Figure 67: Middle East & Africa Market Attractiveness Analysis by Application
  • Figure 68: Global Market - Tier Structure Analysis
  • Figure 69: Global Market - Company Share Analysis
Dashboard
Dashboard
Dashboard
Dashboard
Dashboard
Dashboard

Full Research Suite comprises of:

Market outlook & trends analysis

Market outlook & trends analysis

Interviews & case studies

Interviews & case studies

Strategic recommendations

Strategic recommendations

Vendor profiles & capabilities analysis

Vendor profiles & capabilities analysis

5-year forecasts

5-year forecasts

8 regions and 60+ country-level data splits

8 regions and 60+ country-level data splits

Market segment data splits

Market segment data splits

12 months of continuous data updates

12 months of continuous data updates

DELIVERED AS:

PDF EXCEL ONLINE

Full Research Suite


$5000

$7500

$10000

Buy Report Now
Similar Industry Reports

Similar Industry Reports

Liquid Filtration Market

Liquid Filtration Market Size and Share Forecast Outlook 2025 to 2035

Liquid Packaging Board Market

Liquid Packaging Board Market Size and Share Forecast Outlook 2025 to 2035

Liquid Density Meters Market

Liquid Density Meters Market Size and Share Forecast Outlook 2025 to 2035

Liquid Cold Plates Market

Liquid Cold Plates Market Size and Share Forecast Outlook 2025 to 2035

Liquid Crystal Polymers Market

Liquid Crystal Polymers Market Size and Share Forecast Outlook 2025 to 2035

Liquid Embolic Agent Market

Liquid Embolic Agent Market Size and Share Forecast Outlook 2025 to 2035

Liquid Hydrogen Market

Liquid Hydrogen Market Size and Share Forecast Outlook 2025 to 2035

Liquid Cooled Home Standby Gensets Market

Liquid Cooled Home Standby Gensets Market Size and Share Forecast Outlook 2025 to 2035

Liquid Nitrogen Purge Systems Market

Liquid Nitrogen Purge Systems Market Size and Share Forecast Outlook 2025 to 2035

Liquid Chromatography Systems Market

Liquid Chromatography Systems Market Size and Share Forecast Outlook 2025 to 2035

Liquid Armor Materials Market

Liquid Armor Materials Market Size and Share Forecast Outlook 2025 to 2035

Liquid Synthetic Rubber Market

Liquid Synthetic Rubber Market Size and Share Forecast Outlook 2025 to 2035

Liquid Crystal Polymer (LCP) Market

Liquid Crystal Polymer (LCP) Market Size and Share Forecast Outlook 2025 to 2035

Liquid Smoke Market
Liquid Smoke Market

Liquid Smoke Market Analysis - Size, Share, and Forecast Outlook 2025 to 2035

Liquid-Tight Flexible Non-Metallic Conduit Market

Liquid-Tight Flexible Non-Metallic Conduit Market Size and Share Forecast Outlook 2025 to 2035

Liquid Hand Soap Market

Liquid Hand Soap Market Size and Share Forecast Outlook 2025 to 2035

Liquid Packaging Market

Liquid Packaging Market Size and Share Forecast Outlook 2025 to 2035

Liquid-Tight Flexible Metal Conduit Market 

Liquid-Tight Flexible Metal Conduit Market  Size and Share Forecast Outlook 2025 to 2035

Liquid Breakfast Products Market

Liquid Breakfast Products Market Size and Share Forecast Outlook 2025 to 2035

Liquid Pouch Packing Machine Market

Liquid Pouch Packing Machine Market Size and Share Forecast Outlook 2025 to 2035

Future Market Insights

Liquid Filled Pressure Gauges Market

Chat With MaRIA

Chat With

MaRIA

Hi There, I am MaRIA, Your Market Research Intelligence Assistant. How may I help you?