Reports

- Global Locations -

Headquarters

Future Market Insights, Inc.

Christiana Corporate, 200
Continental Drive, Suite 401,
Newark, Delaware - 19713,
United States

T: +1-845-579-5705

Americas

Future Market Insights, Inc.

616 Corporate Way, Suite 2-9018,
Valley Cottage, NY 10989, United States

T: +1-347-918-3531

MEA

Future Market Insights

1602-6 Jumeirah Bay X2 Tower, Plot No: JLT-PH2-X2A,
Jumeirah Lakes Towers, Dubai,
United Arab Emirates

Europe

Future Market Insights

3rd Floor, 207 Regent Street,
W1B 3HH London
United Kingdom

T: + 44 (0) 20 8123 9659
D: +44 (0) 20 3287 4268

Asia Pacific

Future Market Insights

IndiaLand Global Tech Park, Unit UG-1, Behind Grand HighStreet, Phase 1, Hinjawadi, MH, Pune – 411057, India

Liquid Smoke Market Outlook (2023 to 2033)

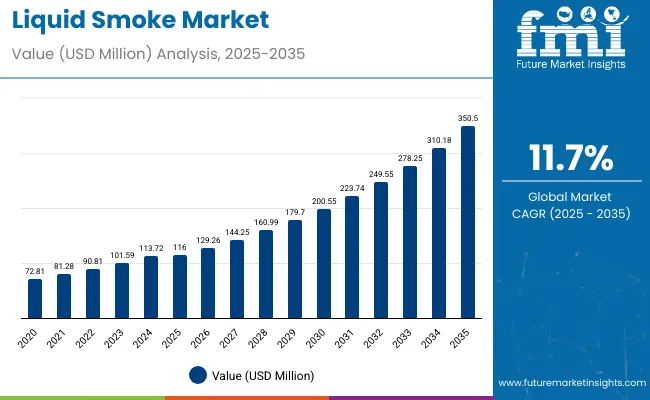
The global liquid smoke market is expected to reach a market valuation of US$ 93 million in 2023, accelerating at a CAGR of 11.7% throughout the forecast period. By 2033, the overall market size is projected to reach US$ 245 million.

Liquid smoke sales are likely to account for around 0.7% share of the global food and flavoring market during the forecast period. Rising consumption of smoked food products and increasing inclination towards liquid smoke are key factors driving the global market.

Liquid smoke is the smoke from burning wood that’s been condensed to liquid form. This water-soluble liquid is being increasingly used as a flavoring in a variety of food products. It allows users to give a smoky flavor to certain foods without having to use actual wood smoke.

In earlier times, the smoking of food was necessary to preserve foods such as meat or fish. However, nowadays foods are often smoked simply because of their rich, delicious flavor.

Liquid smoke serves the purpose of preserving food products as well as increasing their palatability by adding flavor. It is widely available in convenience stores, supermarkets, online platforms, and several other distribution channels.

Growing usage of liquid smoke for preparing various commercial food products including barbecue sauces, seafood, marinades, and hot dogs is driving the global liquid smoke industry.

Due to the increased consumption of flavored foods, there is a sharp spike in demand for liquid smoke in the market and the trend is expected to continue during the forecast period.

Around 80% of consumers prefer liquid smoke over a smoker, worldwide. Liquid smoke is safer than cooking with actual smoke as the carcinogenic pathogen in liquid smoke is filtered out. Hence, it has become an ideal alternative to actual meat smoking.

Various studies are being conducted to test the potential health benefits of liquid smoke derived from numerous sources. For instance, a study published in the American Chemistry Society revealed that liquid smoke from rice hulls could be healthful.

The study found liquid rice hull smoke working as an antioxidant that can help to fight off diseases. Growing awareness about the potential health benefits of liquid smoke will play a key role in boosting market during the forecast period.

Several liquid smoke liquid formulations also contain additives for functional purposes. This addition of additives is expected to further elevate liquid smoke demand worldwide.

Attribute Key Insights
Liquid Smoke Market Estimated Value (2023E) US$ 93 million
Projected Market Value (2033F) US$ 245 million
Value-based CAGR (2023 to 2033) 11.7%
Top 3 Countries Market Share 22%

Don't pay for what you don't need

Customize your report by selecting specific countries or regions and save 30%!

How has the Demand for Liquid Smoke Surged So Far in 2023?

Future Market Insights predicts the market to remain profitable, exhibiting growth at 11.7% CAGR between 2023 and 2033. Projected CAGR for January to June 2023 is 8.9% in comparison to the CAGR of 8.2% posted between July to December 2022.

Liquid smoke improves the shelf life of food products, provides them with unique flavors, and thus is a value-for-money product for consumers. This has had a positive impact on the liquid smoke industry. Few of the key factors boosting liquid smoke industry include:

  • Rising consumption of liquid smokes in sauces, bakeries, seafood, and meat products
  • Growing preference for barbeque sauces and baked products
  • Increasing awareness about various benefits of using liquid smoke
Details Market Statistics
Jan to Jun (H1), 2021 (A) 7.8%
Jul to Dec (H2), 2021 (A) 7.6%
Jan to Jun (H1), 2022 Projected (P) 8.1%
Jan to Jun (H1), 2022 Outlook (O) 8.0%
Jul to Dec (H2), 2022 Projected (P) 8.1%
Jul to Dec (H2), 2022 Outlook (O) 8.2%
Jan to Jun (H1), 2023 Projected (P) 8.9%

2018 to 2022 Liquid Smoke Market Outlook Compared to Demand Forecast from 2023 to 2033

Liquid smoke sales grew at a CAGR of 7.6% during the historical period between 2018 and 2022. For the projection period from 2023 and 2033, Future Market Insights estimates the global market for liquid smoke to expand at a prolific CAGR of 11.7%.

Growing demand for smoked food products, innovation in liquid smoke, and penetration of new players are few of the key factors driving the global market forward.

Liquid Smoke is a go-to product when slow-cooking meat and a little product goes a long way without the hassle of smoking or outdoor grilling. This is also a sustainable way to add a smoky flavor to food without contaminating the environment and adding to pollution.

Recent investments in research & development in liquid smoke have been useful in pulling down the figure of chemicals used in making liquid smoke. This in turn is positively influencing liquid smoke sales.

FMI’s latest analysis predicts the global liquid smoke industry to register a stupendous growth rate amid rising sales of liquid smoke through online platforms. Similarly, revenue generation opportunities for liquid smoke companies will arise from rising awareness about the benefits associated with liquid smoke.

Nandini Roy Choudhury

Principal Consultant

Talk to Analyst

Find your sweet spots for generating winning opportunities in this market.

What are the Key Trends Shaping the Global Liquid Smoke Industry?

Rising Environmental Concerns Coupled with Demand for Eco-friendly Products Boosting Liquid Smoke Sales

In traditional smoking, real wood is used for smoking food. However, this type of smoking causes several environmental problems due to emission of harmful pollutants. As a result, end users such as food processing companies are shifting towards liquid smoke.

Liquid smoke emits lesser pollution, thereby significantly reducing overall carbon footprint. It has emerged as an ideal eco-friendly alternative to wood smoke and is being increasingly used across households and commercial food sector.

Adjacent Markets Overview

Liquid Smoke Market:

Attributes Liquid Smoke Market
CAGR (2023 to 2033) 11.7%
Market Value (2023) US$ 93 million
Growth Factor Growing inclination towards using liquid smoke for cooking rather than wood smoke is expected to drive the global market swiftly during the forecast period.
Opportunity Rapid expansion of food processing industry and increasing fast food chains across the world will create lucrative growth opportunities for liquid smoke manufacturers.
Key Trends Rising popularity of smoked meat products, especially across developed regions is likely to propel liquid smoke demand over the next ten years.

Smoke Ingredients Market:

Attributes Smoke Ingredients Market
CAGR (2023 to 2033) 5.2%
Market Value (2023) US$ 730.5 million
Growth Factor Increasing demand for convenience food, changing lifestyles, and untapped potential in the developing Asia-Pacific countries act as key drivers for the market.
Opportunity Rising demand for food additives that don't have any negative side effects and increasing investments in research and development will create lucrative growth opportunities for smoke ingredient manufacturers.
Key Trends Growing popularity of premium smoked food products such as smoked salmon and sausages worldwide will boost smoke ingredients market

Food Preservatives Market:

Attributes Food Preservatives Market
CAGR (2023 to 2033) 6.8%
Market Value (2023) US$ 2.97 billion
Growth Factor Rising demand for processed food products worldwide coupled with growing popularity of ready-to-eat foods is a key factor driving the global food preservatives market.
Opportunity Increasing incidence of foodborne diseases and rising focus on improving shelf life of products will elevate demand for food preservatives.
Key Trends Rising demand for natural food preservatives is expected to generate lucrative growth opportunities for food preservative manufacturers during the next ten years.

Get the data you need at a Fraction of the cost

Personalize your report by choosing insights you need
and save 40%!

Country-wise Insights

Region North America
Country United States of America
CAGR (2023 to 2033) 6.9%
Market Value (2033) US$ 21.4 million
Region Europe
Country United Kingdom
CAGR (2023 to 2033) 5.6%
Market Value (2033) US$ 13.0 million
Region Asia Pacific
Country China
CAGR (2023 to 2033) 8.6%
Market Value (2033) US$ 15.8 million
Region Asia Pacific
Country India
CAGR (2023 to 2033) 7.9%
Market Value (2033) US$ 7.4 million
Region Asia Pacific
Country Japan
CAGR (2023 to 2033) 9.4%
Market Value (2033) US$ 8.4 million

What is the Outlook for the USA Liquid Smoke Market?

Growing Preference for Liquid Smoke Boosting Market in the USA

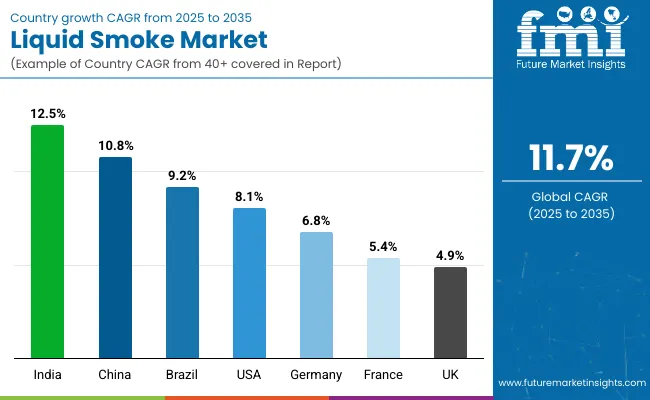
The USA liquid smoke market is forecast to expand at a CAGR of 6.9% during the forecast period, reaching US$ 21.4 million by 2033. The market witnessed a CAGR of 5.8% during the historic period.

Rising consumption of smoked food products and presence of leading liquid smoke manufacturers are the key factors driving the USA market forward. Similarly, inclination towards using liquid smoke over direct smoking of food is propelling demand in the market.

Liquid smoke is a convenient, low-effort yet flavourful alternative to actual smoke while cooking and for barbeque. Although with rising concern about chemicals used in processing liquid smoke, it's only beneficial if taken in meager portions.

Several consumers are hesitant to try liquid smoke because it cannot replace the accurate flavor. Therefore, most of the liquid smoke demand comes from the commercial food sector.

Increasing demand for meat products and rapid expansion of food processing industry will further boost liquid smoke sales in the USA during the forecast period.

How will Growth Unfold in the United Kingdom Market?

Growing Popularity of Smoky-flavored Foods Fuelling Liquid Smoke Sales in the United Kingdom

The United Kingdom liquid smoke market is poised to exhibit a CAGR of 5.6% between 2023 and 2033, reaching a total valuation of US$ 13.0 million in 2033.

Rising preference towards smoky-flavored food products is a key factor propelling liquid smoke demand in the United Kingdom market.

Subsequently, changing lifestyles and eating habits, increasing disposable incomes, and growth in fast food chains will boost liquid smoke sales in the country.

Why is Demand for Liquid Smokes Rising in China?

Widening Applications of Liquid Smoke Facilitating Market Expansion in China

According to Future Market Insights, demand for liquid smokes in China is projected to rise at 8.6% CAGR throughout the forecast period. This is attributed to rising consumption of meat products and seafood and increasing purchasing power of customers.

Similarly, growing usage of smoke liquid in various meat products is expected to fuel sales in China market during the projection period.

China has shown positive trends in the growth of the manufacturing base owing to the 100% foreign direct investment opportunity in the food processing industry and e-cigarette market.

China has a prime consumer base and a significant market share in the Asian region. This country is also expected to have the highest growth during the forecast period, owing to an increase in demand for e-cigarettes in various flavors. Further, key companies have taken steps to increase the market share of liquid smoke.

Category-wise Insights

Why is the Most Lucrative Application for Liquid Smoke?

Meat & Seafood to Generate Maximum Growth Opportunities for Smoke Liquid Manufacturers

Based on application, the global market for liquid smoke is segmented into bakeries, beverages, dairy, meat and seafood, pet food, and others. Among these, meat & food segment holds a prominent share of the market.

FMI predicts market revenues in the target segment to increase at 7.9% CAGR during the forecast period (2023 and 2033). This is due to rising consumption of meat products worldwide and growing trend of marinating meat products with liquid smoke.

Marinating beef, pork, and chicken adds a rich taste and makes up for delicious smoky main recipes. Changing consumer preferences for liquid smoke in hot dogs will further aid in the growth of the target segment.

Which Distribution Channel Holds Maximum Growth Potential for Liquid Smoke Market?

Online Stores to Generate Maximum Revenues in the Market

According to Future Market Insights, online stores segment is expected to expand at a robust pace during the projection period from 2023 to 2033. This is attributed to rising preference for purchasing liquid smoke products through online mode due to its various advantages.

Similarly, rising penetration of online shopping platforms across the world and availability of various types of liquid smoke on these platforms will boost growth of the target segment.

Competitive Landscape

Key liquid smoke manufacturers are innovating to develop new products to get customers interested in using liquid smoke. They are also employing strategies such as mergers, facility expansions, advertisements, acquisitions, partnerships, and acquisitions to gain a competitive edge in the market. for instance,

In February 2021, to produce smoke flavors, Azelis opened a new extraction and distillation plant in Denmark.

In October 2018, International Flavours & Fragrances Inc. acquired Frutarom to boost its sales and reach in the market.

Scope of the Report

Attribute Details
Estimated Market Size (2023) US$ 93 million
Projected Market Size (2033) US$ 245 million
Anticipated Growth Rate (2023 to 2033) 11.7% CAGR
Forecast Period 2023 to 2033
Historical Data Available for 2018 to 2022
Market Analysis US$ Million for Value MT for Volume
Key Regions Covered North America, Latin America, Europe, East Asia, South Asia, and the Middle East & Africa
Key Countries Covered United States of America, Canada, Brazil, Mexico, Germany, United Kingdom, France, Italy, Spain, Nordic, Russia, Poland, China, India, Thailand, Indonesia, Australia and New Zealand, Japan, GCC Countries, North Africa, South Africa, others.
Key Segments Covered Type, Application, Distribution Channel, & Region
Key Companies Profiled
  • Azelis Holdings S.A.
  • B&G Foods, Inc.
  • International Flavors & Fragrances, Inc.
  • McCormick & Company, Inc.
  • Kerry Group PLC
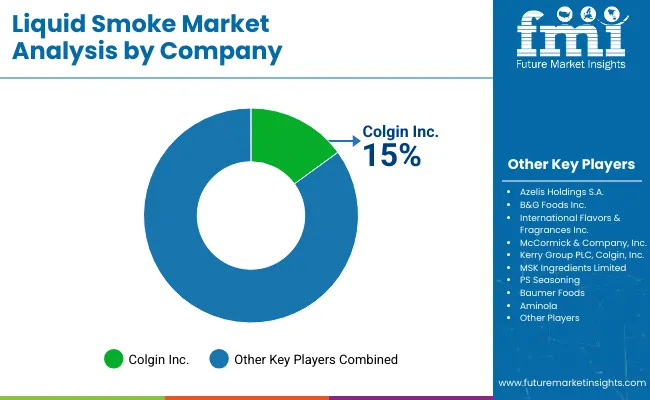
  • Colgin, Inc.
  • MSK Ingredients Limited
  • PS Seasoning, and Baumer Foods
  • Aminola
  • Sacchetto SpA
  • Others
Report Coverage Market Forecast, Company Share Analysis, Competition Intelligence, Drivers Restraints Opportunity Trends Analysis, Market Dynamics and Challenges, and Strategic Growth Initiatives

Liquid Smoke Industry by Category

By Smoke Type:

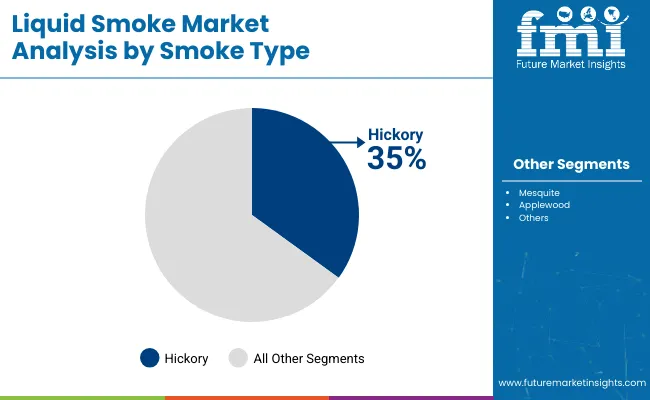
  • Hickory
  • Mesquite
  • Applewood
  • Others

By Application:

  • Bakeries
  • Beverages
  • Dairy
  • Meat and Sea Food
  • Pet Food
  • Others

By Distribution Channel:

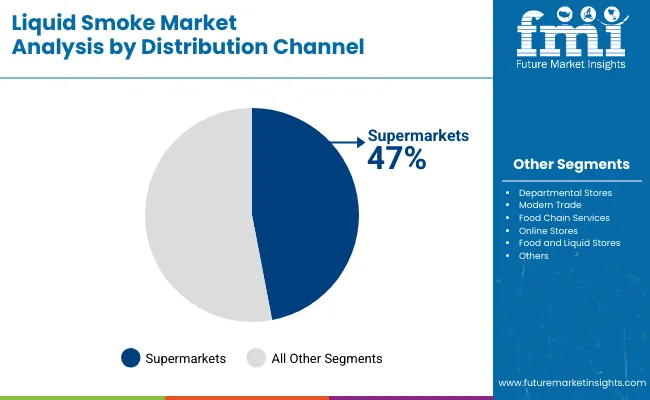
  • Supermarkets
  • Departmental Store
  • Modern Trade
  • Food Chain Services
  • Online Stores
  • Food and Liquid Store
  • Others

By Region, Liquid Smoke Market is Segmented as:

  • North America
  • Latin America
  • Europe
  • Middle East and Africa
  • East Asia
  • South Asia
  • Oceania

Frequently Asked Questions

What is the outlook for the United States Liquid Smoke market?

The United States market is forecast to expand at a CAGR of 6.9% during the forecast period.

Who are the key Liquid Smoke Players?

Aminola, Sacchetto SpA, Colgin, Inc. are key market players.

What is the growth forecast for Liquid Smoke market?

The market is forecast to register a CAGR of 11.7% through 2033.

What will the market size be in 2033?

The market will reach US$ 245 million by 2033.

What is the key trend shaping the industry?

Demand for eco-friendly products is the key trend shaping the industry.

Table of Content

1. Executive Summary | Liquid Smoke Market

  1.1. Global Market Outlook

  1.2. Demand-side Trends

  1.3. Supply-side Trends

  1.4. Technology Roadmap Analysis

  1.5. Analysis and Recommendations

2. Market Overview

  2.1. Market Coverage / Taxonomy

  2.2. Market Definition / Scope / Limitations

3. Market Background

  3.1. Market Dynamics

    3.1.1. Drivers

    3.1.2. Restraints

    3.1.3. Opportunity

    3.1.4. Trends

  3.2. Scenario Forecast

    3.2.1. Demand in Optimistic Scenario

    3.2.2. Demand in Likely Scenario

    3.2.3. Demand in Conservative Scenario

  3.3. Product launches & Recent Developments

  3.4. Product Life Cycle Analysis

  3.5. Value Chain Analysis

 3.5.1. Supply Side Participants and their Roles

    3.5.1.1. Producers

    3.5.1.2. Mid-Level Participants (Traders/ Agents/ Brokers)

    3.5.1.3. Wholesalers and Distributors

 3.5.2. % of Operating Margin Analysis

 3.5.3. List of Raw Material Suppliers

 3.5.4. List of Existing and Potential Buyer’s

  3.6. Global Market - Pricing Analysis

 3.6.1. Price Point Assessment by Region

 3.6.2. Price Point Assessment by Product Type

 3.6.3. Price Forecast till 2033

 3.6.4. Factors affecting pricing

  3.7. Forecast Factors - Relevance & Impact

  3.8. PESTLE and Porter’s Analysis

  3.9. Regulatory Landscape

 3.9.1. Packaging & Labelling Regulations

 3.9.2. Certifications and Certifying Agency Overview

 3.9.3. Import/Export Policies

  3.10. Regional Parent Market Outlook

  3.11. Production and Consumption Statistics

  3.12. Import and Export Statistics

  3.13. Consumers Survey Analysis

  3.14. Macro-Economic Factors

  3.15. Product Claims & Nutritional Information Scan by Buyers

4. Global Market Analysis 2018 to 2022 and Forecast, 2023 to 2033

  4.1. Historical Market Size Value (US$ Million) & Volume (MT) Analysis, 2018 to 2022

  4.2. Current and Future Market Size Value (US$ Million) & Volume (MT) Projections, 2023 to 2033

  4.2.1. Y-o-Y Growth Trend Analysis

  4.2.2. Absolute $ Opportunity Analysis

5. Global Market Analysis 2018 to 2022 and Forecast 2023 to 2033, By Smoke Type

  5.1. Introduction / Key Findings

  5.2. Historical Market Size Value (US$ Million) & Volume (MT) Analysis by Smoke Type, 2018 to 2022

  5.3. Current and Future Market Size Value (US$ Million) & Volume (MT) Analysis and Forecast by Smoke Type, 2023 to 2033

  5.3.1. Hickory

  5.3.2. Mesquite

  5.3.3. Applewood

  5.3.4. Others

  5.4. Y-o-Y Growth Trend Analysis by Smoke Type, 2018 to 2022

  5.5. Absolute $ Opportunity Analysis by Smoke Type, 2023 to 2033

6. Global Market Analysis 2018 to 2022 and Forecast 2023 to 2033, By Application

  6.1. Introduction / Key Findings

  6.2. Historical Market Size Value (US$ Million) & Volume (MT) Analysis by Application, 2018 to 2022

  6.3. Current and Future Market Size Value (US$ Million) & Volume (MT) Analysis and Forecast by Application, 2023 to 2033

  6.3.1. Bakeries

    6.3.2. Dairy

    6.3.3. Meat and Sea Food

    6.3.4. Pet Food

    6.3.5. Others

  6.4. Y-o-Y Growth Trend Analysis by Application, 2018 to 2022

  6.5. Absolute $ Opportunity Analysis by Application, 2023 to 2033

7. Global Market Analysis 2018 to 2022 and Forecast 2023 to 2033, By Distributional Channel

  7.1. Introduction / Key Findings

  7.2. Historical Market Size Value (US$ Million) & Volume (MT) Analysis by Distributional Channel, 2018 to 2022

  7.3. Current and Future Market Size Value (US$ Million) & Volume (MT) Analysis and Forecast by Distributional Channel, 2023 to 2033

  7.3.1. Departmental Store

    7.3.2. Modern Trade

    7.3.3. Food Chain Services

    7.3.4. Online Stores

    7.3.5. Food and Liquid Store

    7.3.6. Supermarkets

  7.4. Y-o-Y Growth Trend Analysis by Distributional Channel, 2018 to 2022

  7.5. Absolute $ Opportunity Analysis by Distributional Channel, 2023 to 2033

8. Global Market Analysis 2018 to 2022 and Forecast 2023 to 2033, By Region

8.1. Introduction

8.2. Historical Market Size Value (US$ Million) & Volume (MT) Analysis by Region, 2018 to 2022

8.3. Current Market Size Value (US$ Million) & Volume (MT) Analysis and Forecast by Region, 2023 to 2033

    8.3.1. North America

    8.3.2. Latin America

    8.3.3. Europe

    8.3.4. East Asia

    8.3.5. South Asia

    8.3.6. Oceania

    8.3.7. Middle East & Africa

8.4. Market Attractiveness Analysis by Region

9. North America Market Analysis 2018 to 2022 and Forecast 2023 to 2033, By Country

9.1. Historical Market Size Value (US$ Million) & Volume (MT) Trend Analysis by Market Taxonomy, 2018 to 2022

9.2. Market Size Value (US$ Million) & Volume (MT) Forecast by Market Taxonomy, 2023 to 2033

    9.2.1. By Country

9.2.1.1. USA

9.2.1.2. Canada

    9.2.2. By Smoke Type

    9.2.3. By Application

    9.2.4. By Distributional Channel

9.3. Market Attractiveness Analysis

    9.3.1. By Country

    9.3.2. By Smoke Type

    9.3.3. By Application

    9.3.4. By Distributional Channel

9.4. Key Takeaways

10. Latin America Market Analysis 2018 to 2022 and Forecast 2023 to 2033, By Country

10.1. Historical Market Size Value (US$ Million) & Volume (MT) Trend Analysis by Market Taxonomy, 2018 to 2022

10.2. Market Size Value (US$ Million) & Volume (MT) Forecast by Market Taxonomy, 2023 to 2033

    10.2.1. By Country

10.2.1.1. Brazil

10.2.1.2. Mexico

10.2.1.3. Argentina

10.2.1.4. Chile

10.2.1.5. Peru

10.2.1.6. Rest of Latin America

    10.2.2. By Smoke Type

    10.2.3. By Application

    10.2.4. By Distributional Channel

10.3. Market Attractiveness Analysis

    10.3.1. By Country

    10.3.2. By Smoke Type

    10.3.3. By Application

    10.3.4. By Distributional Channel

10.4. Key Takeaways

11. Europe Market Analysis 2018 to 2022 and Forecast 2023 to 2033, By Country

11.1. Historical Market Size Value (US$ Million) & Volume (MT) Trend Analysis by Market Taxonomy, 2018 to 2022

11.2. Market Size Value (US$ Million) & Volume (MT) Forecast by Market Taxonomy, 2023 to 2033

    11.2.1. By Country

11.2.1.1. Germany

11.2.1.2. Italy

11.2.1.3. France

11.2.1.4. United Kingdom

11.2.1.5. Spain

11.2.1.6. Russia

11.2.1.7. BENELUX

11.2.1.8. Poland

11.2.1.9. Nordic Countries

11.2.1.10. Rest of Europe

    11.2.2. By Smoke Type

    11.2.3. By Application

    11.2.4. By Distributional Channel

11.3. Market Attractiveness Analysis

    11.3.1. By Country

    11.3.2. By Smoke Type

    11.3.3. By Application

    11.3.4. By Distributional Channel

11.4. Key Takeaways

12. East Asia Market Analysis 2018 to 2022 and Forecast 2023 to 2033, By Country

12.1. Historical Market Size Value (US$ Million) & Volume (MT) Trend Analysis by Market Taxonomy, 2018 to 2022

12.2. Market Size Value (US$ Million) & Volume (MT) Forecast by Market Taxonomy, 2023 to 2033

    12.2.1. By Country

12.2.1.1. China

12.2.1.2. Japan

12.2.1.3. South Korea

    12.2.2. By Smoke Type

    12.2.3. By Application

    12.2.4. By Distributional Channel

12.3. Market Attractiveness Analysis

    12.3.1. By Country

    12.3.2. By Smoke Type

    12.3.3. By Application

    12.3.4. By Distributional Channel

12.4. Key Takeaways

13. South Asia Market Analysis 2018 to 2022 and Forecast 2023 to 2033, By Country

13.1. Historical Market Size Value (US$ Million) & Volume (MT) Trend Analysis by Market Taxonomy, 2018 to 2022

13.2. Market Size Value (US$ Million) & Volume (MT) Forecast by Market Taxonomy, 2023 to 2033

    13.2.1. By Country

13.2.1.1. India

13.2.1.2. Thailand

13.2.1.3. Malaysia

13.2.1.4. Indonesia

13.2.1.5. Singapore

13.2.1.6. Rest of South Asia

    13.2.2. By Smoke Type

    13.2.3. By Application

    13.2.4. By Distributional Channel

13.3. Market Attractiveness Analysis

    13.3.1. By Country

    13.3.2. By Smoke Type

    13.3.3. By Application

    13.3.4. By Distributional Channel

13.4. Key Takeaways

14. Oceania Market Analysis 2018 to 2022 and Forecast 2023 to 2033, By Country

14.1. Historical Market Size Value (US$ Million) & Volume (MT) Trend Analysis by Market Taxonomy, 2018 to 2022

14.2. Market Size Value (US$ Million) & Volume (MT) Forecast by Market Taxonomy, 2023 to 2033

    14.2.1. By Country

14.2.1.1. Australia

14.2.1.2. New Zealand

    14.2.2. By Smoke Type

    14.2.3. By Application

    14.2.4. By Distributional Channel

14.3. Market Attractiveness Analysis

    14.3.1. By Country

    14.3.2. By Smoke Type

    14.3.3. By Application

    14.3.4. By Distributional Channel

14.4. Key Takeaways

15. Middle East & Africa Market Analysis 2018 to 2022 and Forecast 2023 to 2033, By Country

15.1. Historical Market Size Value (US$ Million) & Volume (MT) Trend Analysis by Market Taxonomy, 2018 to 2022

15.2. Market Size Value (US$ Million) & Volume (MT) Forecast by Market Taxonomy, 2023 to 2033

    15.2.1. By Country

15.2.1.1. GCC Countries

15.2.1.2. South Africa

15.2.1.3. Central Africa

15.2.1.4. North Africa

    15.2.2. By Smoke Type

    15.2.3. By Application

    15.2.4. By Distributional Channel

15.3. Market Attractiveness Analysis

    15.3.1. By Country

    15.3.2. By Smoke Type

    15.3.3. By Application

    15.3.4. By Distributional Channel

15.4. Key Takeaways

16. Key Countries Market Analysis

16.1. USA

 16.1.1. Pricing Analysis

 16.1.2. Market Share Analysis, 2023

    16.1.2.1. By Smoke Type

    16.1.2.2. By Application

    16.1.2.3. By Distributional Channel

16.2. Canada

 16.2.1. Pricing Analysis

 16.2.2. Market Share Analysis, 2023

    16.2.2.1. By Smoke Type

    16.2.2.2. By Application

    16.2.2.3. By Distributional Channel

16.3. Brazil

 16.3.1. Pricing Analysis

 16.3.2. Market Share Analysis, 2023

    16.3.2.1. By Smoke Type

    16.3.2.2. By Application

    16.3.2.3. By Distributional Channel

16.4. Mexico

 16.4.1. Pricing Analysis

 16.4.2. Market Share Analysis, 2023

    16.4.2.1. By Smoke Type

    16.4.2.2. By Application

    16.4.2.3. By Distributional Channel

16.5. Argentina

 16.5.1. Pricing Analysis

 16.5.2. Market Share Analysis, 2023

    16.5.2.1. By Smoke Type

    16.5.2.2. By Application

    16.5.2.3. By Distributional Channel

16.6. Chile

 16.6.1. Pricing Analysis

 16.6.2. Market Share Analysis, 2023

    16.6.2.1. By Smoke Type

    16.6.2.2. By Application

    16.6.2.3. By Distributional Channel

16.7. Peru

 16.7.1. Pricing Analysis

 16.7.2. Market Share Analysis, 2023

    16.7.2.1. By Smoke Type

    16.7.2.2. By Application

    16.7.2.3. By Distributional Channel

16.8. Germany

 16.8.1. Pricing Analysis

 16.8.2. Market Share Analysis, 2023

    16.8.2.1. By Smoke Type

    16.8.2.2. By Application

    16.8.2.3. By Distributional Channel

16.9. Italy

 16.9.1. Pricing Analysis

 16.9.2. Market Share Analysis, 2023

    16.9.2.1. By Smoke Type

    16.9.2.2. By Application

    16.9.2.3. By Distributional Channel

16.10. France

 16.10.1. Pricing Analysis

 16.10.2. Market Share Analysis, 2023

    16.10.2.1. By Smoke Type

    16.10.2.2. By Application

    16.10.2.3. By Distributional Channel

16.11. Spain

 16.11.1. Pricing Analysis

 16.11.2. Market Share Analysis, 2023

    16.11.2.1. By Smoke Type

    16.11.2.2. By Application

    16.11.2.3. By Distributional Channel

16.12. United Kingdom

 16.12.1. Pricing Analysis

 16.12.2. Market Share Analysis, 2023

    16.12.2.1. By Smoke Type

    16.12.2.2. By Application

    16.12.2.3. By Distributional Channel

16.13. Russia

 16.13.1. Pricing Analysis

 16.13.2. Market Share Analysis, 2023

    16.13.2.1. By Smoke Type

    16.13.2.2. By Application

    16.13.2.3. By Distributional Channel

16.14. Poland

 16.14.1. Pricing Analysis

 16.14.2. Market Share Analysis, 2023

    16.14.2.1. By Smoke Type

    16.14.2.2. By Application

    16.14.2.3. By Distributional Channel

16.15. BENELUX

 16.15.1. Pricing Analysis

 16.15.2. Market Share Analysis, 2023

    16.15.2.1. By Smoke Type

    16.15.2.2. By Application

    16.15.2.3. By Distributional Channel

16.16. Nordic Countries

 16.16.1. Pricing Analysis

 16.16.2. Market Share Analysis, 2023

    16.16.2.1. By Smoke Type

    16.16.2.2. By Application

    16.16.2.3. By Distributional Channel

16.17. China

 16.17.1. Pricing Analysis

 16.17.2. Market Share Analysis, 2023

    16.17.2.1. By Smoke Type

    16.17.2.2. By Application

    16.17.2.3. By Distributional Channel

16.18. Japan

 16.18.1. Pricing Analysis

 16.18.2. Market Share Analysis, 2023

    16.18.2.1. By Smoke Type

    16.18.2.2. By Application

    16.18.2.3. By Distributional Channel

16.19. South Korea

 16.19.1. Pricing Analysis

 16.19.2. Market Share Analysis, 2023

    16.19.2.1. By Smoke Type

    16.19.2.2. By Application

    16.19.2.3. By Distributional Channel

16.20. India

 16.20.1. Pricing Analysis

 16.20.2. Market Share Analysis, 2023

    16.20.2.1. By Smoke Type

    16.20.2.2. By Application

    16.20.2.3. By Distributional Channel

16.21. Thailand

 16.21.1. Pricing Analysis

 16.21.2. Market Share Analysis, 2023

    16.21.2.1. By Smoke Type

    16.21.2.2. By Application

    16.21.2.3. By Distributional Channel

16.22. Indonesia

 16.22.1. Pricing Analysis

 16.22.2. Market Share Analysis, 2023

    16.22.2.1. By Smoke Type

    16.22.2.2. By Application

    16.22.2.3. By Distributional Channel

16.23. Malaysia

 16.23.1. Pricing Analysis

 16.23.2. Market Share Analysis, 2023

    16.23.2.1. By Smoke Type

    16.23.2.2. By Application

    16.23.2.3. By Distributional Channel

16.24. Singapore

 16.24.1. Pricing Analysis

 16.24.2. Market Share Analysis, 2023

    16.24.2.1. By Smoke Type

    16.24.2.2. By Application

    16.24.2.3. By Distributional Channel

16.25. Australia

 16.25.1. Pricing Analysis

 16.25.2. Market Share Analysis, 2023

    16.25.2.1. By Smoke Type

    16.25.2.2. By Application

    16.25.2.3. By Distributional Channel

16.26. New Zealand

 16.26.1. Pricing Analysis

 16.26.2. Market Share Analysis, 2023

    16.26.2.1. By Smoke Type

    16.26.2.2. By Application

    16.26.2.3. By Distributional Channel

16.27. GCC Countries

 16.27.1. Pricing Analysis

 16.27.2. Market Share Analysis, 2023

    16.27.2.1. By Smoke Type

    16.27.2.2. By Application

    16.27.2.3. By Distributional Channel

16.28. South Africa

 16.28.1. Pricing Analysis

 16.28.2. Market Share Analysis, 2023

    16.28.2.1. By Smoke Type

    16.28.2.2. By Application

    16.28.2.3. By Distributional Channel

16.29. North Africa

 16.29.1. Pricing Analysis

 16.29.2. Market Share Analysis, 2023

    16.29.2.1. By Smoke Type

    16.29.2.2. By Application

    16.29.2.3. By Distributional Channel

16.30. Central Africa

 16.30.1. Pricing Analysis

 16.30.2. Market Share Analysis, 2023

    16.30.2.1. By Smoke Type

    16.30.2.2. By Application

    16.30.2.3. By Distributional Channel

17. Market Structure Analysis

  17.1. Competition Dashboard

  17.2. Competition Benchmarking

  17.3. Market Share Analysis of Top Players

     17.3.1. By Regional

     17.3.2. By Smoke Type

     17.3.3. By Application

     17.3.4. By Distributional Channel

18. Competition Analysis

  18.1. Competition Deep Dive

  18.1.1. Azelis Holdings S.A.

    18.1.1.1. Overview

    18.1.1.2. Product Portfolio

    18.1.1.3. Profitability by Market Segments (Smoke Type/Application/Distribution Channel/Region)

    18.1.1.4. Sales Footprint

    18.1.1.5. Strategy Overview

    18.1.1.5.1. Marketing Strategy

    18.1.1.5.2. Product Strategy

    18.1.1.5.3. Channel Strategy

  18.1.2. B&G Foods, Inc.

    18.1.2.1. Overview

    18.1.2.2. Product Portfolio

    18.1.2.3. Profitability by Market Segments (Smoke Type/Application/Distribution Channel/Region)

    18.1.2.4. Sales Footprint

    18.1.2.5. Strategy Overview

    18.1.2.5.1. Marketing Strategy

    18.1.2.5.2. Product Strategy

    18.1.2.5.3. Channel Strategy

  18.1.3. International Flavors & Fragrances, Inc.

    18.1.3.1. Overview

    18.1.3.2. Product Portfolio

    18.1.3.3. Profitability by Market Segments (Smoke Type/Application/Distribution Channel/Region)

    18.1.3.4. Sales Footprint

    18.1.3.5. Strategy Overview

    18.1.3.5.1. Marketing Strategy

    18.1.3.5.2. Product Strategy

    18.1.3.5.3. Channel Strategy

  18.1.4. McCormick & Company, Inc.

    18.1.4.1. Overview

    18.1.4.2. Product Portfolio

    18.1.4.3. Profitability by Market Segments (Smoke Type/Application/Distribution Channel/Region)

    18.1.4.4. Sales Footprint

    18.1.4.5. Strategy Overview

    18.1.4.5.1. Marketing Strategy

    18.1.4.5.2. Product Strategy

    18.1.4.5.3. Channel Strategy

  18.1.5. Kerry Group PLC

    18.1.5.1. Overview

    18.1.5.2. Product Portfolio

    18.1.5.3. Profitability by Market Segments (Smoke Type/Application/Distribution Channel/Region)

    18.1.5.4. Sales Footprint

    18.1.5.5. Strategy Overview

    18.1.5.5.1. Marketing Strategy

    18.1.5.5.2. Product Strategy

    18.1.5.5.3. Channel Strategy

  18.1.6. Colgin, Inc.

    18.1.6.1. Overview

    18.1.6.2. Product Portfolio

    18.1.6.3. Profitability by Market Segments (Smoke Type/Application/Distribution Channel/Region)

    18.1.6.4. Sales Footprint

    18.1.6.5. Strategy Overview

    18.1.6.5.1. Marketing Strategy

    18.1.6.5.2. Product Strategy

    18.1.6.5.3. Channel Strategy

  18.1.7. MSK Ingredients Limited

    18.1.7.1. Overview

    18.1.7.2. Product Portfolio

    18.1.7.3. Profitability by Market Segments (Smoke Type/Application/Distribution Channel/Region)

    18.1.7.4. Sales Footprint

    18.1.7.5. Strategy Overview

    18.1.7.5.1. Marketing Strategy

    18.1.7.5.2. Product Strategy

    18.1.7.5.3. Channel Strategy

  18.1.8. PS Seasoning, and Baumer Foods

    18.1.8.1. Overview

    18.1.8.2. Product Portfolio

    18.1.8.3. Profitability by Market Segments (Smoke Type/Application/Distribution Channel/Region)

    18.1.8.4. Sales Footprint

    18.1.8.5. Strategy Overview

    18.1.8.5.1. Marketing Strategy

    18.1.8.5.2. Product Strategy

    18.1.8.5.3. Channel Strategy

  18.1.9. Aminola

    18.1.9.1. Overview

    18.1.9.2. Product Portfolio

    18.1.9.3. Profitability by Market Segments (Smoke Type/Application/Distribution Channel/Region)

    18.1.9.4. Sales Footprint

    18.1.9.5. Strategy Overview

    18.1.9.5.1. Marketing Strategy

    18.1.9.5.2. Product Strategy

    18.1.9.5.3. Channel Strategy

  18.1.10. Sacchetto SpA

    18.1.10.1. Overview

    18.1.10.2. Product Portfolio

    18.1.10.3. Profitability by Market Segments (Smoke Type/Application/Distribution Channel/Region)

    18.1.10.4. Sales Footprint

    18.1.10.5. Strategy Overview

    18.1.10.5.1. Marketing Strategy

    18.1.10.5.2. Product Strategy

    18.1.10.5.3. Channel Strategy

19. Assumptions & Acronyms Used

20. Research Methodology

Don't pay for what you don't need

Customize your report by selecting specific countries or regions and save 30%!

List of Tables

Table 1: Global Market Value (US$ Million) Forecast by Region, 2018 to 2033

Table 2: Global Market Volume (MT) Forecast by Region, 2018 to 2033

Table 3: Global Market Value (US$ Million) Forecast by Smoke Type, 2018 to 2033

Table 4: Global Market Volume (MT) Forecast by Smoke Type, 2018 to 2033

Table 5: Global Market Value (US$ Million) Forecast by Application, 2018 to 2033

Table 6: Global Market Volume (MT) Forecast by Application, 2018 to 2033

Table 7: Global Market Value (US$ Million) Forecast by Distributional Channel, 2018 to 2033

Table 8: Global Market Volume (MT) Forecast by Distributional Channel, 2018 to 2033

Table 9: North America Market Value (US$ Million) Forecast by Country, 2018 to 2033

Table 10: North America Market Volume (MT) Forecast by Country, 2018 to 2033

Table 11: North America Market Value (US$ Million) Forecast by Smoke Type, 2018 to 2033

Table 12: North America Market Volume (MT) Forecast by Smoke Type, 2018 to 2033

Table 13: North America Market Value (US$ Million) Forecast by Application, 2018 to 2033

Table 14: North America Market Volume (MT) Forecast by Application, 2018 to 2033

Table 15: North America Market Value (US$ Million) Forecast by Distributional Channel, 2018 to 2033

Table 16: North America Market Volume (MT) Forecast by Distributional Channel, 2018 to 2033

Table 17: Latin America Market Value (US$ Million) Forecast by Country, 2018 to 2033

Table 18: Latin America Market Volume (MT) Forecast by Country, 2018 to 2033

Table 19: Latin America Market Value (US$ Million) Forecast by Smoke Type, 2018 to 2033

Table 20: Latin America Market Volume (MT) Forecast by Smoke Type, 2018 to 2033

Table 21: Latin America Market Value (US$ Million) Forecast by Application, 2018 to 2033

Table 22: Latin America Market Volume (MT) Forecast by Application, 2018 to 2033

Table 23: Latin America Market Value (US$ Million) Forecast by Distributional Channel, 2018 to 2033

Table 24: Latin America Market Volume (MT) Forecast by Distributional Channel, 2018 to 2033

Table 25: Europe Market Value (US$ Million) Forecast by Country, 2018 to 2033

Table 26: Europe Market Volume (MT) Forecast by Country, 2018 to 2033

Table 27: Europe Market Value (US$ Million) Forecast by Smoke Type, 2018 to 2033

Table 28: Europe Market Volume (MT) Forecast by Smoke Type, 2018 to 2033

Table 29: Europe Market Value (US$ Million) Forecast by Application, 2018 to 2033

Table 30: Europe Market Volume (MT) Forecast by Application, 2018 to 2033

Table 31: Europe Market Value (US$ Million) Forecast by Distributional Channel, 2018 to 2033

Table 32: Europe Market Volume (MT) Forecast by Distributional Channel, 2018 to 2033

Table 33: East Asia Market Value (US$ Million) Forecast by Country, 2018 to 2033

Table 34: East Asia Market Volume (MT) Forecast by Country, 2018 to 2033

Table 35: East Asia Market Value (US$ Million) Forecast by Smoke Type, 2018 to 2033

Table 36: East Asia Market Volume (MT) Forecast by Smoke Type, 2018 to 2033

Table 37: East Asia Market Value (US$ Million) Forecast by Application, 2018 to 2033

Table 38: East Asia Market Volume (MT) Forecast by Application, 2018 to 2033

Table 39: East Asia Market Value (US$ Million) Forecast by Distributional Channel, 2018 to 2033

Table 40: East Asia Market Volume (MT) Forecast by Distributional Channel, 2018 to 2033

Table 41: South Asia Market Value (US$ Million) Forecast by Country, 2018 to 2033

Table 42: South Asia Market Volume (MT) Forecast by Country, 2018 to 2033

Table 43: South Asia Market Value (US$ Million) Forecast by Smoke Type, 2018 to 2033

Table 44: South Asia Market Volume (MT) Forecast by Smoke Type, 2018 to 2033

Table 45: South Asia Market Value (US$ Million) Forecast by Application, 2018 to 2033

Table 46: South Asia Market Volume (MT) Forecast by Application, 2018 to 2033

Table 47: South Asia Market Value (US$ Million) Forecast by Distributional Channel, 2018 to 2033

Table 48: South Asia Market Volume (MT) Forecast by Distributional Channel, 2018 to 2033

Table 49: Oceania Market Value (US$ Million) Forecast by Country, 2018 to 2033

Table 50: Oceania Market Volume (MT) Forecast by Country, 2018 to 2033

Table 51: Oceania Market Value (US$ Million) Forecast by Smoke Type, 2018 to 2033

Table 52: Oceania Market Volume (MT) Forecast by Smoke Type, 2018 to 2033

Table 53: Oceania Market Value (US$ Million) Forecast by Application, 2018 to 2033

Table 54: Oceania Market Volume (MT) Forecast by Application, 2018 to 2033

Table 55: Oceania Market Value (US$ Million) Forecast by Distributional Channel, 2018 to 2033

Table 56: Oceania Market Volume (MT) Forecast by Distributional Channel, 2018 to 2033

Table 57: Middle East & Africa Market Value (US$ Million) Forecast by Country, 2018 to 2033

Table 58: Middle East & Africa Market Volume (MT) Forecast by Country, 2018 to 2033

Table 59: Middle East & Africa Market Value (US$ Million) Forecast by Smoke Type, 2018 to 2033

Table 60: Middle East & Africa Market Volume (MT) Forecast by Smoke Type, 2018 to 2033

Table 61: Middle East & Africa Market Value (US$ Million) Forecast by Application, 2018 to 2033

Table 62: Middle East & Africa Market Volume (MT) Forecast by Application, 2018 to 2033

Table 63: Middle East & Africa Market Value (US$ Million) Forecast by Distributional Channel, 2018 to 2033

Table 64: Middle East & Africa Market Volume (MT) Forecast by Distributional Channel, 2018 to 2033
Nandini Roy Choudhury

Principal Consultant

Talk to Analyst

Find your sweet spots for generating winning opportunities in this market.

List of Charts

Figure 1: Global Market Value (US$ Million) by Smoke Type, 2023 to 2033

Figure 2: Global Market Value (US$ Million) by Application, 2023 to 2033

Figure 3: Global Market Value (US$ Million) by Distributional Channel, 2023 to 2033

Figure 4: Global Market Value (US$ Million) by Region, 2023 to 2033

Figure 5: Global Market Value (US$ Million) Analysis by Region, 2018 to 2033

Figure 6: Global Market Volume (MT) Analysis by Region, 2018 to 2033

Figure 7: Global Market Value Share (%) and BPS Analysis by Region, 2023 to 2033

Figure 8: Global Market Y-o-Y Growth (%) Projections by Region, 2023 to 2033

Figure 9: Global Market Value (US$ Million) Analysis by Smoke Type, 2018 to 2033

Figure 10: Global Market Volume (MT) Analysis by Smoke Type, 2018 to 2033

Figure 11: Global Market Value Share (%) and BPS Analysis by Smoke Type, 2023 to 2033

Figure 12: Global Market Y-o-Y Growth (%) Projections by Smoke Type, 2023 to 2033

Figure 13: Global Market Value (US$ Million) Analysis by Application, 2018 to 2033

Figure 14: Global Market Volume (MT) Analysis by Application, 2018 to 2033

Figure 15: Global Market Value Share (%) and BPS Analysis by Application, 2023 to 2033

Figure 16: Global Market Y-o-Y Growth (%) Projections by Application, 2023 to 2033

Figure 17: Global Market Value (US$ Million) Analysis by Distributional Channel, 2018 to 2033

Figure 18: Global Market Volume (MT) Analysis by Distributional Channel, 2018 to 2033

Figure 19: Global Market Value Share (%) and BPS Analysis by Distributional Channel, 2023 to 2033

Figure 20: Global Market Y-o-Y Growth (%) Projections by Distributional Channel, 2023 to 2033

Figure 21: Global Market Attractiveness by Smoke Type, 2023 to 2033

Figure 22: Global Market Attractiveness by Application, 2023 to 2033

Figure 23: Global Market Attractiveness by Distributional Channel, 2023 to 2033

Figure 24: Global Market Attractiveness by Region, 2023 to 2033

Figure 25: North America Market Value (US$ Million) by Smoke Type, 2023 to 2033

Figure 26: North America Market Value (US$ Million) by Application, 2023 to 2033

Figure 27: North America Market Value (US$ Million) by Distributional Channel, 2023 to 2033

Figure 28: North America Market Value (US$ Million) by Country, 2023 to 2033

Figure 29: North America Market Value (US$ Million) Analysis by Country, 2018 to 2033

Figure 30: North America Market Volume (MT) Analysis by Country, 2018 to 2033

Figure 31: North America Market Value Share (%) and BPS Analysis by Country, 2023 to 2033

Figure 32: North America Market Y-o-Y Growth (%) Projections by Country, 2023 to 2033

Figure 33: North America Market Value (US$ Million) Analysis by Smoke Type, 2018 to 2033

Figure 34: North America Market Volume (MT) Analysis by Smoke Type, 2018 to 2033

Figure 35: North America Market Value Share (%) and BPS Analysis by Smoke Type, 2023 to 2033

Figure 36: North America Market Y-o-Y Growth (%) Projections by Smoke Type, 2023 to 2033

Figure 37: North America Market Value (US$ Million) Analysis by Application, 2018 to 2033

Figure 38: North America Market Volume (MT) Analysis by Application, 2018 to 2033

Figure 39: North America Market Value Share (%) and BPS Analysis by Application, 2023 to 2033

Figure 40: North America Market Y-o-Y Growth (%) Projections by Application, 2023 to 2033

Figure 41: North America Market Value (US$ Million) Analysis by Distributional Channel, 2018 to 2033

Figure 42: North America Market Volume (MT) Analysis by Distributional Channel, 2018 to 2033

Figure 43: North America Market Value Share (%) and BPS Analysis by Distributional Channel, 2023 to 2033

Figure 44: North America Market Y-o-Y Growth (%) Projections by Distributional Channel, 2023 to 2033

Figure 45: North America Market Attractiveness by Smoke Type, 2023 to 2033

Figure 46: North America Market Attractiveness by Application, 2023 to 2033

Figure 47: North America Market Attractiveness by Distributional Channel, 2023 to 2033

Figure 48: North America Market Attractiveness by Country, 2023 to 2033

Figure 49: Latin America Market Value (US$ Million) by Smoke Type, 2023 to 2033

Figure 50: Latin America Market Value (US$ Million) by Application, 2023 to 2033

Figure 51: Latin America Market Value (US$ Million) by Distributional Channel, 2023 to 2033

Figure 52: Latin America Market Value (US$ Million) by Country, 2023 to 2033

Figure 53: Latin America Market Value (US$ Million) Analysis by Country, 2018 to 2033

Figure 54: Latin America Market Volume (MT) Analysis by Country, 2018 to 2033

Figure 55: Latin America Market Value Share (%) and BPS Analysis by Country, 2023 to 2033

Figure 56: Latin America Market Y-o-Y Growth (%) Projections by Country, 2023 to 2033

Figure 57: Latin America Market Value (US$ Million) Analysis by Smoke Type, 2018 to 2033

Figure 58: Latin America Market Volume (MT) Analysis by Smoke Type, 2018 to 2033

Figure 59: Latin America Market Value Share (%) and BPS Analysis by Smoke Type, 2023 to 2033

Figure 60: Latin America Market Y-o-Y Growth (%) Projections by Smoke Type, 2023 to 2033

Figure 61: Latin America Market Value (US$ Million) Analysis by Application, 2018 to 2033

Figure 62: Latin America Market Volume (MT) Analysis by Application, 2018 to 2033

Figure 63: Latin America Market Value Share (%) and BPS Analysis by Application, 2023 to 2033

Figure 64: Latin America Market Y-o-Y Growth (%) Projections by Application, 2023 to 2033

Figure 65: Latin America Market Value (US$ Million) Analysis by Distributional Channel, 2018 to 2033

Figure 66: Latin America Market Volume (MT) Analysis by Distributional Channel, 2018 to 2033

Figure 67: Latin America Market Value Share (%) and BPS Analysis by Distributional Channel, 2023 to 2033

Figure 68: Latin America Market Y-o-Y Growth (%) Projections by Distributional Channel, 2023 to 2033

Figure 69: Latin America Market Attractiveness by Smoke Type, 2023 to 2033

Figure 70: Latin America Market Attractiveness by Application, 2023 to 2033

Figure 71: Latin America Market Attractiveness by Distributional Channel, 2023 to 2033

Figure 72: Latin America Market Attractiveness by Country, 2023 to 2033

Figure 73: Europe Market Value (US$ Million) by Smoke Type, 2023 to 2033

Figure 74: Europe Market Value (US$ Million) by Application, 2023 to 2033

Figure 75: Europe Market Value (US$ Million) by Distributional Channel, 2023 to 2033

Figure 76: Europe Market Value (US$ Million) by Country, 2023 to 2033

Figure 77: Europe Market Value (US$ Million) Analysis by Country, 2018 to 2033

Figure 78: Europe Market Volume (MT) Analysis by Country, 2018 to 2033

Figure 79: Europe Market Value Share (%) and BPS Analysis by Country, 2023 to 2033

Figure 80: Europe Market Y-o-Y Growth (%) Projections by Country, 2023 to 2033

Figure 81: Europe Market Value (US$ Million) Analysis by Smoke Type, 2018 to 2033

Figure 82: Europe Market Volume (MT) Analysis by Smoke Type, 2018 to 2033

Figure 83: Europe Market Value Share (%) and BPS Analysis by Smoke Type, 2023 to 2033

Figure 84: Europe Market Y-o-Y Growth (%) Projections by Smoke Type, 2023 to 2033

Figure 85: Europe Market Value (US$ Million) Analysis by Application, 2018 to 2033

Figure 86: Europe Market Volume (MT) Analysis by Application, 2018 to 2033

Figure 87: Europe Market Value Share (%) and BPS Analysis by Application, 2023 to 2033

Figure 88: Europe Market Y-o-Y Growth (%) Projections by Application, 2023 to 2033

Figure 89: Europe Market Value (US$ Million) Analysis by Distributional Channel, 2018 to 2033

Figure 90: Europe Market Volume (MT) Analysis by Distributional Channel, 2018 to 2033

Figure 91: Europe Market Value Share (%) and BPS Analysis by Distributional Channel, 2023 to 2033

Figure 92: Europe Market Y-o-Y Growth (%) Projections by Distributional Channel, 2023 to 2033

Figure 93: Europe Market Attractiveness by Smoke Type, 2023 to 2033

Figure 94: Europe Market Attractiveness by Application, 2023 to 2033

Figure 95: Europe Market Attractiveness by Distributional Channel, 2023 to 2033

Figure 96: Europe Market Attractiveness by Country, 2023 to 2033

Figure 97: East Asia Market Value (US$ Million) by Smoke Type, 2023 to 2033

Figure 98: East Asia Market Value (US$ Million) by Application, 2023 to 2033

Figure 99: East Asia Market Value (US$ Million) by Distributional Channel, 2023 to 2033

Figure 100: East Asia Market Value (US$ Million) by Country, 2023 to 2033

Figure 101: East Asia Market Value (US$ Million) Analysis by Country, 2018 to 2033

Figure 102: East Asia Market Volume (MT) Analysis by Country, 2018 to 2033

Figure 103: East Asia Market Value Share (%) and BPS Analysis by Country, 2023 to 2033

Figure 104: East Asia Market Y-o-Y Growth (%) Projections by Country, 2023 to 2033

Figure 105: East Asia Market Value (US$ Million) Analysis by Smoke Type, 2018 to 2033

Figure 106: East Asia Market Volume (MT) Analysis by Smoke Type, 2018 to 2033

Figure 107: East Asia Market Value Share (%) and BPS Analysis by Smoke Type, 2023 to 2033

Figure 108: East Asia Market Y-o-Y Growth (%) Projections by Smoke Type, 2023 to 2033

Figure 109: East Asia Market Value (US$ Million) Analysis by Application, 2018 to 2033

Figure 110: East Asia Market Volume (MT) Analysis by Application, 2018 to 2033

Figure 111: East Asia Market Value Share (%) and BPS Analysis by Application, 2023 to 2033

Figure 112: East Asia Market Y-o-Y Growth (%) Projections by Application, 2023 to 2033

Figure 113: East Asia Market Value (US$ Million) Analysis by Distributional Channel, 2018 to 2033

Figure 114: East Asia Market Volume (MT) Analysis by Distributional Channel, 2018 to 2033

Figure 115: East Asia Market Value Share (%) and BPS Analysis by Distributional Channel, 2023 to 2033

Figure 116: East Asia Market Y-o-Y Growth (%) Projections by Distributional Channel, 2023 to 2033

Figure 117: East Asia Market Attractiveness by Smoke Type, 2023 to 2033

Figure 118: East Asia Market Attractiveness by Application, 2023 to 2033

Figure 119: East Asia Market Attractiveness by Distributional Channel, 2023 to 2033

Figure 120: East Asia Market Attractiveness by Country, 2023 to 2033

Figure 121: South Asia Market Value (US$ Million) by Smoke Type, 2023 to 2033

Figure 122: South Asia Market Value (US$ Million) by Application, 2023 to 2033

Figure 123: South Asia Market Value (US$ Million) by Distributional Channel, 2023 to 2033

Figure 124: South Asia Market Value (US$ Million) by Country, 2023 to 2033

Figure 125: South Asia Market Value (US$ Million) Analysis by Country, 2018 to 2033

Figure 126: South Asia Market Volume (MT) Analysis by Country, 2018 to 2033

Figure 127: South Asia Market Value Share (%) and BPS Analysis by Country, 2023 to 2033

Figure 128: South Asia Market Y-o-Y Growth (%) Projections by Country, 2023 to 2033

Figure 129: South Asia Market Value (US$ Million) Analysis by Smoke Type, 2018 to 2033

Figure 130: South Asia Market Volume (MT) Analysis by Smoke Type, 2018 to 2033

Figure 131: South Asia Market Value Share (%) and BPS Analysis by Smoke Type, 2023 to 2033

Figure 132: South Asia Market Y-o-Y Growth (%) Projections by Smoke Type, 2023 to 2033

Figure 133: South Asia Market Value (US$ Million) Analysis by Application, 2018 to 2033

Figure 134: South Asia Market Volume (MT) Analysis by Application, 2018 to 2033

Figure 135: South Asia Market Value Share (%) and BPS Analysis by Application, 2023 to 2033

Figure 136: South Asia Market Y-o-Y Growth (%) Projections by Application, 2023 to 2033

Figure 137: South Asia Market Value (US$ Million) Analysis by Distributional Channel, 2018 to 2033

Figure 138: South Asia Market Volume (MT) Analysis by Distributional Channel, 2018 to 2033

Figure 139: South Asia Market Value Share (%) and BPS Analysis by Distributional Channel, 2023 to 2033

Figure 140: South Asia Market Y-o-Y Growth (%) Projections by Distributional Channel, 2023 to 2033

Figure 141: South Asia Market Attractiveness by Smoke Type, 2023 to 2033

Figure 142: South Asia Market Attractiveness by Application, 2023 to 2033

Figure 143: South Asia Market Attractiveness by Distributional Channel, 2023 to 2033

Figure 144: South Asia Market Attractiveness by Country, 2023 to 2033

Figure 145: Oceania Market Value (US$ Million) by Smoke Type, 2023 to 2033

Figure 146: Oceania Market Value (US$ Million) by Application, 2023 to 2033

Figure 147: Oceania Market Value (US$ Million) by Distributional Channel, 2023 to 2033

Figure 148: Oceania Market Value (US$ Million) by Country, 2023 to 2033

Figure 149: Oceania Market Value (US$ Million) Analysis by Country, 2018 to 2033

Figure 150: Oceania Market Volume (MT) Analysis by Country, 2018 to 2033

Figure 151: Oceania Market Value Share (%) and BPS Analysis by Country, 2023 to 2033

Figure 152: Oceania Market Y-o-Y Growth (%) Projections by Country, 2023 to 2033

Figure 153: Oceania Market Value (US$ Million) Analysis by Smoke Type, 2018 to 2033

Figure 154: Oceania Market Volume (MT) Analysis by Smoke Type, 2018 to 2033

Figure 155: Oceania Market Value Share (%) and BPS Analysis by Smoke Type, 2023 to 2033

Figure 156: Oceania Market Y-o-Y Growth (%) Projections by Smoke Type, 2023 to 2033

Figure 157: Oceania Market Value (US$ Million) Analysis by Application, 2018 to 2033

Figure 158: Oceania Market Volume (MT) Analysis by Application, 2018 to 2033

Figure 159: Oceania Market Value Share (%) and BPS Analysis by Application, 2023 to 2033

Figure 160: Oceania Market Y-o-Y Growth (%) Projections by Application, 2023 to 2033

Figure 161: Oceania Market Value (US$ Million) Analysis by Distributional Channel, 2018 to 2033

Figure 162: Oceania Market Volume (MT) Analysis by Distributional Channel, 2018 to 2033

Figure 163: Oceania Market Value Share (%) and BPS Analysis by Distributional Channel, 2023 to 2033

Figure 164: Oceania Market Y-o-Y Growth (%) Projections by Distributional Channel, 2023 to 2033

Figure 165: Oceania Market Attractiveness by Smoke Type, 2023 to 2033

Figure 166: Oceania Market Attractiveness by Application, 2023 to 2033

Figure 167: Oceania Market Attractiveness by Distributional Channel, 2023 to 2033

Figure 168: Oceania Market Attractiveness by Country, 2023 to 2033

Figure 169: Middle East & Africa Market Value (US$ Million) by Smoke Type, 2023 to 2033

Figure 170: Middle East & Africa Market Value (US$ Million) by Application, 2023 to 2033

Figure 171: Middle East & Africa Market Value (US$ Million) by Distributional Channel, 2023 to 2033

Figure 172: Middle East & Africa Market Value (US$ Million) by Country, 2023 to 2033

Figure 173: Middle East & Africa Market Value (US$ Million) Analysis by Country, 2018 to 2033

Figure 174: Middle East & Africa Market Volume (MT) Analysis by Country, 2018 to 2033

Figure 175: Middle East & Africa Market Value Share (%) and BPS Analysis by Country, 2023 to 2033

Figure 176: Middle East & Africa Market Y-o-Y Growth (%) Projections by Country, 2023 to 2033

Figure 177: Middle East & Africa Market Value (US$ Million) Analysis by Smoke Type, 2018 to 2033

Figure 178: Middle East & Africa Market Volume (MT) Analysis by Smoke Type, 2018 to 2033

Figure 179: Middle East & Africa Market Value Share (%) and BPS Analysis by Smoke Type, 2023 to 2033

Figure 180: Middle East & Africa Market Y-o-Y Growth (%) Projections by Smoke Type, 2023 to 2033

Figure 181: Middle East & Africa Market Value (US$ Million) Analysis by Application, 2018 to 2033

Figure 182: Middle East & Africa Market Volume (MT) Analysis by Application, 2018 to 2033

Figure 183: Middle East & Africa Market Value Share (%) and BPS Analysis by Application, 2023 to 2033

Figure 184: Middle East & Africa Market Y-o-Y Growth (%) Projections by Application, 2023 to 2033

Figure 185: Middle East & Africa Market Value (US$ Million) Analysis by Distributional Channel, 2018 to 2033

Figure 186: Middle East & Africa Market Volume (MT) Analysis by Distributional Channel, 2018 to 2033

Figure 187: Middle East & Africa Market Value Share (%) and BPS Analysis by Distributional Channel, 2023 to 2033

Figure 188: Middle East & Africa Market Y-o-Y Growth (%) Projections by Distributional Channel, 2023 to 2033

Figure 189: Middle East & Africa Market Attractiveness by Smoke Type, 2023 to 2033

Figure 190: Middle East & Africa Market Attractiveness by Application, 2023 to 2033

Figure 191: Middle East & Africa Market Attractiveness by Distributional Channel, 2023 to 2033

Figure 192: Middle East & Africa Market Attractiveness by Country, 2023 to 2033

Recommendations

Food and Beverage

Smoked Yeast Market

Published : February 2023

Food and Beverage

Food Preservatives Market

Published : February 2023

Food and Beverage

Smoke Ingredients for Food Market

Published : October 2022

Food and Beverage

Natural Food Preservatives Market

Published : June 2022

Explore Food and Beverage Insights

View Reports