This site uses cookies, including third-party cookies, that help us to provide and improve our services.

Privacy Policy
- Global Locations -
Headquarters
Future Market Insights, Inc.
Christiana Corporate, 200 Continental Drive, Suite 401, Newark, Delaware - 19713, United States
T: +1-845-579-5705
MEA
Market Access DMCC

1602-6 Jumeirah Bay X2 Tower, Plot No: JLT-PH2-X2A,

Jumeirah Lakes Towers, Dubai,

United Arab Emirates

Americas
Future Market Insights
616 Corporate Way, Suite 2-9018,
Valley Cottage, NY 10989,
United States
T: +1-347-918-3531
Europe
Future Market Insights
3rd Floor, 207 Regent Street,
London W1B 3HH
United Kingdom
T: + 44 (0) 20 8123 9659
D: +44 (0) 20 3287 4268
APAC
Future Market Insights
Office No. 401-A, 4th Floor,
VANTAGE 9, S.No. 36/1/1,
Baner, Pune 411045 India

Saudi Arabia Drinking Water Market

Will Collaboration with Government Organizations in Saudi Arabia Resolve the Drinking Water Crisis? Explore How Companies are Capitalizing on this to Gain Revenue!

Saudi Arabia Drinking Water Market by Product Type, Water Resources, Bottle Capacity, End-User, Packaging Type & Sales Channel | Forecast 2022 to 2032

Saudi Arabia Drinking Water Market Outlook (2022 to 2032)

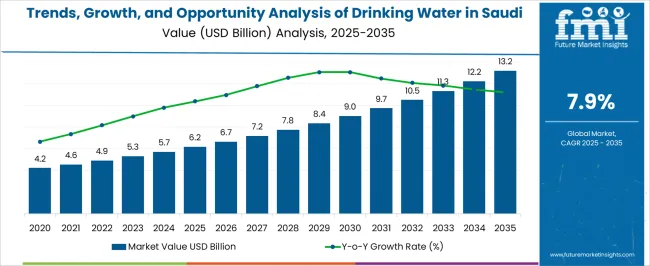
[301 Pages Report] Saudi Arabia drinking water market is estimated to reach US$ 5,329.3 Million in 2022 and is projected to reach US$ 11,262.8 Million by 2032, at a CAGR of 7.8% from 2022 to 2032. The share of Saudi Arabia's drinking water market in the global drinking water market is expected to be ~2%-4%.

As per the Royal Embassy of Saudi Arabia (RES), the country is the world’s largest producer of desalinated water. As Saudi Arabia is a desert country with no natural source of water through rivers or lakes, the demand for potable water is expected to remain high over the upcoming decade.

Hence, the Ministry of Water and Electricity and leading providers are handling water matters in the country. As per the RES, the Saline Water Conversion Corporation (SWCC) operates around 27 desalination stations, producing over 3 million cubic meters/day of drinking water, which is over 70% of the water used in the cities.

Further, drinking water scarcity in the country is expected to be the key factor propelling the demand in the market. On the back of these aforementioned factors, the sales in the market are poised to grow two-fold over the forecast period (2022 to 2032).

Attribute

Key Insights

Estimated Saudi Arabia Drinking Water Market Size 2022

US$ 5,329.3 Million

Projected Market Size (2032)

US$ 11,262.8 Million

Value CAGR (2022 to 2032)

7.8%

Market Top Players Share in 2021

~10-12%

Don't pay for what you don't need

Customize your report by selecting specific countries or regions and save 30%!

2017 to 2021 Saudi Arabia Drinking Water Market Outlook Compared to 2022 to 2032 Forecast

As per Future Market Insights (FMI), the rising scarcity of drinking water in Saudi Arabia is creating a conducive environment for key players in the market. Hence, key manufacturers are developing advanced techniques to supply safe, clean, and consumable drinking water.

Growth in the market is expected to burgeon as key manufacturers are including vitamin and mineral-rich drinking water in their products. Concerns about multiple health problems caused by contaminated water, such as neurological ailments, gastrointestinal diseases, and reproductive problems, will boost the demand in the market.

Further, bottled water companies claim that their bottles' seals protect water from bacterial contamination regardless of storage duration. Meanwhile, rising health awareness is generating a shift in demand for safer, more efficient, nutritious, and refreshing beverages that are calorie-free, caffeine-free, or free of other artificial chemicals, driving demand for bottled water.

Saudi Arabia Drinking Water Market Download Report Brochure

What are the Key Trends Improving the Drinking Water Market in Saudi Arabia?

  • Introduction of Flavored and Mineral-Rich Water to Drive the Demand in the Market

Carbonated water containing caffeine and phosphoric acid lead to digestive issues, weight gain, heartburn, and other health issues. High sugar content coupled with acidity in carbonated water has resulted in a shift from carbonated beverages to healthy, low-calorie, flavored water.

Also, the rising inclination towards consuming healthier drinks containing less or no sugar is boosting the demand in the market. Due to this, companies have also shifted their focus towards developing healthy beverages such as flavored and functional water.

For instance, ‘Flo Drinks’ launched a series of natural mineral water products under the brand name - Flo Essence Water. These products are infused with natural sugar-free flavors at a pH of 7. Hence, this provides a handful of opportunities for manufacturers to cater to changing needs of consumers and match their tastes and preferences.

Sneha Verghese
Sneha Verghese
Principal Consultant
LinkedIn
Talk to Analyst

Find your sweet spots for generating winning opportunities in this market.

Talk to Analyst

What is Driving Demand for Saudi Arabia Drinking Water Market?

Limited access to clean tap water in the country is resulting in aiding the consumption of bottled water. Consumers in the country face problems related to poor quality/contaminated tap water, which is a factor fueling the growth in Saudi Arabia drinking water market.

These rising instances of municipal mismanagement of mineral water in the country have negatively impacted tap water consumption. This is expected to increase the demand for bottled water in the country.

As a result, the rising preference for bottled water over tap water among consumers due to hygiene and safety has increased the demand for bottled water in the drinking water market.

Category-wise Insights

Which Product Type Will Generate the Maximum Revenue in Saudi Arabia's Drinking Water Market?

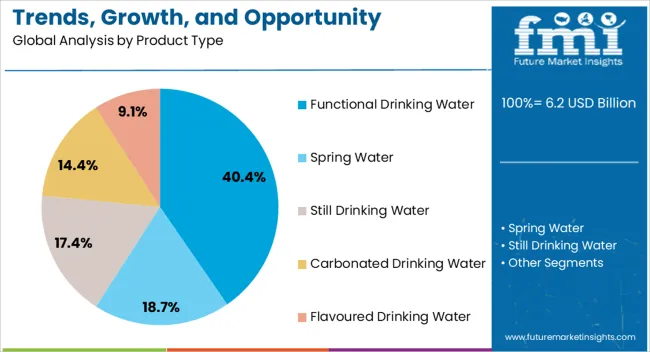
Functional Water to Contribute Nearly 2/5th of Sales in Saudi Arabia Drinking Water Market

According to the study, functional water holds the major share of 39.7% of the drinking water market of Saudi Arabia. Sales in the market are anticipated to grow at a CAGR of 6.0% during the forecast period.

Bottled water companies are focusing on producing functional water, such as zero-calorie herbal water containing herbal extracts. This is anticipated to contribute significantly to the market growth due to increased worries over rising obesity levels. Several manufacturers are introducing new products into the market to capitalize on the growing opportunities in this category.

Various manufacturers are introducing multiple fruits, herbs, and mineral flavors to enhance the taste of water and other additional health benefits. With rising fitness and health trends, the demand in the Saudi Arabia drinking water market will surge.

Which is the Leading Sales Channel in the Saudi Arabia Drinking Water Market?

Indirect Sales Channel to Remain Most Preferred in Drinking Water Market

In terms of sales, the indirect sales channels segment is anticipated to grow at a CAGR of 8.0% during the forecast period. The indirect sales channel holds a major share of 71.3% of the overall Saudi Arabia drinking water market.

Different sales channels are used to ensure the availability of bottled water to consumers. Further, the proliferation of online channels through an e-commerce platform and the company website is pushing the sales of potable water at a robust pace.

Also, revenue via offline channels such as hypermarkets/supermarkets, departmental stores, convenience stores, and others is expected to burgeon in the Saudi Arabia drinking water market. As bulk purchasers prefer online channels attributing to faster and easier delivery, growth in the indirect sales channel segment is expected to spur.

Which Packaging Type is Preferred in Saudi Arabia's Drinking Water Market?

PET Bottles to Remain Highly Sought-After in Drinking Water Market

In terms of packaging type, PET bottles generate high demand for drinking water and hold a share of 49.0%. As per the study, it is anticipated to grow at a CAGR of 8.6% during the forecast period.

Plastic bottles, when manufactured, cause damage to the environment by leaving tons of carbon dioxide in the atmosphere. Hence, the development of recyclable and eco-friendly packaging materials for bottled water is harmless for the environment and it is expected to open up new opportunities for various players in the market.

For instance, Nestlé launched the bottled water brand ‘Natural Spring Water', which is offered in 100% recycled plastic (rPET), excluding the label and cap.

Get the data you need at a Fraction of the cost

Personalize your report by choosing insights you need
and save 40%!

Competitive Landscape

Companies operating in the Saudi Arabia drinking water market are aiming at strategic collaborations and various marketing strategies to expand their customer base. Leading companies are focusing on attracting a vast audience with product innovation by introducing innovative ways of packaging, and new product development and by strengthening the supply chain across Saudi Arabia.

For instance,

  • Naqi Water released its new website in 2021 to provide a digital platform for receiving water orders from clients, in addition to the company's mobile application accessible on Apple's IOS and Android platforms, and the customer service account via the WhatsApp digital platform. The company also acquired 45,173.5 square meters of land to enhance its expansion plans.
  • In 2020, Nestle launched energy-water drinks and mineral-infused bottled waters among its new releases. The company also approved a new strategic direction for its Waters business by sharpening its focus on its iconic international brands and its leading premium mineral water brands and investing in differentiated healthy hydration, such as functional water products

Massive Opportunities Await Global Businesses as Demand for Bottled Drinking Water in Saudi Arabia Skyrockets

The high demand for safe and hygienic water continues to grow in Saudi Arabia. Numerous manufacturers have a strong presence in the country, owing to the significant demand for drinking and bottled water. To boost their presence in the country, leading players are focusing on partnerships with government bodies. Further, manufacturers are also focusing on engaging in corporate social responsibility (CSR) activities to boost their perception.

For instance, in 2022, PepsiCo and the Saudi Irrigation Organization (SIO) signed a Memorandum of Understanding (MoU) to advance scientific cooperation efforts pertaining to water conservation measures. This cooperation provides the best irrigation methods and addresses the country's water sustainability issues.

Nestlé, another leading player in the country, is focusing on boosting its presence through corporate social responsibility (CSR) activities. For instance, in 2022, the company donated approximately three million food and beverage servings to relief operations managed by various organizations in Saudi Arabia. This initiative benefitted 23,000 families and 14,000 healthcare workers. Nestlé now employs close to 5,600 employees across twelve offices and seven water facilities in Saudi Arabia.

Further, Nestle is also focusing on harnessing renewable energy sources to boost its drinking water facilities. In 2021, the company announced that a solar power plant with a capacity of 2,400 megawatt-hours of renewable electricity would be put into operation at Nestlé Pure Life's factory in Dubai. This solar plant has been built in partnership with Yellow Door Energy.

Nestlé Pure Life, the top-selling bottled water brand in the Middle East and North Africa, has more than 2,500 solar panels on a carport structure. The six-meter-tall carport building offers shade to 72 delivery vehicles for Nestlé Waters. Robots routinely clean the panels' surfaces to maximize energy generation efficiency and enhance aesthetics.

Agthia, another key player in Saudi Arabia, is focusing on increasing its presence in the country through massive investments. With a greenfield investment of Dh90 million ($24.5 million), Agthia is extending its operations in Saudi Arabia by establishing a manufacturing facility. Sales are anticipated to begin in the second half of 2023 at the new operation in Jeddah.

Scope of Report

Attribute

Details

Estimated Market Size 2022

US$ 5,329.3 Million

Projected Market Size (2032)

US$ 11,262.8 Million

Value CAGR (2022 to 2032)

7.8%

Forecast Period

2022 to 2032

Historical Data Available for

2017 to 2021

Market Analysis

US$ Million for Value

Key Countries Covered

Saudi Arabia

Key Segments Covered

Product Type, Water Resources, Bottle Capacity, End-User, Packaging Type, and Sales Channel

Key Companies Profiled

  • Nestlé S. A.
  • Hayat Water
  • Al Hada Water Co. Ltd.
  • Naqi Water
  • Arwa
  • Dome
  • Tania
  • Berain
  • Al-Qassim Healthy Water
  • Hana Water
  • Al Ain Water
  • Dala Company
  • Fayha Water
  • Safawater. qa
  • Aquafina (PepsiCo, Inc.)
  • Najed
  • Nova
  • Manahel
  • Safa
  • Mazen
  • Al-Manhel
  • Other (as per request)

Report Coverage

Market Forecast, Company Share Analysis, Competition Intelligence, DROT Analysis, Market Dynamics and Challenges, and Strategic Growth Initiatives

Saudi Arabia Drinking Water Market by Category

By Product Type:

  • Still Drinking Water
  • Carbonated Drinking Water
  • Flavoured Drinking Water
  • Functional Drinking Water
  • Spring Water

By Water Resources:

  • Surface Water
  • Groundwater
    • Renewable Groundwater
    • Non-renewable Groundwater
  • Non-Conventional Water Resources
    • Desalinated Seawater
    • Treated Wastewater

By Bottle Capacity:

  • 100-300 ml
  • 300-750 ml
  • 1,000-1,500 ml
  • 5,000 ml
  • 15,000 ml
  • 15,000-20,000 ml
  • More than 20,000 ml

By End-User:

  • Commercial
    • Quick Service Restaurants
    • Fine Dining
    • Casual Dining
    • Cafes
    • Bars/Pub
  • Residential

By Packaging Type:

  • PET Bottle
  • Glass Bottle
  • Stand-up Pouches
  • Retort Pouches

By Sales Channel:

  • Direct
  • Indirect
    • Hypermarkets/ Supermarkets
    • Departmental store
    • Convenience Store
    • Online Retailers
    • Drug Stores
    • Other Sales Channel

Frequently Asked Questions

The Saudi Arabia drinking water market reached a valuation of US$ 4,991.0 million in 2021.

The Saudi Arabia drinking water market grew at 6.9% CAGR between 2017 and 2021.

Growing popularity of online stores, new product lines, rising trends of premium bottled water, easy accessibility on portals, etc. are the key trends in the market.

Leading players operating in the Saudi Arabia drinking water market are Nestlé S. A., Hayat Water, Al Hada Water Co. Ltd., Naqi Water, Arwa, Dome, Tania, Berain, Al-Qassim Healthy Water, Hana Water, Al Ain Water, Dala Company, Fayha Water, Safawater.qa, Aquafina (PepsiCo, Inc.), Najed, Nova, Manahel, Safa, Mazen, and Al-Manhel among others.

Leading players in the Saudi Arabia drinking water market are estimated to account for approximately ~8%-12% of the total market share.

Table of Content

1. Executive Summary | Saudi Arabia Drinking Water Market

    1.1. Saudi Arabia Market Outlook

    1.2. Demand Side Trends

    1.3. Supply Side Trends

    1.4. FMI Analysis and Recommendations

2. Market Overview

    2.1. Market Taxonomy

    2.2. Market Definition

3. Key Market Trends

    3.1. Key Trends Impacting the Market

        3.1.1. Growing Health Concerns for Hygienic bottled drinking Water

        3.1.2. Convenience and Portability Associated with Bottled Drinking Water

        3.1.3. Bottled drinking Water over Tap Water

        3.1.4. Product Introduction with Health Benefit Positioning

        3.1.5. Increasing Obesity Rate Boosts Demand for Flavored and Functional Water

    3.2. Product Innovation Trends

    3.3. Future Prospects of Saudi Industry

        3.3.1. Factors Fueling Growth

        3.3.2. Influx of Brands

        3.3.3. Innovative Distribution & Marketing Strategies

4. Saudi Market Demand Analysis 2017 to 2021 and Forecast, 2022 to 2032

    4.1. Historical Market Volume (Liters) Analysis, 2017 to 2021

    4.2. Current and Future Market Volume (Liters) Projections, 2022 to 2032

    4.3. Y-o-Y Growth Trend Analysis

5. Saudi Market - Pricing Analysis

    5.1. Regional Pricing Analysis By Product Type

    5.2. Pricing Break-up

        5.2.1. Manufacturer Level Pricing

        5.2.2. Distributor Level Pricing

    5.3. Average Pricing Analysis Benchmark

6. Saudi Market Demand (in Value or in US$ Million) Analysis 2017 to 2021 and Forecast, 2022 to 2032

    6.1. Historical Market Value (US$ Million) and Volume (Liters) Analysis, 2017 to 2021

    6.2. Current and Future Market Value (US$ Million) Volume (Liters) Projections, 2022 to 2032

        6.2.1. Y-o-Y Growth Trend Analysis

        6.2.2. Absolute $ Opportunity Analysis

7. Market Background

    7.1. Key Regulations & Government Initiatives

        7.1.1. Packaging & Labelling Regulations

        7.1.2. Certifications and Certifying Agency Overview

        7.1.3. Import/Export Policies

        7.1.4. Formula Requirements

        7.1.5. Standards as per institutions

    7.2. Macro-Economic Factors

        7.2.1. Saudi Arabia GDP Growth Outlook

        7.2.2. Saudi Arabia E-Commerce Industry Outlook

        7.2.3. Saudi Arabia Consumer Spending Outlook

        7.2.4. Saudi Arabia Manufacturing Industry Outlook

        7.2.5. Saudi Arabia Retail Sector GVA and Growth

        7.2.6. Saudi Arabia Urbanization Overview

        7.2.7. Saudi Arabia Outbreak of Covid-19 Pandemic

        7.2.8. Saudi Arabia Economic Instability

        7.2.9. Saudi Arabia Income Group Population Overview

        7.2.10. Saudi Arabia Impact on Online Sales

    7.3. Forecast Factors - Relevance & Impact

    7.4. Industry Value and Supply Chain Analysis

        7.4.1. Operating Margins at Each Node of Supply Chain

        7.4.2. List of Active Market Participants

            7.4.2.1. Raw Material Suppliers

            7.4.2.2. Product Manufacturers

        7.4.3. List of Distributors

    7.5. Market Dynamics

        7.5.1. Drivers

        7.5.2. Restraints

        7.5.3. Opportunity Analysis

    7.6. PESTLE Analysis of the Saudi Market

    7.7. Investment Feasibility Matrix

    7.8. Porter’s Five Force

8. Saudi Market Analysis 2017 to 2021 and Forecast 2022 to 2032, by Product Type

    8.1. Introduction / Key Findings

    8.2. Historical Market Size (US$ Million) and Volume Analysis By Product Type, 2017 to 2021

    8.3. Current and Future Market Size (US$ Million) and Volume Analysis and Forecast By Product Type, 2022 to 2032

        8.3.1. Still Drinking Water

        8.3.2. Carbonated Drinking Water

        8.3.3. Flavored Drinking Water

        8.3.4. Functional Drinking Water

        8.3.5. Spring Water

    8.4. Market Attractiveness Analysis By Product Type

9. Saudi Market Analysis 2017 to 2021 and Forecast 2022 to 2032, by Water Resources

    9.1. Introduction / Key Findings

    9.2. Historical Market Size (US$ Million) and Volume Analysis By Water Resources, 2017 to 2021

    9.3. Current and Future Market Size (US$ Million) and Volume Analysis and Forecast By Water Resources, 2022 to 2032

        9.3.1. Surface Water

        9.3.2. Groundwater

            9.3.2.1. Renewable Groundwater

            9.3.2.2. Non-renewable Groundwater

        9.3.3. Non-Conventional Water Resources

            9.3.3.1. Desalinated Seawater

            9.3.3.2. Treated Wastewater

    9.4. Market Attractiveness Analysis By Water Resources

10. Saudi Market Analysis 2017 to 2021 and Forecast 2022 to 2032, by Bottle Capacity

    10.1. Introduction / Key Findings

    10.2. Historical Market Size (US$ Million) and Volume Analysis By Bottle Capacity, 2017 to 2021

    10.3. Current and Future Market Size (US$ Million) and Volume Analysis and Forecast By Bottle Capacity, 2022 to 2032

        10.3.1. 100-300 ml

        10.3.2. 300-750 ml

        10.3.3. 1,000-1,500 ml

        10.3.4. 5,000 ml

        10.3.5. 15,000 ml

        10.3.6. 15,000-20,000 ml

        10.3.7. More than 20,000 ml

    10.4. Market Attractiveness Analysis By Bottle Capacity

11. Saudi Market Analysis 2017 to 2021 and Forecast 2022 to 2032, by End-User

    11.1. Introduction / Key Findings

    11.2. Historical Market Size (US$ Million) and Volume Analysis By End-User, 2017 to 2021

    11.3. Current and Future Market Size (US$ Million) and Volume Analysis and Forecast By End-User, 2022 to 2032

        11.3.1. Commercial

            11.3.1.1. Quick Service Restaurants

            11.3.1.2. Fine Dining

            11.3.1.3. Casual Dining

            11.3.1.4. Cafes

            11.3.1.5. Bars/Pub

        11.3.2. Residential

    11.4. Market Attractiveness Analysis By End-User

12. Saudi Market Analysis 2017 to 2021 and Forecast 2022 to 2032, by Packaging Type

    12.1. Introduction / Key Findings

    12.2. Historical Market Size (US$ Million) and Volume Analysis By Packaging Type, 2017 to 2021

    12.3. Current and Future Market Size (US$ Million) and Volume Analysis and Forecast By Packaging Type, 2022 to 2032

        12.3.1. PET Bottle

        12.3.2. Glass Bottle

        12.3.3. Stand-up Pouches

        12.3.4. Retort Pouches

    12.4. Market Attractiveness Analysis By Packaging Type

13. Saudi Market Analysis 2017 to 2021 and Forecast 2022 to 2032, by Sales Channel

    13.1. Introduction / Key Findings

    13.2. Historical Market Size (US$ Million) and Volume Analysis By Sales Channel, 2017 to 2021

    13.3. Current and Future Market Size (US$ Million) and Volume Analysis and Forecast By Sales Channel, 2022 to 2032

        13.3.1. Direct

        13.3.2. Indirect

            13.3.2.1. Hypermarkets/ Supermarkets

            13.3.2.2. Departmental store

            13.3.2.3. Convenience Store

            13.3.2.4. Online Retailers

            13.3.2.5. Drug Stores

            13.3.2.6. Other Sales Channel

    13.4. Market Attractiveness Analysis By Sales Channel

14. Market Structure Analysis

    14.1. Market Analysis by Tier of Companies

    14.2. Market Concentration

    14.3. Market Share Analysis of Top Players

    14.4. Market Presence Analysis

        14.4.1. By Regional footprint of Players

        14.4.2. Product foot print by Players

        14.4.3. Channel Foot Print by Players

15. Competition Analysis

    15.1. Competition Dashboard

    15.2. Pricing Analysis by Competition

    15.3. Competition Benchmarking

    15.4. Competition Deep Dive

        15.4.1. Nestlé S. A.

            15.4.1.1. Overview

            15.4.1.2. Product Portfolio

            15.4.1.3. Profitability by Market Segments (Product/Channel/Region)

            15.4.1.4. Distribution Footprint

            15.4.1.5. Strategy Overview

        15.4.2. Hayat Water

            15.4.2.1. Overview

            15.4.2.2. Product Portfolio

            15.4.2.3. Profitability by Market Segments (Product/Channel/Region)

            15.4.2.4. Distribution Footprint

            15.4.2.5. Strategy Overview

        15.4.3. Al Hada Water Co. Ltd.

            15.4.3.1. Overview

            15.4.3.2. Product Portfolio

            15.4.3.3. Profitability by Market Segments (Product/Channel/Region)

            15.4.3.4. Distribution Footprint

            15.4.3.5. Strategy Overview

        15.4.4. Naqi Water

            15.4.4.1. Overview

            15.4.4.2. Product Portfolio

            15.4.4.3. Profitability by Market Segments (Product/Channel/Region)

            15.4.4.4. Distribution Footprint

            15.4.4.5. Strategy Overview

        15.4.5. Arwa

            15.4.5.1. Overview

            15.4.5.2. Product Portfolio

            15.4.5.3. Profitability by Market Segments (Product/Channel/Region)

            15.4.5.4. Distribution Footprint

            15.4.5.5. Strategy Overview

        15.4.6. Dome

            15.4.6.1. Overview

            15.4.6.2. Product Portfolio

            15.4.6.3. Profitability by Market Segments (Product/Channel/Region)

            15.4.6.4. Distribution Footprint

            15.4.6.5. Strategy Overview

        15.4.7. Tania

            15.4.7.1. Overview

            15.4.7.2. Product Portfolio

            15.4.7.3. Profitability by Market Segments (Product/Channel/Region)

            15.4.7.4. Distribution Footprint

            15.4.7.5. Strategy Overview

        15.4.8. Berain

            15.4.8.1. Overview

            15.4.8.2. Product Portfolio

            15.4.8.3. Profitability by Market Segments (Product/Channel/Region)

            15.4.8.4. Distribution Footprint

            15.4.8.5. Strategy Overview

        15.4.9. Al-Qassim Healthy Water

            15.4.9.1. Overview

            15.4.9.2. Product Portfolio

            15.4.9.3. Profitability by Market Segments (Product/Channel/Region)

            15.4.9.4. Distribution Footprint

            15.4.9.5. Strategy Overview

        15.4.10. Hana Water

            15.4.10.1. Overview

            15.4.10.2. Product Portfolio

            15.4.10.3. Profitability by Market Segments (Product/Channel/Region)

            15.4.10.4. Distribution Footprint

            15.4.10.5. Strategy Overview

        15.4.11. Al Ain Water

            15.4.11.1. Overview

            15.4.11.2. Product Portfolio

            15.4.11.3. Profitability by Market Segments (Product/Channel/Region)

            15.4.11.4. Distribution Footprint

            15.4.11.5. Strategy Overview

        15.4.12. Dala Company

            15.4.12.1. Overview

            15.4.12.2. Product Portfolio

            15.4.12.3. Profitability by Market Segments (Product/Channel/Region)

            15.4.12.4. Distribution Footprint

            15.4.12.5. Strategy Overview

        15.4.13. Fayha Water

            15.4.13.1. Overview

            15.4.13.2. Product Portfolio

            15.4.13.3. Profitability by Market Segments (Product/Channel/Region)

            15.4.13.4. Distribution Footprint

            15.4.13.5. Strategy Overview

        15.4.14. Safawater.qa

            15.4.14.1. Overview

            15.4.14.2. Product Portfolio

            15.4.14.3. Profitability by Market Segments (Product/Channel/Region)

            15.4.14.4. Distribution Footprint

            15.4.14.5. Strategy Overview

        15.4.15. Aquafina (PepsiCo, Inc.)

            15.4.15.1. Overview

            15.4.15.2. Product Portfolio

            15.4.15.3. Profitability by Market Segments (Product/Channel/Region)

            15.4.15.4. Distribution Footprint

            15.4.15.5. Strategy Overview

        15.4.16. Najed

            15.4.16.1. Overview

            15.4.16.2. Product Portfolio

            15.4.16.3. Profitability by Market Segments (Product/Channel/Region)

            15.4.16.4. Distribution Footprint

            15.4.16.5. Strategy Overview

        15.4.17. Nova

            15.4.17.1. Overview

            15.4.17.2. Product Portfolio

            15.4.17.3. Profitability by Market Segments (Product/Channel/Region)

            15.4.17.4. Distribution Footprint

            15.4.17.5. Strategy Overview

        15.4.18. Manahel

            15.4.18.1. Overview

            15.4.18.2. Product Portfolio

            15.4.18.3. Profitability by Market Segments (Product/Channel/Region)

            15.4.18.4. Distribution Footprint

            15.4.18.5. Strategy Overview

        15.4.19. Safa

            15.4.19.1. Overview

            15.4.19.2. Product Portfolio

            15.4.19.3. Profitability by Market Segments (Product/Channel/Region)

            15.4.19.4. Distribution Footprint

            15.4.19.5. Strategy Overview

        15.4.20. Mazen

            15.4.20.1. Overview

            15.4.20.2. Product Portfolio

            15.4.20.3. Profitability by Market Segments (Product/Channel/Region)

            15.4.20.4. Distribution Footprint

            15.4.20.5. Strategy Overview

        15.4.21. Al-Manhel

            15.4.21.1. Overview

            15.4.21.2. Product Portfolio

            15.4.21.3. Profitability by Market Segments (Product/Channel/Region)

            15.4.21.4. Distribution Footprint

            15.4.21.5. Strategy Overview

        15.4.22. Others (As per Request)

            15.4.22.1. Overview

            15.4.22.2. Product Portfolio

            15.4.22.3. Profitability by Market Segments (Product/Channel/Region)

            15.4.22.4. Distribution Footprint

            15.4.22.5. Strategy Overview

16. Consumer Behaviour Analysis

    16.1. Value Spend of Target Product

    16.2. Path to Purchase: Paved with Digitization

    16.3. Influence of Packaging on Purchasing

    16.4. Brand Loyalty: Head Vs Heart

    16.5. Quest for Quality

    16.6. Factors Influencing Market Behavior by the Customers of all Age Group

    16.7. Key Challenges Associated with the Market Suppliers

    16.8. Concerned Consumers towards Private Label Brands

    16.9. Social Media Sentiment Analysis

17. Assumptions and Acronyms Used

18. Research Methodology

Don't pay for what you don't need

Customize your report by selecting specific countries or regions and save 30%!

List of Tables

Table 1: Saudi Market Value (US$ Million) Forecast, By Product Type, 2017 to 2032

Table 2: Saudi Market Volume (Liters) Forecast, By Product Type, 2017 to 2032

Table 3: Saudi Market Value (US$ Million) Forecast, by Water Resources, 2017 to 2032

Table 4: Saudi Market Volume (Liters) Forecast, by Water Resources, 2017 to 2032

Table 5: Saudi Market Value (US$ Million) Forecast by Bottle Capacity, 2017 to 2032

Table 6: Saudi Market Volume (Liters) Forecast by Bottle Capacity, 2017 to 2032

Table 7: Saudi Market Value (US$ Million) Forecast by End-User, 2017 to 2032

Table 8: Saudi Market Volume (Liters) Forecast by End-User, 2017 to 2032

Table 9: Saudi Market Value (US$ Million) Forecast by Packaging Type, 2017 to 2032

Table 10: Saudi Market Volume (Liters) Forecast by Packaging Type, 2017 to 2032

Table 11: Saudi Market Value (US$ Million) Forecast, By Sales Channel, 2017 to 2032

Table 12: Saudi Market Volume (Liters) Forecast, By Sales Channel, 2017 to 2032
Sneha Verghese
Sneha Verghese
Principal Consultant
LinkedIn
Talk to Analyst

Find your sweet spots for generating winning opportunities in this market.

Talk to Analyst

List of Charts

Figure 01: Saudi Market Value (US$ Million) and Volume (Liters) Analysis, 2017 to 2021

Figure 02: Saudi Market Value (US$ Million) and Volume (Liters) Forecast, 2022 to 2032

Figure 03: Saudi Market Value (US$ Million) and Volume, 2017 to 2021

Figure 04: Saudi Market Absolute $ Opportunity (US$ Million), 2022 to 2032

Figure 05: Saudi Market Value (US$ Million) and Volume Forecast, 2022 to 2032

Figure 06: Saudi Market Value (US$ Million) by Product Type, 2017 to 2032

Figure 07: Saudi Market Volume (Liters) by Product Type, 2017 to 2032

Figure 08: Saudi Market Y-o-Y Growth (%) Projections by Product Type, 2022 to 2032

Figure 09: Saudi Market Attractiveness by Product Type, 2022 to 2032

Figure 10: Saudi Market Value (US$ Million) by Water Resources, 2017 to 2032

Figure 11: Saudi Market Volume (Liters) by Water Resources, 2017 to 2032

Figure 12: Saudi Market Y-o-Y Growth (%) Projections by Water Resources, 2022 to 2032

Figure 13: Saudi Market Attractiveness by Water Resources, 2022 to 2032

Figure 14: Saudi Market Value (US$ Million) by Bottle Capacity, 2017 to 2032

Figure 15: Saudi Market Volume (Liters) by Bottle Capacity, 2017 to 2032

Figure 16: Saudi Market Y-o-Y Growth (%) Projections by Bottle Capacity, 2022 to 2032

Figure 17: Saudi Market Attractiveness by Bottle Capacity, 2022 to 2032

Figure 18: Saudi Market Value (US$ Million) by End-User, 2017 to 2032

Figure 19: Saudi Market Volume (Liters) by End-User, 2017 to 2032

Figure 20: Saudi Market Y-o-Y Growth (%) Projections by End-User, 2022 to 2032

Figure 21: Saudi Market Attractiveness by End-User, 2022 to 2032

Figure 22: Saudi Market Value (US$ Million) by Packaging Type, 2017 to 2032

Figure 23: Saudi Market Volume (Liters) by Packaging Type, 2017 to 2032

Figure 24: Saudi Market Y-o-Y Growth (%) Projections by Packaging Type, 2022 to 2032

Figure 25: Saudi Market Attractiveness by Packaging Type, 2022 to 2032

Figure 26: Saudi Market Value (US$ Million) by Sales Channel, 2017 to 2032

Figure 27: Saudi Market Volume (Liters) by Sales Channel, 2017 to 2032

Figure 28: Saudi Market Y-o-Y Growth (%) Projections by Sales Channel, 2022 to 2032

Figure 29: Saudi Market Attractiveness by Sales Channel, 2022 to 2032

Recommendations

Food and Beverage

Functional Water Market

Published : February 2023

Packaging

Reusable Water Bottles Market

Published : October 2022

Consumer Product

Smart Water Bottle Market

Published : December 2021

Consumer Product

India POU Water Purifiers Market

Published : December 2014

Explore Consumer Product Insights

View Reports
Google translate

Saudi Arabia Drinking Water Market