Trends, Growth, and Opportunity Analysis of Outbound Tourism in France Size and Share Forecast Outlook 2025 to 2035

The Trends, Growth, and Opportunity Analysis of Outbound Tourism in France is estimated to be valued at USD 38.6 billion in 2025 and is projected to reach USD 59.4 billion by 2035, registering a compound annual growth rate (CAGR) of 4.4% over the forecast period.

The outbound tourism market in France is experiencing sustained growth, driven by rising disposable incomes, increasing international connectivity, and evolving consumer preferences for experiential travel. Tourists are increasingly seeking diverse destinations, personalized experiences, and convenience in travel planning. The market is supported by advancements in digital platforms, including online booking, travel management apps, and AI-powered recommendation systems that enhance trip customization and efficiency.

Growing awareness of cultural, leisure, and adventure tourism opportunities abroad is contributing to increased demand. Government initiatives to promote tourism, along with expanding air travel networks and competitive pricing strategies, are further enabling outbound travel. Demographic factors, such as a rising proportion of working professionals and young adults, are influencing the selection of international destinations.

As travelers increasingly prioritize safety, flexibility, and cost-effective options, the outbound tourism sector is positioned for long-term expansion Investments in sustainable tourism practices and experiential travel services are expected to create additional opportunities and reinforce market growth in the coming decade.
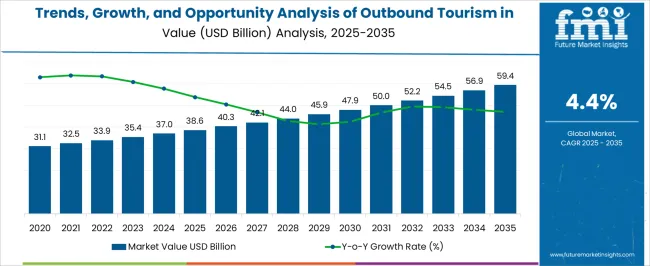
Quick Stats for Trends, Growth, and Opportunity Analysis of Outbound Tourism in France

  • Trends, Growth, and Opportunity Analysis of Outbound Tourism in France Industry Value (2025): USD 38.6 billion
  • Trends, Growth, and Opportunity Analysis of Outbound Tourism in France Forecast Value (2035): USD 59.4 billion
  • Trends, Growth, and Opportunity Analysis of Outbound Tourism in France Forecast CAGR: 4.4%
  • Leading Segment in Trends, Growth, and Opportunity Analysis of Outbound Tourism in France in 2025: 26-35 Years (34.1%)
  • Key Growth Region in Trends, Growth, and Opportunity Analysis of Outbound Tourism in France: North America, Asia-Pacific, Europe
  • Top Key Players in Trends, Growth, and Opportunity Analysis of Outbound Tourism in France: Tui France, France Billet, Ticketnet, Odalys Evasion, Global Business Travel France, Travel Lab SAS, Oui.Sncf SAS, Fram, Pv-Cp Distribution, Vacances Heliades

Trends, Growth, And Opportunity Analysis Of Outbound Tourism In France Market Value Analysis

Metric Value
Trends, Growth, and Opportunity Analysis of Outbound Tourism in France Estimated Value in (2025 E) USD 38.6 billion
Trends, Growth, and Opportunity Analysis of Outbound Tourism in France Forecast Value in (2035 F) USD 59.4 billion
Forecast CAGR (2025 to 2035) 4.4%

Segmental Analysis

The market is segmented by Age Distribution, Monthly Income, Gender, Purpose, Mode Of Transportation, Travel Frequency, and Peak Season and region. By Age Distribution, the market is divided into 26-35 Years, Under 18 Years, 18-25 Years, 36-45 Years, 46-55 Years, and Above 55 Years. In terms of Monthly Income, the market is classified into USD 4,000-7,999, Less Than USD 2,000, USD 2,000-3,999, USD 8,000-11,999, and USD 12,000 And Above. Based on Gender, the market is segmented into Male and Female. By Purpose, the market is divided into Vacations, Visiting Family And Friends, Business Trips, Study, and Others. By Mode Of Transportation, the market is segmented into Air, Rail, Sea, and Road. By Travel Frequency, the market is segmented into Several Times Each Year, Once Each Year, Once For Each 2-3 Years, and Others. By Peak Season, the market is segmented into April To June, October To December, July To September, and January To March. Regionally, the market is classified into North America, Latin America, Western Europe, Eastern Europe, Balkan & Baltic Countries, Russia & Belarus, Central Asia, East Asia, South Asia & Pacific, and the Middle East & Africa.
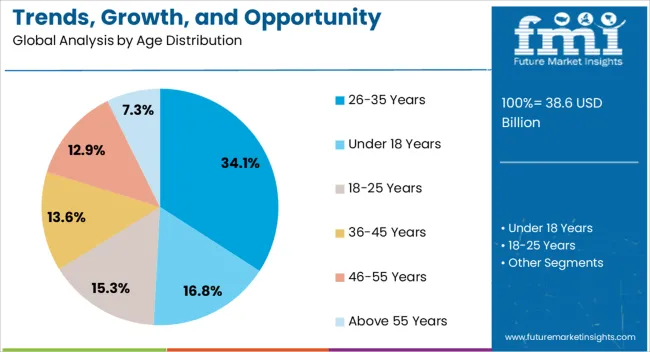
Insights into the 26-35 Years Age Distribution Segment

Trends, Growth, And Opportunity Analysis Of Outbound Tourism In France Analysis By Age Distribution

The 26-35 years age group is projected to hold 34.1% of the outbound tourism market revenue in France in 2025, establishing it as the leading age segment. This growth is driven by the high mobility, disposable income, and willingness to spend on international experiences within this demographic. Individuals in this age range are more likely to seek adventure, cultural exploration, and social experiences, leading to increased travel frequency.

The use of online travel platforms, social media influence, and peer recommendations further encourages outbound travel. Professional exposure, flexible work arrangements, and digital nomad trends are increasing travel propensity among this age group.

As expectations for personalized itineraries and seamless travel experiences rise, the 26-35 years segment continues to shape travel patterns, travel expenditure, and demand for innovative tourism services The ability of the industry to cater to their preferences, including multi-destination trips and experiential tourism, reinforces its leadership in the market.
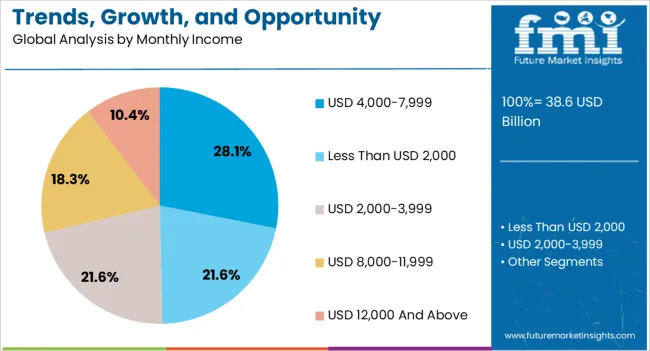
Insights into the USD 4,000-7,999 Monthly Income Segment

Trends, Growth, And Opportunity Analysis Of Outbound Tourism In France Analysis By Monthly Income

The USD 4,000-7,999 monthly income bracket is anticipated to account for 28.1% of outbound tourism revenue in France in 2025, making it the leading income segment. Growth is being driven by the disposable income available for discretionary spending on international travel and leisure experiences. Individuals in this income range have sufficient financial capacity to explore premium travel options, multi-destination itineraries, and curated experiences abroad.

The ability to afford flexible travel schedules and value-added services such as guided tours and cultural activities enhances travel adoption. Increased accessibility to digital booking platforms, dynamic pricing, and loyalty programs further stimulates travel decisions.

As consumers continue to seek unique, memorable, and personalized experiences, the USD 4,000-7,999 income segment plays a critical role in driving market growth The combination of financial capacity, travel awareness, and lifestyle aspirations ensures its continued dominance in shaping outbound tourism trends.
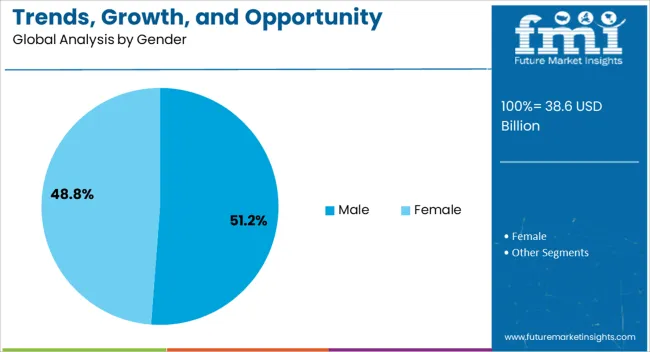
Insights into the Male Gender Segment

Trends, Growth, And Opportunity Analysis Of Outbound Tourism In France Analysis By Gender

The male segment is projected to hold 51.2% of outbound tourism revenue in France in 2025, positioning it as the leading gender category. Growth is supported by increased participation in business, adventure, and leisure travel, along with higher engagement in experiential tourism activities. Men in this segment are more likely to invest in multi-destination trips, international sports events, and cultural explorations, contributing to higher travel expenditure.

The adoption of digital travel planning tools, social media influence, and peer networks facilitates informed decision-making and enhances travel experiences. Rising professional mobility and exposure to global markets have increased the propensity of male travelers to explore international destinations.

As demand for personalized, convenient, and immersive travel experiences continues to grow, the male segment remains a primary driver of outbound tourism revenue The continued expansion of airline networks, flexible travel options, and digital engagement further reinforces the leadership of this segment in the market.

Infrastructure Advancements Enhancing Outbound Tourism Accessibility

Technology development has completely changed the outbound tourism sector by simplifying the process for tourists to plan trips, reserve lodging and flights, and obtain information while overseas. Social networking sites, internet travel companies, and mobile apps have all contributed to market trends of outbound tourism in France.

The availability and cost of modes of transportation like trains, airplanes, and rental cars influences the outbound tourism sector. New flight routes and high-speed rail networks, among other improvements to the transportation infrastructure, enable access to new locations and increase travel convenience.

France's economic stability and success significantly prompt the growth of the outbound tourist demand. Factors such as disposable income levels, employment rates, and GDP growth influence people's ability and willingness to travel overseas.

Trends and Future Projections in France Outbound Tourism Sector

In 2020, the France industry recorded an outbound tourism demand of USD 38.6 million. Sales of outbound tourism in France reached USD 35.3 million in 2025, expanding at a 4.0% CAGR from 2020 to 2025.

From 2020 to 2025, the French tourism industry expanded, spurred by expanding disposable income, improved air connectivity, and growing interest in foreign travel experiences. In 2025, France consolidated its spot as one of the world's leading outbound tourism sectors, with almost 50 million outbound visits and €60 billion in overseas expenditures.

Attributes Details
France’s Outbound Tourism Industry Revenue (2020) USD 38.6 million
Historical Industry Valuation (2025) USD 35.3 million
HCAGR (2020 to 2025) 4.0%

Forecasts indicate that outbound tourism demand continues its upward trend through 2025 and 2035, but at a slightly slower rate. The industry environment is likely to be determined by elements such as changing consumer choices, concerns about sustainability, and technological developments in travel services.

Outbound tourism providers serving the French sector ought to concentrate on individualized experiences, sustainable practices, and digital innovation to take advantage of the increasing demand and maintain their competitiveness in the dynamic market.

Challenges from Outdated Transport Systems in French Outbound Travel

Rapid technological improvements threaten established outbound tourism vendors by disrupting traditional tourism business models and distribution channels, as evidenced by the emergence of virtual reality experiences, sharing economy platforms, and online travel agencies.

The accessibility and convenience of travel to some areas inside France is constrained by inadequate or obsolete transportation infrastructure, including roads, trains, and airports, which harm outward tourism.

For French citizens, traveling abroad has many obstacles, including strict visa requirements, complicated travel documentation needs, and shifting immigration laws in target nations.

Category-wise Insights in the France Outbound Tourism Market

A thorough segmentation analysis of outbound tourism in France is included in this section. The producers of outbound tourism are closely monitoring market trends and the expanding demand in the April to June segment. Similarly, the 26-35 years segment outshines the age group segment.

April to June Segment Reigns Supreme in France Outbound Tourism Sector

Leading Peak Season Segment April to June
Market Share (2025) 38%

With perfect weather and longer daylight hours, April to June attracts more people to discover outbound destinations. A greater number of tourists arrive at outbound destinations during this period because many popular tourist attractions and events are set to occur during this season.

April to June are ideal choices for tourists on a tight budget because they are less expensive and have fewer crowds than the busiest summer months. Families have plenty of outbound tourism opportunities to take international vacations during school vacations and long weekends from April to June.

Driving Forces Behind 26-35 Years Segment Surge Outbound Tourism Trends

Leading Age Distribution Segment 26-35 years
Market Share (2025) 34.1%

Higher outbound tourism sales are frequently the result of the 26-35 age group's greater discretionary money and freedom to travel. The 26-35 age group of young professionals is full with travel and adventure seekers who want to make lasting memories.

The 26-35 age group has a strong desire to travel, which increases outbound tourism due to social media's significant influence. Based on trends, the 26-35 age group is more likely to value travel as a means of self-discovery and personal development, which strengthens sales in the outbound tourism sector.
Competitive Landscape of the French Outbound Tourism Industry

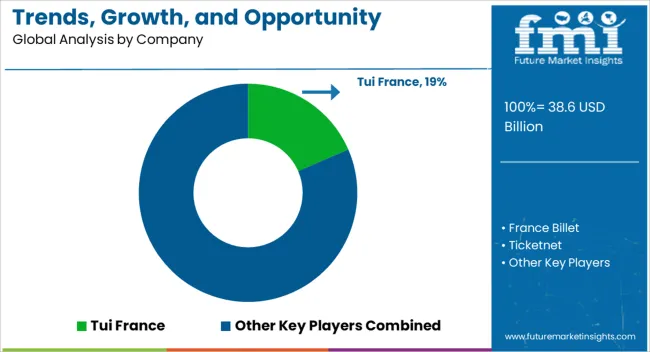
Trends, Growth, And Opportunity Analysis Of Outbound Tourism In France Analysis By Company

Within the highly competitive sector in France, several prominent outbound tourism providers compete for customer attention and market share. Major outbound tourism vendors operate in different outbound tourism segments to offer tourists a variety of experiences.

Tui France distinguishes itself by offering travel packages that cover various interests and price points and by having a vast network. Specializing in ticketing services, France Billet and Ticketnet enable easy reservations for events and attractions. With a variety of choices ranging from resorts to vacation rentals, Odalys Evasion specializes in vacation lodging.

Global Business Travel France offers specialized solutions for conferences and business travel, catering to business travelers. Travel Lab SAS strongly emphasizes immersive travel, creating one-of-a-kind itineraries and experiences for discriminating tourists.

Fram is recognized for its guided tours and holiday packages, which it offers to leisure tourists looking for hassle-free getaways. Travelers travel with peace of mind owing to Pv-Cp Distribution's offerings of travel insurance and associated services. Holidays Heliades caters to tourists with discriminating tastes and specializes in luxurious vacation experiences and exotic locations.

Leading outbound tourism providers strive in a changing market, always coming up with new ideas to satisfy changing customer needs. By emphasizing client happiness and providing exceptional service, they add to the dynamic environment of France's outbound tourist sector.

Noteworthy Advancements Observed in Outbound Tourism in France

  • Starting with the 'TUI Palma Marathon Mallorca,' TUI improves its brand with a new international sports sponsorship plan. TUI's commitment to travel to destinations is evident in its sponsorship, which uses its wide global reach and variety of sports offerings in hotels and clubs globally.
  • Prominent event and ticketing company CTS Eventim has increased its holding of France Billet to 65% after purchasing 17% of its shares from Fnac Darty. If the competition authority grants approval, this move will improve Eventim's reputation in the French outbound travel market. Fnac Darty has retained a 35% ownership stake to continue assisting France Billet with its ticketing services.

Key Highlights in the France Outbound Travel and Tourism Market Report

  • France Outbound Tourism Sector Detailed Analysis of Current Outlook with Future Forecasts
  • Trends In Outbound Tourism Industry in France
  • Restraints of the Outbound Tourism in France
  • Adjacent Study on France Outbound Tourism Industry, Russia Outbound Tourism Industry, and Germany Outbound Tourism Industry
  • Categorical Study of January to March, April to June, July to September, and October to December

Scope and Coverage of the France Outbound Tourism Market

Attribute Details
Estimated Valuation (2025) USD 38.6 billion
Projected Valuation (2035) USD 59.4 billion
Anticipated CAGR (2025 to 2035) 4.4%
Historical Analysis of Outbound Tourism in France 2020 to 2025
Demand Forecast for Outbound Tourism in France 2025 to 2035
Quantitative Units Revenue in USD million and CAGR from 2025 to 2035
Report Coverage Revenue Forecast, Company Ranking, Competitive Landscape, Growth Factors, Trends and Pricing Analysis
Key Companies Profiled Tui France; France Billet; Ticketnet; Odalys Evasion; Global Business Travel France; Travel Lab SAS; Oui.sncf SAS; Fram; Pv-Cp Distribution; Vacances Heliades; Other (on request)

Top Segments Studied in the France Outbound Tourism Market Research Report

By Age Distribution:

  • Under 18 years
  • 18-25 years
  • 26-35 years
  • 36-45 years
  • 46-55 years
  • Above 55 years

By Monthly Income:

  • Less than USD 2,000
  • USD 2,000-3,999
  • USD 4,000-7,999
  • USD 8,000-11,999
  • USD 12,000 and Above

By Gender:

  • Male
  • Female

By Purpose:

  • Vacations
  • Visiting Family and Friends
  • Business Trips
  • Study
  • Others

By Mode of Transportation:

  • Rail
  • Air
  • Sea
  • Road

By Travel Frequency:

  • Once each year
  • Several times each year
  • Once for each 2-3 years
  • Others

By Peak Season:

  • January to March
  • April to June
  • July to September
  • October to December

By Tour Category:

  • Package Travel
  • Semi-independent Travel
  • Group Tour
  • Independent Travel

By Categories:

  • Transport
  • Entertainment and Site Seeing
  • Travel Intermediaries
  • Shopping
  • Retail
  • Tipping

By Preference and Behaviors:

  • Value-Seeking Sightseer
  • Unplugged
  • Aspirant
  • Individualist
  • Backpacker
  • Shopper
  • Novice Traveler
  • Sophisticated Traveler

By Tourist Attraction Favored:

  • Sea/Beaches
  • Countryside
  • In the city
  • Mountain Tracking, Natural Places

By Length of Stay:

  • Nil nights
  • 1-3 nights
  • 4-7 nights
  • 8-14 nights
  • 15+ nights

By Top Destinations:

  • Spain
  • Italy
  • United Kingdom
  • Germany

Frequently Asked Questions

How big is the trends, growth, and opportunity analysis of outbound tourism in france in 2025?

The global trends, growth, and opportunity analysis of outbound tourism in france is estimated to be valued at USD 38.6 billion in 2025.

What will be the size of trends, growth, and opportunity analysis of outbound tourism in france in 2035?

The market size for the trends, growth, and opportunity analysis of outbound tourism in france is projected to reach USD 59.4 billion by 2035.

How much will be the trends, growth, and opportunity analysis of outbound tourism in france growth between 2025 and 2035?

The trends, growth, and opportunity analysis of outbound tourism in france is expected to grow at a 4.4% CAGR between 2025 and 2035.

What are the key product types in the trends, growth, and opportunity analysis of outbound tourism in france?

The key product types in trends, growth, and opportunity analysis of outbound tourism in france are 26-35 years, under 18 years, 18-25 years, 36-45 years, 46-55 years and above 55 years.

Which monthly income segment to contribute significant share in the trends, growth, and opportunity analysis of outbound tourism in france in 2025?

In terms of monthly income, usd 4,000-7,999 segment to command 28.1% share in the trends, growth, and opportunity analysis of outbound tourism in france in 2025.

Table of Content

  1. Executive Summary
    • Global Market Outlook
    • Demand-side Trends
    • Supply-side Trends
    • Technology Roadmap Analysis
    • Analysis and Recommendations
  2. Market Overview
    • Market Coverage / Taxonomy
    • Market Definition / Scope / Limitations
  3. Market Background
    • Market Dynamics
      • Drivers
      • Restraints
      • Opportunity
      • Trends
    • Scenario Forecast
      • Demand in Optimistic Scenario
      • Demand in Likely Scenario
      • Demand in Conservative Scenario
    • Opportunity Map Analysis
    • Product Life Cycle Analysis
    • Supply Chain Analysis
    • Investment Feasibility Matrix
    • Value Chain Analysis
    • PESTLE and Porter’s Analysis
    • Regulatory Landscape
    • Regional Parent Market Outlook
    • Production and Consumption Statistics
    • Import and Export Statistics
  4. Global Analysis 2020 to 2024 and Forecast, 2025 to 2035
    • Historical Market Size Value (USD Million) Analysis, 2020 to 2024
    • Current and Future Market Size Value (USD Million) Projections, 2025 to 2035
      • Y-o-Y Growth Trend Analysis
      • Absolute $ Opportunity Analysis
  5. Global Pricing Analysis 2020 to 2024 and Forecast 2025 to 2035
  6. Global Analysis 2020 to 2024 and Forecast 2025 to 2035, By Age Distribution
    • Introduction / Key Findings
    • Historical Market Size Value (USD Million) Analysis By Age Distribution , 2020 to 2024
    • Current and Future Market Size Value (USD Million) Analysis and Forecast By Age Distribution , 2025 to 2035
      • 26-35 Years
      • Under 18 Years
      • 18-25 Years
      • 36-45 Years
      • 46-55 Years
      • Above 55 Years
    • Y-o-Y Growth Trend Analysis By Age Distribution , 2020 to 2024
    • Absolute $ Opportunity Analysis By Age Distribution , 2025 to 2035
  7. Global Analysis 2020 to 2024 and Forecast 2025 to 2035, By Monthly Income
    • Introduction / Key Findings
    • Historical Market Size Value (USD Million) Analysis By Monthly Income, 2020 to 2024
    • Current and Future Market Size Value (USD Million) Analysis and Forecast By Monthly Income, 2025 to 2035
      • USD 4,000-7,999
      • Less Than USD 2,000
      • USD 2,000-3,999
      • USD 8,000-11,999
      • USD 12,000 And Above
    • Y-o-Y Growth Trend Analysis By Monthly Income, 2020 to 2024
    • Absolute $ Opportunity Analysis By Monthly Income, 2025 to 2035
  8. Global Analysis 2020 to 2024 and Forecast 2025 to 2035, By Gender
    • Introduction / Key Findings
    • Historical Market Size Value (USD Million) Analysis By Gender, 2020 to 2024
    • Current and Future Market Size Value (USD Million) Analysis and Forecast By Gender, 2025 to 2035
      • Male
      • Female
    • Y-o-Y Growth Trend Analysis By Gender, 2020 to 2024
    • Absolute $ Opportunity Analysis By Gender, 2025 to 2035
  9. Global Analysis 2020 to 2024 and Forecast 2025 to 2035, By Purpose
    • Introduction / Key Findings
    • Historical Market Size Value (USD Million) Analysis By Purpose, 2020 to 2024
    • Current and Future Market Size Value (USD Million) Analysis and Forecast By Purpose, 2025 to 2035
      • Vacations
      • Visiting Family And Friends
      • Business Trips
      • Study
      • Others
    • Y-o-Y Growth Trend Analysis By Purpose, 2020 to 2024
    • Absolute $ Opportunity Analysis By Purpose, 2025 to 2035
  10. Global Analysis 2020 to 2024 and Forecast 2025 to 2035, By Mode Of Transportation
    • Introduction / Key Findings
    • Historical Market Size Value (USD Million) Analysis By Mode Of Transportation, 2020 to 2024
    • Current and Future Market Size Value (USD Million) Analysis and Forecast By Mode Of Transportation, 2025 to 2035
      • Air
      • Rail
      • Sea
      • Road
    • Y-o-Y Growth Trend Analysis By Mode Of Transportation, 2020 to 2024
    • Absolute $ Opportunity Analysis By Mode Of Transportation, 2025 to 2035
  11. Global Analysis 2020 to 2024 and Forecast 2025 to 2035, By Travel Frequency
    • Introduction / Key Findings
    • Historical Market Size Value (USD Million) Analysis By Travel Frequency, 2020 to 2024
    • Current and Future Market Size Value (USD Million) Analysis and Forecast By Travel Frequency, 2025 to 2035
      • Several Times Each Year
      • Once Each Year
      • Once For Each 2-3 Years
      • Others
    • Y-o-Y Growth Trend Analysis By Travel Frequency, 2020 to 2024
    • Absolute $ Opportunity Analysis By Travel Frequency, 2025 to 2035
  12. Global Analysis 2020 to 2024 and Forecast 2025 to 2035, By Peak Season
    • Introduction / Key Findings
    • Historical Market Size Value (USD Million) Analysis By Peak Season, 2020 to 2024
    • Current and Future Market Size Value (USD Million) Analysis and Forecast By Peak Season, 2025 to 2035
      • April To June
      • October To December
      • July To September
      • January To March
    • Y-o-Y Growth Trend Analysis By Peak Season, 2020 to 2024
    • Absolute $ Opportunity Analysis By Peak Season, 2025 to 2035
  13. Global Analysis 2020 to 2024 and Forecast 2025 to 2035, By Region
    • Introduction
    • Historical Market Size Value (USD Million) Analysis By Region, 2020 to 2024
    • Current Market Size Value (USD Million) Analysis and Forecast By Region, 2025 to 2035
      • North America
      • Latin America
      • Western Europe
      • Eastern Europe
      • East Asia
      • South Asia and Pacific
      • Middle East & Africa
    • Market Attractiveness Analysis By Region
  14. North America Analysis 2020 to 2024 and Forecast 2025 to 2035, By Country
    • Historical Market Size Value (USD Million) Trend Analysis By Market Taxonomy, 2020 to 2024
    • Market Size Value (USD Million) Forecast By Market Taxonomy, 2025 to 2035
      • By Country
        • USA
        • Canada
        • Mexico
      • By Age Distribution
      • By Monthly Income
      • By Gender
      • By Purpose
      • By Mode Of Transportation
      • By Travel Frequency
      • By Peak Season
    • Market Attractiveness Analysis
      • By Country
      • By Age Distribution
      • By Monthly Income
      • By Gender
      • By Purpose
      • By Mode Of Transportation
      • By Travel Frequency
      • By Peak Season
    • Key Takeaways
  15. Latin America Analysis 2020 to 2024 and Forecast 2025 to 2035, By Country
    • Historical Market Size Value (USD Million) Trend Analysis By Market Taxonomy, 2020 to 2024
    • Market Size Value (USD Million) Forecast By Market Taxonomy, 2025 to 2035
      • By Country
        • Brazil
        • Chile
        • Rest of Latin America
      • By Age Distribution
      • By Monthly Income
      • By Gender
      • By Purpose
      • By Mode Of Transportation
      • By Travel Frequency
      • By Peak Season
    • Market Attractiveness Analysis
      • By Country
      • By Age Distribution
      • By Monthly Income
      • By Gender
      • By Purpose
      • By Mode Of Transportation
      • By Travel Frequency
      • By Peak Season
    • Key Takeaways
  16. Western Europe Analysis 2020 to 2024 and Forecast 2025 to 2035, By Country
    • Historical Market Size Value (USD Million) Trend Analysis By Market Taxonomy, 2020 to 2024
    • Market Size Value (USD Million) Forecast By Market Taxonomy, 2025 to 2035
      • By Country
        • Germany
        • UK
        • Italy
        • Spain
        • France
        • Nordic
        • BENELUX
        • Rest of Western Europe
      • By Age Distribution
      • By Monthly Income
      • By Gender
      • By Purpose
      • By Mode Of Transportation
      • By Travel Frequency
      • By Peak Season
    • Market Attractiveness Analysis
      • By Country
      • By Age Distribution
      • By Monthly Income
      • By Gender
      • By Purpose
      • By Mode Of Transportation
      • By Travel Frequency
      • By Peak Season
    • Key Takeaways
  17. Eastern Europe Analysis 2020 to 2024 and Forecast 2025 to 2035, By Country
    • Historical Market Size Value (USD Million) Trend Analysis By Market Taxonomy, 2020 to 2024
    • Market Size Value (USD Million) Forecast By Market Taxonomy, 2025 to 2035
      • By Country
        • Russia
        • Poland
        • Hungary
        • Balkan & Baltic
        • Rest of Eastern Europe
      • By Age Distribution
      • By Monthly Income
      • By Gender
      • By Purpose
      • By Mode Of Transportation
      • By Travel Frequency
      • By Peak Season
    • Market Attractiveness Analysis
      • By Country
      • By Age Distribution
      • By Monthly Income
      • By Gender
      • By Purpose
      • By Mode Of Transportation
      • By Travel Frequency
      • By Peak Season
    • Key Takeaways
  18. East Asia Analysis 2020 to 2024 and Forecast 2025 to 2035, By Country
    • Historical Market Size Value (USD Million) Trend Analysis By Market Taxonomy, 2020 to 2024
    • Market Size Value (USD Million) Forecast By Market Taxonomy, 2025 to 2035
      • By Country
        • China
        • Japan
        • South Korea
      • By Age Distribution
      • By Monthly Income
      • By Gender
      • By Purpose
      • By Mode Of Transportation
      • By Travel Frequency
      • By Peak Season
    • Market Attractiveness Analysis
      • By Country
      • By Age Distribution
      • By Monthly Income
      • By Gender
      • By Purpose
      • By Mode Of Transportation
      • By Travel Frequency
      • By Peak Season
    • Key Takeaways
  19. South Asia and Pacific Analysis 2020 to 2024 and Forecast 2025 to 2035, By Country
    • Historical Market Size Value (USD Million) Trend Analysis By Market Taxonomy, 2020 to 2024
    • Market Size Value (USD Million) Forecast By Market Taxonomy, 2025 to 2035
      • By Country
        • India
        • ASEAN
        • Australia & New Zealand
        • Rest of South Asia and Pacific
      • By Age Distribution
      • By Monthly Income
      • By Gender
      • By Purpose
      • By Mode Of Transportation
      • By Travel Frequency
      • By Peak Season
    • Market Attractiveness Analysis
      • By Country
      • By Age Distribution
      • By Monthly Income
      • By Gender
      • By Purpose
      • By Mode Of Transportation
      • By Travel Frequency
      • By Peak Season
    • Key Takeaways
  20. Middle East & Africa Analysis 2020 to 2024 and Forecast 2025 to 2035, By Country
    • Historical Market Size Value (USD Million) Trend Analysis By Market Taxonomy, 2020 to 2024
    • Market Size Value (USD Million) Forecast By Market Taxonomy, 2025 to 2035
      • By Country
        • Kingdom of Saudi Arabia
        • Other GCC Countries
        • Turkiye
        • South Africa
        • Other African Union
        • Rest of Middle East & Africa
      • By Age Distribution
      • By Monthly Income
      • By Gender
      • By Purpose
      • By Mode Of Transportation
      • By Travel Frequency
      • By Peak Season
    • Market Attractiveness Analysis
      • By Country
      • By Age Distribution
      • By Monthly Income
      • By Gender
      • By Purpose
      • By Mode Of Transportation
      • By Travel Frequency
      • By Peak Season
    • Key Takeaways
  21. Key Countries Analysis
    • USA
      • Pricing Analysis
      • Market Share Analysis, 2024
        • By Age Distribution
        • By Monthly Income
        • By Gender
        • By Purpose
        • By Mode Of Transportation
        • By Travel Frequency
        • By Peak Season
    • Canada
      • Pricing Analysis
      • Market Share Analysis, 2024
        • By Age Distribution
        • By Monthly Income
        • By Gender
        • By Purpose
        • By Mode Of Transportation
        • By Travel Frequency
        • By Peak Season
    • Mexico
      • Pricing Analysis
      • Market Share Analysis, 2024
        • By Age Distribution
        • By Monthly Income
        • By Gender
        • By Purpose
        • By Mode Of Transportation
        • By Travel Frequency
        • By Peak Season
    • Brazil
      • Pricing Analysis
      • Market Share Analysis, 2024
        • By Age Distribution
        • By Monthly Income
        • By Gender
        • By Purpose
        • By Mode Of Transportation
        • By Travel Frequency
        • By Peak Season
    • Chile
      • Pricing Analysis
      • Market Share Analysis, 2024
        • By Age Distribution
        • By Monthly Income
        • By Gender
        • By Purpose
        • By Mode Of Transportation
        • By Travel Frequency
        • By Peak Season
    • Germany
      • Pricing Analysis
      • Market Share Analysis, 2024
        • By Age Distribution
        • By Monthly Income
        • By Gender
        • By Purpose
        • By Mode Of Transportation
        • By Travel Frequency
        • By Peak Season
    • UK
      • Pricing Analysis
      • Market Share Analysis, 2024
        • By Age Distribution
        • By Monthly Income
        • By Gender
        • By Purpose
        • By Mode Of Transportation
        • By Travel Frequency
        • By Peak Season
    • Italy
      • Pricing Analysis
      • Market Share Analysis, 2024
        • By Age Distribution
        • By Monthly Income
        • By Gender
        • By Purpose
        • By Mode Of Transportation
        • By Travel Frequency
        • By Peak Season
    • Spain
      • Pricing Analysis
      • Market Share Analysis, 2024
        • By Age Distribution
        • By Monthly Income
        • By Gender
        • By Purpose
        • By Mode Of Transportation
        • By Travel Frequency
        • By Peak Season
    • France
      • Pricing Analysis
      • Market Share Analysis, 2024
        • By Age Distribution
        • By Monthly Income
        • By Gender
        • By Purpose
        • By Mode Of Transportation
        • By Travel Frequency
        • By Peak Season
    • India
      • Pricing Analysis
      • Market Share Analysis, 2024
        • By Age Distribution
        • By Monthly Income
        • By Gender
        • By Purpose
        • By Mode Of Transportation
        • By Travel Frequency
        • By Peak Season
    • ASEAN
      • Pricing Analysis
      • Market Share Analysis, 2024
        • By Age Distribution
        • By Monthly Income
        • By Gender
        • By Purpose
        • By Mode Of Transportation
        • By Travel Frequency
        • By Peak Season
    • Australia & New Zealand
      • Pricing Analysis
      • Market Share Analysis, 2024
        • By Age Distribution
        • By Monthly Income
        • By Gender
        • By Purpose
        • By Mode Of Transportation
        • By Travel Frequency
        • By Peak Season
    • China
      • Pricing Analysis
      • Market Share Analysis, 2024
        • By Age Distribution
        • By Monthly Income
        • By Gender
        • By Purpose
        • By Mode Of Transportation
        • By Travel Frequency
        • By Peak Season
    • Japan
      • Pricing Analysis
      • Market Share Analysis, 2024
        • By Age Distribution
        • By Monthly Income
        • By Gender
        • By Purpose
        • By Mode Of Transportation
        • By Travel Frequency
        • By Peak Season
    • South Korea
      • Pricing Analysis
      • Market Share Analysis, 2024
        • By Age Distribution
        • By Monthly Income
        • By Gender
        • By Purpose
        • By Mode Of Transportation
        • By Travel Frequency
        • By Peak Season
    • Russia
      • Pricing Analysis
      • Market Share Analysis, 2024
        • By Age Distribution
        • By Monthly Income
        • By Gender
        • By Purpose
        • By Mode Of Transportation
        • By Travel Frequency
        • By Peak Season
    • Poland
      • Pricing Analysis
      • Market Share Analysis, 2024
        • By Age Distribution
        • By Monthly Income
        • By Gender
        • By Purpose
        • By Mode Of Transportation
        • By Travel Frequency
        • By Peak Season
    • Hungary
      • Pricing Analysis
      • Market Share Analysis, 2024
        • By Age Distribution
        • By Monthly Income
        • By Gender
        • By Purpose
        • By Mode Of Transportation
        • By Travel Frequency
        • By Peak Season
    • Kingdom of Saudi Arabia
      • Pricing Analysis
      • Market Share Analysis, 2024
        • By Age Distribution
        • By Monthly Income
        • By Gender
        • By Purpose
        • By Mode Of Transportation
        • By Travel Frequency
        • By Peak Season
    • Turkiye
      • Pricing Analysis
      • Market Share Analysis, 2024
        • By Age Distribution
        • By Monthly Income
        • By Gender
        • By Purpose
        • By Mode Of Transportation
        • By Travel Frequency
        • By Peak Season
    • South Africa
      • Pricing Analysis
      • Market Share Analysis, 2024
        • By Age Distribution
        • By Monthly Income
        • By Gender
        • By Purpose
        • By Mode Of Transportation
        • By Travel Frequency
        • By Peak Season
  22. Market Structure Analysis
    • Competition Dashboard
    • Competition Benchmarking
    • Market Share Analysis of Top Players
      • By Regional
      • By Age Distribution
      • By Monthly Income
      • By Gender
      • By Purpose
      • By Mode Of Transportation
      • By Travel Frequency
      • By Peak Season
  23. Competition Analysis
    • Competition Deep Dive
      • Tui France
        • Overview
        • Product Portfolio
        • Profitability by Market Segments (Product/Age /Sales Channel/Region)
        • Sales Footprint
        • Strategy Overview
          • Marketing Strategy
          • Product Strategy
          • Channel Strategy
      • France Billet
      • Ticketnet
      • Odalys Evasion
      • Global Business Travel France
      • Travel Lab SAS
      • Oui.Sncf SAS
      • Fram
      • Pv-Cp Distribution
      • Vacances Heliades
  24. Assumptions & Acronyms Used
  25. Research Methodology

List of Tables

  • Table 1: Global Value (USD Million) Forecast by Region, 2020-2035
  • Table 2: Global Value (USD Million) Forecast by Age Distribution , 2020-2035
  • Table 3: Global Value (USD Million) Forecast by Monthly Income, 2020-2035
  • Table 4: Global Value (USD Million) Forecast by Gender, 2020-2035
  • Table 5: Global Value (USD Million) Forecast by Purpose, 2020-2035
  • Table 6: Global Value (USD Million) Forecast by Mode Of Transportation, 2020-2035
  • Table 7: Global Value (USD Million) Forecast by Travel Frequency, 2020-2035
  • Table 8: Global Value (USD Million) Forecast by Peak Season, 2020-2035
  • Table 9: North America Value (USD Million) Forecast by Country, 2020-2035
  • Table 10: North America Value (USD Million) Forecast by Age Distribution , 2020-2035
  • Table 11: North America Value (USD Million) Forecast by Monthly Income, 2020-2035
  • Table 12: North America Value (USD Million) Forecast by Gender, 2020-2035
  • Table 13: North America Value (USD Million) Forecast by Purpose, 2020-2035
  • Table 14: North America Value (USD Million) Forecast by Mode Of Transportation, 2020-2035
  • Table 15: North America Value (USD Million) Forecast by Travel Frequency, 2020-2035
  • Table 16: North America Value (USD Million) Forecast by Peak Season, 2020-2035
  • Table 17: Latin America Value (USD Million) Forecast by Country, 2020-2035
  • Table 18: Latin America Value (USD Million) Forecast by Age Distribution , 2020-2035
  • Table 19: Latin America Value (USD Million) Forecast by Monthly Income, 2020-2035
  • Table 20: Latin America Value (USD Million) Forecast by Gender, 2020-2035
  • Table 21: Latin America Value (USD Million) Forecast by Purpose, 2020-2035
  • Table 22: Latin America Value (USD Million) Forecast by Mode Of Transportation, 2020-2035
  • Table 23: Latin America Value (USD Million) Forecast by Travel Frequency, 2020-2035
  • Table 24: Latin America Value (USD Million) Forecast by Peak Season, 2020-2035
  • Table 25: Western Europe Value (USD Million) Forecast by Country, 2020-2035
  • Table 26: Western Europe Value (USD Million) Forecast by Age Distribution , 2020-2035
  • Table 27: Western Europe Value (USD Million) Forecast by Monthly Income, 2020-2035
  • Table 28: Western Europe Value (USD Million) Forecast by Gender, 2020-2035
  • Table 29: Western Europe Value (USD Million) Forecast by Purpose, 2020-2035
  • Table 30: Western Europe Value (USD Million) Forecast by Mode Of Transportation, 2020-2035
  • Table 31: Western Europe Value (USD Million) Forecast by Travel Frequency, 2020-2035
  • Table 32: Western Europe Value (USD Million) Forecast by Peak Season, 2020-2035
  • Table 33: Eastern Europe Value (USD Million) Forecast by Country, 2020-2035
  • Table 34: Eastern Europe Value (USD Million) Forecast by Age Distribution , 2020-2035
  • Table 35: Eastern Europe Value (USD Million) Forecast by Monthly Income, 2020-2035
  • Table 36: Eastern Europe Value (USD Million) Forecast by Gender, 2020-2035
  • Table 37: Eastern Europe Value (USD Million) Forecast by Purpose, 2020-2035
  • Table 38: Eastern Europe Value (USD Million) Forecast by Mode Of Transportation, 2020-2035
  • Table 39: Eastern Europe Value (USD Million) Forecast by Travel Frequency, 2020-2035
  • Table 40: Eastern Europe Value (USD Million) Forecast by Peak Season, 2020-2035
  • Table 41: East Asia Value (USD Million) Forecast by Country, 2020-2035
  • Table 42: East Asia Value (USD Million) Forecast by Age Distribution , 2020-2035
  • Table 43: East Asia Value (USD Million) Forecast by Monthly Income, 2020-2035
  • Table 44: East Asia Value (USD Million) Forecast by Gender, 2020-2035
  • Table 45: East Asia Value (USD Million) Forecast by Purpose, 2020-2035
  • Table 46: East Asia Value (USD Million) Forecast by Mode Of Transportation, 2020-2035
  • Table 47: East Asia Value (USD Million) Forecast by Travel Frequency, 2020-2035
  • Table 48: East Asia Value (USD Million) Forecast by Peak Season, 2020-2035
  • Table 49: South Asia and Pacific Value (USD Million) Forecast by Country, 2020-2035
  • Table 50: South Asia and Pacific Value (USD Million) Forecast by Age Distribution , 2020-2035
  • Table 51: South Asia and Pacific Value (USD Million) Forecast by Monthly Income, 2020-2035
  • Table 52: South Asia and Pacific Value (USD Million) Forecast by Gender, 2020-2035
  • Table 53: South Asia and Pacific Value (USD Million) Forecast by Purpose, 2020-2035
  • Table 54: South Asia and Pacific Value (USD Million) Forecast by Mode Of Transportation, 2020-2035
  • Table 55: South Asia and Pacific Value (USD Million) Forecast by Travel Frequency, 2020-2035
  • Table 56: South Asia and Pacific Value (USD Million) Forecast by Peak Season, 2020-2035
  • Table 57: Middle East & Africa Value (USD Million) Forecast by Country, 2020-2035
  • Table 58: Middle East & Africa Value (USD Million) Forecast by Age Distribution , 2020-2035
  • Table 59: Middle East & Africa Value (USD Million) Forecast by Monthly Income, 2020-2035
  • Table 60: Middle East & Africa Value (USD Million) Forecast by Gender, 2020-2035
  • Table 61: Middle East & Africa Value (USD Million) Forecast by Purpose, 2020-2035
  • Table 62: Middle East & Africa Value (USD Million) Forecast by Mode Of Transportation, 2020-2035
  • Table 63: Middle East & Africa Value (USD Million) Forecast by Travel Frequency, 2020-2035
  • Table 64: Middle East & Africa Value (USD Million) Forecast by Peak Season, 2020-2035

List of Figures

  • Figure 1: Global Pricing Analysis
  • Figure 2: Global Value (USD Million) Forecast 2020-2035
  • Figure 3: Global Value Share and BPS Analysis by Age Distribution , 2025 and 2035
  • Figure 4: Global Y-o-Y Growth Comparison by Age Distribution , 2025-2035
  • Figure 5: Global Attractiveness Analysis by Age Distribution
  • Figure 6: Global Value Share and BPS Analysis by Monthly Income, 2025 and 2035
  • Figure 7: Global Y-o-Y Growth Comparison by Monthly Income, 2025-2035
  • Figure 8: Global Attractiveness Analysis by Monthly Income
  • Figure 9: Global Value Share and BPS Analysis by Gender, 2025 and 2035
  • Figure 10: Global Y-o-Y Growth Comparison by Gender, 2025-2035
  • Figure 11: Global Attractiveness Analysis by Gender
  • Figure 12: Global Value Share and BPS Analysis by Purpose, 2025 and 2035
  • Figure 13: Global Y-o-Y Growth Comparison by Purpose, 2025-2035
  • Figure 14: Global Attractiveness Analysis by Purpose
  • Figure 15: Global Value Share and BPS Analysis by Mode Of Transportation, 2025 and 2035
  • Figure 16: Global Y-o-Y Growth Comparison by Mode Of Transportation, 2025-2035
  • Figure 17: Global Attractiveness Analysis by Mode Of Transportation
  • Figure 18: Global Value Share and BPS Analysis by Travel Frequency, 2025 and 2035
  • Figure 19: Global Y-o-Y Growth Comparison by Travel Frequency, 2025-2035
  • Figure 20: Global Attractiveness Analysis by Travel Frequency
  • Figure 21: Global Value Share and BPS Analysis by Peak Season, 2025 and 2035
  • Figure 22: Global Y-o-Y Growth Comparison by Peak Season, 2025-2035
  • Figure 23: Global Attractiveness Analysis by Peak Season
  • Figure 24: Global Value (USD Million) Share and BPS Analysis by Region, 2025 and 2035
  • Figure 25: Global Y-o-Y Growth Comparison by Region, 2025-2035
  • Figure 26: Global Attractiveness Analysis by Region
  • Figure 27: North America Incremental Dollar Opportunity, 2025-2035
  • Figure 28: Latin America Incremental Dollar Opportunity, 2025-2035
  • Figure 29: Western Europe Incremental Dollar Opportunity, 2025-2035
  • Figure 30: Eastern Europe Incremental Dollar Opportunity, 2025-2035
  • Figure 31: East Asia Incremental Dollar Opportunity, 2025-2035
  • Figure 32: South Asia and Pacific Incremental Dollar Opportunity, 2025-2035
  • Figure 33: Middle East & Africa Incremental Dollar Opportunity, 2025-2035
  • Figure 34: North America Value Share and BPS Analysis by Country, 2025 and 2035
  • Figure 35: North America Value Share and BPS Analysis by Age Distribution , 2025 and 2035
  • Figure 36: North America Y-o-Y Growth Comparison by Age Distribution , 2025-2035
  • Figure 37: North America Attractiveness Analysis by Age Distribution
  • Figure 38: North America Value Share and BPS Analysis by Monthly Income, 2025 and 2035
  • Figure 39: North America Y-o-Y Growth Comparison by Monthly Income, 2025-2035
  • Figure 40: North America Attractiveness Analysis by Monthly Income
  • Figure 41: North America Value Share and BPS Analysis by Gender, 2025 and 2035
  • Figure 42: North America Y-o-Y Growth Comparison by Gender, 2025-2035
  • Figure 43: North America Attractiveness Analysis by Gender
  • Figure 44: North America Value Share and BPS Analysis by Purpose, 2025 and 2035
  • Figure 45: North America Y-o-Y Growth Comparison by Purpose, 2025-2035
  • Figure 46: North America Attractiveness Analysis by Purpose
  • Figure 47: North America Value Share and BPS Analysis by Mode Of Transportation, 2025 and 2035
  • Figure 48: North America Y-o-Y Growth Comparison by Mode Of Transportation, 2025-2035
  • Figure 49: North America Attractiveness Analysis by Mode Of Transportation
  • Figure 50: North America Value Share and BPS Analysis by Travel Frequency, 2025 and 2035
  • Figure 51: North America Y-o-Y Growth Comparison by Travel Frequency, 2025-2035
  • Figure 52: North America Attractiveness Analysis by Travel Frequency
  • Figure 53: North America Value Share and BPS Analysis by Peak Season, 2025 and 2035
  • Figure 54: North America Y-o-Y Growth Comparison by Peak Season, 2025-2035
  • Figure 55: North America Attractiveness Analysis by Peak Season
  • Figure 56: Latin America Value Share and BPS Analysis by Country, 2025 and 2035
  • Figure 57: Latin America Value Share and BPS Analysis by Age Distribution , 2025 and 2035
  • Figure 58: Latin America Y-o-Y Growth Comparison by Age Distribution , 2025-2035
  • Figure 59: Latin America Attractiveness Analysis by Age Distribution
  • Figure 60: Latin America Value Share and BPS Analysis by Monthly Income, 2025 and 2035
  • Figure 61: Latin America Y-o-Y Growth Comparison by Monthly Income, 2025-2035
  • Figure 62: Latin America Attractiveness Analysis by Monthly Income
  • Figure 63: Latin America Value Share and BPS Analysis by Gender, 2025 and 2035
  • Figure 64: Latin America Y-o-Y Growth Comparison by Gender, 2025-2035
  • Figure 65: Latin America Attractiveness Analysis by Gender
  • Figure 66: Latin America Value Share and BPS Analysis by Purpose, 2025 and 2035
  • Figure 67: Latin America Y-o-Y Growth Comparison by Purpose, 2025-2035
  • Figure 68: Latin America Attractiveness Analysis by Purpose
  • Figure 69: Latin America Value Share and BPS Analysis by Mode Of Transportation, 2025 and 2035
  • Figure 70: Latin America Y-o-Y Growth Comparison by Mode Of Transportation, 2025-2035
  • Figure 71: Latin America Attractiveness Analysis by Mode Of Transportation
  • Figure 72: Latin America Value Share and BPS Analysis by Travel Frequency, 2025 and 2035
  • Figure 73: Latin America Y-o-Y Growth Comparison by Travel Frequency, 2025-2035
  • Figure 74: Latin America Attractiveness Analysis by Travel Frequency
  • Figure 75: Latin America Value Share and BPS Analysis by Peak Season, 2025 and 2035
  • Figure 76: Latin America Y-o-Y Growth Comparison by Peak Season, 2025-2035
  • Figure 77: Latin America Attractiveness Analysis by Peak Season
  • Figure 78: Western Europe Value Share and BPS Analysis by Country, 2025 and 2035
  • Figure 79: Western Europe Value Share and BPS Analysis by Age Distribution , 2025 and 2035
  • Figure 80: Western Europe Y-o-Y Growth Comparison by Age Distribution , 2025-2035
  • Figure 81: Western Europe Attractiveness Analysis by Age Distribution
  • Figure 82: Western Europe Value Share and BPS Analysis by Monthly Income, 2025 and 2035
  • Figure 83: Western Europe Y-o-Y Growth Comparison by Monthly Income, 2025-2035
  • Figure 84: Western Europe Attractiveness Analysis by Monthly Income
  • Figure 85: Western Europe Value Share and BPS Analysis by Gender, 2025 and 2035
  • Figure 86: Western Europe Y-o-Y Growth Comparison by Gender, 2025-2035
  • Figure 87: Western Europe Attractiveness Analysis by Gender
  • Figure 88: Western Europe Value Share and BPS Analysis by Purpose, 2025 and 2035
  • Figure 89: Western Europe Y-o-Y Growth Comparison by Purpose, 2025-2035
  • Figure 90: Western Europe Attractiveness Analysis by Purpose
  • Figure 91: Western Europe Value Share and BPS Analysis by Mode Of Transportation, 2025 and 2035
  • Figure 92: Western Europe Y-o-Y Growth Comparison by Mode Of Transportation, 2025-2035
  • Figure 93: Western Europe Attractiveness Analysis by Mode Of Transportation
  • Figure 94: Western Europe Value Share and BPS Analysis by Travel Frequency, 2025 and 2035
  • Figure 95: Western Europe Y-o-Y Growth Comparison by Travel Frequency, 2025-2035
  • Figure 96: Western Europe Attractiveness Analysis by Travel Frequency
  • Figure 97: Western Europe Value Share and BPS Analysis by Peak Season, 2025 and 2035
  • Figure 98: Western Europe Y-o-Y Growth Comparison by Peak Season, 2025-2035
  • Figure 99: Western Europe Attractiveness Analysis by Peak Season
  • Figure 100: Eastern Europe Value Share and BPS Analysis by Country, 2025 and 2035
  • Figure 101: Eastern Europe Value Share and BPS Analysis by Age Distribution , 2025 and 2035
  • Figure 102: Eastern Europe Y-o-Y Growth Comparison by Age Distribution , 2025-2035
  • Figure 103: Eastern Europe Attractiveness Analysis by Age Distribution
  • Figure 104: Eastern Europe Value Share and BPS Analysis by Monthly Income, 2025 and 2035
  • Figure 105: Eastern Europe Y-o-Y Growth Comparison by Monthly Income, 2025-2035
  • Figure 106: Eastern Europe Attractiveness Analysis by Monthly Income
  • Figure 107: Eastern Europe Value Share and BPS Analysis by Gender, 2025 and 2035
  • Figure 108: Eastern Europe Y-o-Y Growth Comparison by Gender, 2025-2035
  • Figure 109: Eastern Europe Attractiveness Analysis by Gender
  • Figure 110: Eastern Europe Value Share and BPS Analysis by Purpose, 2025 and 2035
  • Figure 111: Eastern Europe Y-o-Y Growth Comparison by Purpose, 2025-2035
  • Figure 112: Eastern Europe Attractiveness Analysis by Purpose
  • Figure 113: Eastern Europe Value Share and BPS Analysis by Mode Of Transportation, 2025 and 2035
  • Figure 114: Eastern Europe Y-o-Y Growth Comparison by Mode Of Transportation, 2025-2035
  • Figure 115: Eastern Europe Attractiveness Analysis by Mode Of Transportation
  • Figure 116: Eastern Europe Value Share and BPS Analysis by Travel Frequency, 2025 and 2035
  • Figure 117: Eastern Europe Y-o-Y Growth Comparison by Travel Frequency, 2025-2035
  • Figure 118: Eastern Europe Attractiveness Analysis by Travel Frequency
  • Figure 119: Eastern Europe Value Share and BPS Analysis by Peak Season, 2025 and 2035
  • Figure 120: Eastern Europe Y-o-Y Growth Comparison by Peak Season, 2025-2035
  • Figure 121: Eastern Europe Attractiveness Analysis by Peak Season
  • Figure 122: East Asia Value Share and BPS Analysis by Country, 2025 and 2035
  • Figure 123: East Asia Value Share and BPS Analysis by Age Distribution , 2025 and 2035
  • Figure 124: East Asia Y-o-Y Growth Comparison by Age Distribution , 2025-2035
  • Figure 125: East Asia Attractiveness Analysis by Age Distribution
  • Figure 126: East Asia Value Share and BPS Analysis by Monthly Income, 2025 and 2035
  • Figure 127: East Asia Y-o-Y Growth Comparison by Monthly Income, 2025-2035
  • Figure 128: East Asia Attractiveness Analysis by Monthly Income
  • Figure 129: East Asia Value Share and BPS Analysis by Gender, 2025 and 2035
  • Figure 130: East Asia Y-o-Y Growth Comparison by Gender, 2025-2035
  • Figure 131: East Asia Attractiveness Analysis by Gender
  • Figure 132: East Asia Value Share and BPS Analysis by Purpose, 2025 and 2035
  • Figure 133: East Asia Y-o-Y Growth Comparison by Purpose, 2025-2035
  • Figure 134: East Asia Attractiveness Analysis by Purpose
  • Figure 135: East Asia Value Share and BPS Analysis by Mode Of Transportation, 2025 and 2035
  • Figure 136: East Asia Y-o-Y Growth Comparison by Mode Of Transportation, 2025-2035
  • Figure 137: East Asia Attractiveness Analysis by Mode Of Transportation
  • Figure 138: East Asia Value Share and BPS Analysis by Travel Frequency, 2025 and 2035
  • Figure 139: East Asia Y-o-Y Growth Comparison by Travel Frequency, 2025-2035
  • Figure 140: East Asia Attractiveness Analysis by Travel Frequency
  • Figure 141: East Asia Value Share and BPS Analysis by Peak Season, 2025 and 2035
  • Figure 142: East Asia Y-o-Y Growth Comparison by Peak Season, 2025-2035
  • Figure 143: East Asia Attractiveness Analysis by Peak Season
  • Figure 144: South Asia and Pacific Value Share and BPS Analysis by Country, 2025 and 2035
  • Figure 145: South Asia and Pacific Value Share and BPS Analysis by Age Distribution , 2025 and 2035
  • Figure 146: South Asia and Pacific Y-o-Y Growth Comparison by Age Distribution , 2025-2035
  • Figure 147: South Asia and Pacific Attractiveness Analysis by Age Distribution
  • Figure 148: South Asia and Pacific Value Share and BPS Analysis by Monthly Income, 2025 and 2035
  • Figure 149: South Asia and Pacific Y-o-Y Growth Comparison by Monthly Income, 2025-2035
  • Figure 150: South Asia and Pacific Attractiveness Analysis by Monthly Income
  • Figure 151: South Asia and Pacific Value Share and BPS Analysis by Gender, 2025 and 2035
  • Figure 152: South Asia and Pacific Y-o-Y Growth Comparison by Gender, 2025-2035
  • Figure 153: South Asia and Pacific Attractiveness Analysis by Gender
  • Figure 154: South Asia and Pacific Value Share and BPS Analysis by Purpose, 2025 and 2035
  • Figure 155: South Asia and Pacific Y-o-Y Growth Comparison by Purpose, 2025-2035
  • Figure 156: South Asia and Pacific Attractiveness Analysis by Purpose
  • Figure 157: South Asia and Pacific Value Share and BPS Analysis by Mode Of Transportation, 2025 and 2035
  • Figure 158: South Asia and Pacific Y-o-Y Growth Comparison by Mode Of Transportation, 2025-2035
  • Figure 159: South Asia and Pacific Attractiveness Analysis by Mode Of Transportation
  • Figure 160: South Asia and Pacific Value Share and BPS Analysis by Travel Frequency, 2025 and 2035
  • Figure 161: South Asia and Pacific Y-o-Y Growth Comparison by Travel Frequency, 2025-2035
  • Figure 162: South Asia and Pacific Attractiveness Analysis by Travel Frequency
  • Figure 163: South Asia and Pacific Value Share and BPS Analysis by Peak Season, 2025 and 2035
  • Figure 164: South Asia and Pacific Y-o-Y Growth Comparison by Peak Season, 2025-2035
  • Figure 165: South Asia and Pacific Attractiveness Analysis by Peak Season
  • Figure 166: Middle East & Africa Value Share and BPS Analysis by Country, 2025 and 2035
  • Figure 167: Middle East & Africa Value Share and BPS Analysis by Age Distribution , 2025 and 2035
  • Figure 168: Middle East & Africa Y-o-Y Growth Comparison by Age Distribution , 2025-2035
  • Figure 169: Middle East & Africa Attractiveness Analysis by Age Distribution
  • Figure 170: Middle East & Africa Value Share and BPS Analysis by Monthly Income, 2025 and 2035
  • Figure 171: Middle East & Africa Y-o-Y Growth Comparison by Monthly Income, 2025-2035
  • Figure 172: Middle East & Africa Attractiveness Analysis by Monthly Income
  • Figure 173: Middle East & Africa Value Share and BPS Analysis by Gender, 2025 and 2035
  • Figure 174: Middle East & Africa Y-o-Y Growth Comparison by Gender, 2025-2035
  • Figure 175: Middle East & Africa Attractiveness Analysis by Gender
  • Figure 176: Middle East & Africa Value Share and BPS Analysis by Purpose, 2025 and 2035
  • Figure 177: Middle East & Africa Y-o-Y Growth Comparison by Purpose, 2025-2035
  • Figure 178: Middle East & Africa Attractiveness Analysis by Purpose
  • Figure 179: Middle East & Africa Value Share and BPS Analysis by Mode Of Transportation, 2025 and 2035
  • Figure 180: Middle East & Africa Y-o-Y Growth Comparison by Mode Of Transportation, 2025-2035
  • Figure 181: Middle East & Africa Attractiveness Analysis by Mode Of Transportation
  • Figure 182: Middle East & Africa Value Share and BPS Analysis by Travel Frequency, 2025 and 2035
  • Figure 183: Middle East & Africa Y-o-Y Growth Comparison by Travel Frequency, 2025-2035
  • Figure 184: Middle East & Africa Attractiveness Analysis by Travel Frequency
  • Figure 185: Middle East & Africa Value Share and BPS Analysis by Peak Season, 2025 and 2035
  • Figure 186: Middle East & Africa Y-o-Y Growth Comparison by Peak Season, 2025-2035
  • Figure 187: Middle East & Africa Attractiveness Analysis by Peak Season
  • Figure 188: Global - Tier Structure Analysis
  • Figure 189: Global - Company Share Analysis
Dashboard
Dashboard
Dashboard
Dashboard
Dashboard
Dashboard

Full Research Suite comprises of:

Market outlook & trends analysis

Market outlook & trends analysis

Interviews & case studies

Interviews & case studies

Strategic recommendations

Strategic recommendations

Vendor profiles & capabilities analysis

Vendor profiles & capabilities analysis

5-year forecasts

5-year forecasts

8 regions and 60+ country-level data splits

8 regions and 60+ country-level data splits

Market segment data splits

Market segment data splits

12 months of continuous data updates

12 months of continuous data updates

DELIVERED AS:

PDF EXCEL ONLINE

Full Research Suite


$2000

$3500

$5000

Buy Report Now
Similar Industry Reports

Similar Industry Reports

Trends, Growth, and Opportunity Analysis of Drinking Water in Saudi Arabia

Trends, Growth, and Opportunity Analysis of Drinking Water in Saudi Arabia Forecast and Outlook 2025 to 2035

Trends, Growth, and Opportunity Analysis of Micro-investing Platform in Australia

Trends, Growth, and Opportunity Analysis of Micro-investing Platform in Australia Size and Share Forecast Outlook 2025 to 2035

Trends, Growth, and Opportunity Analysis of Pea Protein in South Korea

Trends, Growth, and Opportunity Analysis of Pea Protein in South Korea Size and Share Forecast Outlook 2025 to 2035

Trends, Growth, and Opportunity Analysis of Shisha Tobacco in GCC Countries

Trends, Growth, and Opportunity Analysis of Shisha Tobacco in GCC Countries Forecast and Outlook 2025 to 2035

Trends, Growth, and Opportunity Analysis of Data Center Facility in Morocco

Trends, Growth, and Opportunity Analysis of Data Center Facility in Morocco Size and Share Forecast Outlook 2025 to 2035

Trends, Growth, and Opportunity Analysis of the Europe Connected Car Industry

Europe Connected Car Market Growth - Trends & Forecast through 2034

Trends, Growth, and Opportunity Analysis of Tourism in Burma

Trends, Growth, and Opportunity Analysis of Tourism in Burma Market Forecast and Outlook 2025 to 2035

Trends, Growth, and Opportunity Analysis of Rail Tourism in Europe

Trends, Growth, and Opportunity Analysis of Rail Tourism in Europe Market Forecast and Outlook 2025 to 2035

Trends, Growth, and Opportunity Analysis of Casino Tourism in Monaco

Monaco Casino Tourism Industry Trends – Growth & Forecast through 2034

Trends, Growth, and Opportunity Analysis of Sports Tourism in South Africa

Trends, Growth, and Opportunity Analysis of Sports Tourism in South Africa Size and Share Forecast Outlook 2025 to 2035

Trends, Growth, and Opportunity Analysis of Medical Tourism in the United Kingdom

UK Medical Tourism Market Analysis – Growth & Forecast 2024-2034

Trends, Growth, and Opportunity Analysis of Culinary Tourism in Italy

Trends, Growth, and Opportunity Analysis of Culinary Tourism in Italy Size and Share Forecast Outlook 2025 to 2035

Trends, Growth, and Opportunity Analysis of Sustainable Tourism in Thailand

Trends, Growth, and Opportunity Analysis of Sustainable Tourism in Thailand Size and Share Forecast Outlook 2025 to 2035

Trends, Growth, and Opportunity Analysis of Sustainable Tourism in Indonesia

Indonesia Sustainable Tourism Market Growth – Forecast 2024-2034

Trends, Growth, and Opportunity Analysis of Outbound Tourism in China

Trends, Growth, and Opportunity Analysis of Outbound Tourism in China Market Forecast and Outlook 2025 to 2035

Trends, Growth, and Opportunity Analysis of Outbound Tourism in GCC Countries

Outbound Tourism in GCC Countries - Trends, Growth, and Opportunity Analysis (2024 to 2034)

Trends, Growth, and Opportunity Analysis of Outbound Tourism in the United States

United States Outbound Tourism Market Analysis - Size, Share, and Forecast 2024 to 2034

Trends, Growth, Opportunity Analysis of Medical Tourism in Thailand

Trends, Growth, Opportunity Analysis of Medical Tourism in Thailand Size and Share Forecast Outlook 2025 to 2035

Hair Regrowth Treatments Market

Hair Regrowth Treatments Market Size and Share Forecast Outlook 2025 to 2035

Future Market Insights

Trends, Growth, and Opportunity Analysis of Outbound Tourism in France

Chat With MaRIA

Chat With

MaRIA

Hi There, I am MaRIA, Your Market Research Intelligence Assistant. How may I help you?